. 2017 Jan 10;18(2):391-405.
doi: 10.1016/j.celrep.2016.12.041.

Coupled Proliferation and Apoptosis Maintain the Rapid Turnover of Microglia in the Adult Brain

Affiliations

Coupled Proliferation and Apoptosis Maintain the Rapid Turnover of Microglia in the Adult Brain

Katharine Askew et al. Cell Rep. .

Abstract

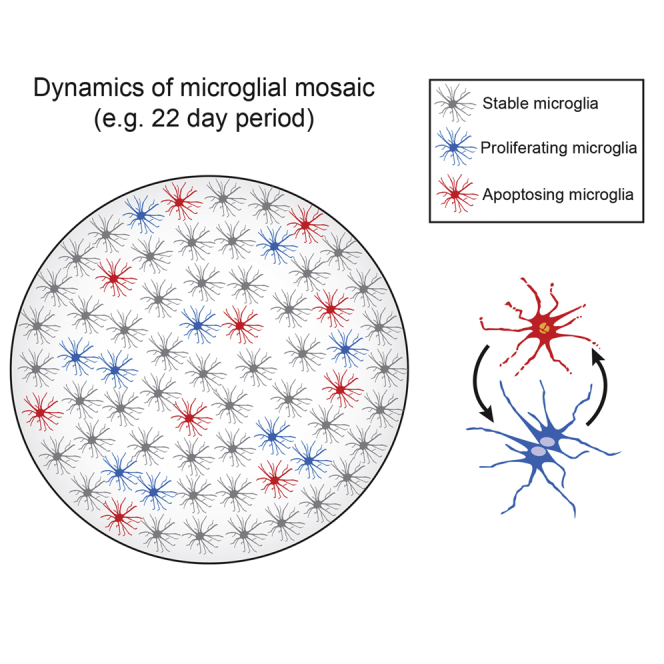
Microglia play key roles in brain development, homeostasis, and function, and it is widely assumed that the adult population is long lived and maintained by self-renewal. However, the precise temporal and spatial dynamics of the microglial population are unknown. We show in mice and humans that the turnover of microglia is remarkably fast, allowing the whole population to be renewed several times during a lifetime. The number of microglial cells remains steady from late postnatal stages until aging and is maintained by the spatial and temporal coupling of proliferation and apoptosis, as shown by pulse-chase studies, chronic in vivo imaging of microglia, and the use of mouse models of dysregulated apoptosis. Our results reveal that the microglial population is constantly and rapidly remodeled, expanding our understanding of its role in the maintenance of brain homeostasis.

Keywords: BrdU; CSF1R; CX3CR1; Macgreen; RNA-seq; Vav-Bcl2; self-renewal.


Figures

None
Graphical abstract
Figure 1
Figure 1
A Wave of Infiltrating Monocytes Invades the Brain at Early Postnatal Stages to Be Rapidly Depleted and Not Contributing to the Adult Microglial Population (A) Experimental design, illustrating the tracing of late embryonic hematopoiesis by the intra-utero marking of liver progenitors with VSVG-SFFV lentiviral vectors (E14) and subsequent analysis of brain infiltration (P0–P43). (B and C) Representative examples of Venus+ (green) infiltrating cells at P3 (cerebellum), with migratory (bipolar, elongated) (B) or ramified (multiple radially orientated processes) (B, right) morphologies (C). Iba1 expression is shown in red in differentiated ramified cells. (D and E) Time-course analysis of the number of resident microglia (Iba1+Venus) and infiltrating monocytes (Venus+) in the postnatal cerebellum (CB), cortex (CX), and hippocampus (HC). At all ages tested, Venus+ cells (E) represent only a minority of all Iba1+ cells (D). (F–H) Phenotypic characterization of Venus+ cells at P3 by confocal microscopy (G and H). Venus+ cells (arrowheads) are CD206low (red, F) and GFAP, Olig2, and NG2 (red, H). (I) Representative example of the absence of cell proliferation (BrdU+; red) in Venus cells in the mouse postnatal hippocampus (P3). (J) Quantification of the apoptosis of Venus+ cells in the brain (cortex, hippocampus, and cerebellum) at P3, analyzed as expression of cleaved caspase-3 or condensation of chromatin (DAPI). A representative example of the expression of cleaved caspase-3 (red) in Venus+ cells (green) is shown. (K) Expression of cleaved caspase-3 in NeuN+ neurons at P3. Venus+ cells are shown in green. Scale bars are 20 μm in (B), (C), (G), (H), and (K) and 100 μm in (I) and (J). Data shown in (D), (E), (F), and (J) are represented as mean ± SEM (n = 6). Statistical differences: (D) CB p < 0.05 versus P6, CX p < 0.05 versus P21, HC p < 0.05 versus P6. (E) p < 0.05 versus P0, #p < 0.05 versus P3, ##p < 0.01 versus P3. (F) ∗∗p < 0.01. Data were analyzed with a two-way ANOVA and a post hoc Tukey test (D and E) or a t test (F).
Figure 2
Figure 2
The Density of Microglial Cells Remains Steady Through the Lifetime, without a Significant Contribution of Circulating Monocytes (A) Quantification of microglial density (Iba1+ cells) across brain regions (CX, cortex; CC, corpus callosum; CA1–2, hippocampal CA1–CA2; DG, dentate gyrus; TH, thalamus; OB, olfactory bulb) in young (4–6 months) and aged (18–24 months) mice. (B) Quantification of microglial density (Iba1+ cells) across brain regions (A) in young (4–6 months) and aged (18–24 months) wild-type (WT) or CCR2−/− mice. (C) Quantification of microglial density (Iba1+ cells) in the white and gray matter of the human temporal cortex in young or aged individuals. (D) Representative images of Iba1 staining in human temporal cortex. (E) Representative example of a multinucleated microglial aggregate (c-fms EGFP) in aging mice. (F) Representative examples of multinucleated microglial aggregates in aging WT mice, absent from CCR2−/− mice. Scale bars are 50 μm in (D) and (E) and 50 μm in (F). Data shown are represented as mean ± SEM. n = 7 (A and B), n = 15 (C). Statistical differences: p < 0.05. Data were analyzed with a two-way ANOVA and a post hoc Tukey test (A–C).
Figure 3
Figure 3
Proliferation of Microglia in the Adult Mouse and Human Brain (A) Analysis of the proliferation (proliferation rate, %) of microglia across brain regions (CX, cortex; CC, corpus callosum; CA1–2, hippocampal CA1–CA2; DG, dentate gyrus; TH, thalamus; OB, olfactory bulb) in young (4–6 months) and aged (18–24 months) mice. (B) Time-course analysis of microglial proliferation (proliferation rate, %) and death in the mouse cortex (CX) and dentate gyrus (DG). (C) Representative example of a proliferating microglial cell (Iba1+, brown), incorporating BrdU (blue). (D and E) Analysis of the proliferation (proliferation rate, %) of microglia in the human white or gray matter of the temporal cortex, analyzed as expression of Ki67 (blue) in Iba1+ cells (brown), as shown in the representative example (E). (H–J) Analysis of microglial proliferation by tracing c-fms EGFP mice with Eco-SFFV mCherry γ-retroviral vectors (Eco-SFFV-RV mCherry). (H) Experimental scheme. (I) Representative image of the tracing of proliferating microglia by Eco-SFFV-RV (mCherry, red) in the cortex of c-fms EGFP mice (green). (J) Analysis of the proliferation (proliferation rate, % mCherry+EGFP+/total EGFP+) of microglia (CX, cortex; ST, striatum) in c-fms EGFP mice.(K–N) Analysis of microglial proliferation by two-photon imaging of CX3CR1GFP/+ mice. (K) Maximal intensity projection (MIP) images of the same field of view (142–153 μm depth, 1 μm step) in a CX3CR1GFP/+ mouse taken at different time points as indicated (see timestamps, relative time). Arrows point to a proliferating microglial cell and its progeny. (L) Proliferation rate of microglia (median ± interquartile range [IQR]; n = 669 cells, 9 fields of view [FOVs], and 4 mice). (M) Mean distance between the centers of two neighboring cells for resident cells and for newborn cells during the first 24 hr of their life (mean ± SEM; n = 62 cells, 9 FOVs, and 4 mice). (N) Distance between the twin microglial cells as a function of their age (median ± IQR; n = 31 pairs of twin cells, 8 FOVs, and 4 mice). Scale bars are 20 μm in (A) and (C), 50 μm in (E), and 100 μm in (G). Data shown are represented as mean ± SEM. n = 8 (A and B), n = 15 (D), n = 6 (F), n = 5 (J). Statistical differences: (A–J) p < 0.05; (M) p < 0.001, Student’s t test. Data were analyzed with a two-way ANOVA and a post hoc Tukey test (A and B) or a Student’s t test (F and J).
Figure 4
Figure 4
The Homeostatic Turnover of Microglia Is Not Maintained by Nestin+ Precursors (A–C) Immunofluorescent detection and confocal analysis of Iba1+ microglia (red) in nestin-EGFP (green) mice in the cortex (A and C) or hippocampal dentate gyrus (B). (D) Triple immunofluorescence for BrdU (blue), Iba1+ (microglia, red), and nestin-EGFP (green) in the dentate gyrus. An open arrowhead indicates a BrdU+Iba1Nestin+ cell, while a white arrowhead indicates a BrdU+Iba1+Nestin cell. Scale bars are 50 μm in (A) and (B) and 20 μm in (C) and (D). n = 5.
Figure 5
Figure 5
The Turnover of Microglia Is Balanced by Apoptosis (A) Maximal intensity projection (MIP) images of the same field of view (88–106 μm depth, 2 μm step) in a CX3CR1GFP/+ mouse. Arrows point to a disappearing (i.e., dying) microglial cell. (B) Death rate of microglia (median ± IQR; n = 669 cells, 9 FOVs, and 4 mice). (C) Microglial density across regions (CX, cortex; CC, corpus callosum; CA1–2, hippocampal CA1–CA2; DG, dentate gyrus; TH, thalamus) in wild-type (WT), PUMA−/−, BIM−/−, and Vav-Bcl2 mice. (D) Expression of Vav (red) in microglia (c-fms EGFP, green), analyzed by confocal microscopy. (E) Time-course analysis of postnatal (P0–P231) microglial density in wild-type (WT) and Vav-Bcl2 mice. (F) Representative example of microglial cells (Iba1+) in the cortex of WT and Vav-Bcl2 mice. Scale bars are 20 μm in (A) and (D) and 100 μm in (F). Data shown in (C) and (E) are represented as mean ± SEM. n = 4 WT mice, 3 PUMA−/− mice, 4 BIM−/− mice, and 7 Vav-Bcl2 mice (C); n = 4 (E). Statistical differences: p < 0.05, ∗∗p < 0.01, ∗∗∗p < 0.001. Data were analyzed with a two-way ANOVA and a post hoc Tukey test (C and E).
Figure 6
Figure 6
Transcriptomic Profiling of Microglia from WT and Vav-Bcl2 Mice (A) Flow cytometry analysis and sorting of microglia from WT and Vav-Bcl2 mice. Crosshair in flow cytometry analysis and sorting plots shows gating parameters used to define CD11b+CD45low and CD11b+CD45high subpopulations and subsequent sorting. Statistical differences: ∗∗∗∗p < 0.0001. Data were analyzed with a t test (A). (B) Heatmap representation of genes showing a significant (p < 0.01; >10-fold change) change in Vav-Bcl2 versus WT microglia (combined CD45+). Clustering of genes by expression profile is shown on the left. (C) Clustered representation (GO Slim) of GO processes significantly altered in Vav-Bcl2 compared to WT microglia. Number of genes altered per cluster is shown on top of the bars. (D) Enrichment map of GO terms, where red nodes represent GO terms and green edges represent shared genes (thicker lines indicate more shared genes). (E) Venn diagram representing the intersection of the transcriptional variability observed when comparing total (blue), CD45low (green), or CD45high (yellow) Vav-Bcl2 to WT microglia.
Figure 7
Figure 7
Temporal and Spatial Coupling of Microglial Proliferation and Death (A) MIP images of a sample field of view (50–80 μm depth, 1 μm step) in a CX3CR1GFP/+ mouse taken at the beginning (left, day 0) and at the end (right, day 22) of the imaging period. Bone growth occurred in the lower right corner of the latter image. (B) 3D matrix illustrating the history of cells in the sample field of view (317 × 317 × 160 μm) during the 22-day-long imaging period. Stable cells are shown in gray, cells that are going to die are shown in red, and cells that are going to divide are shown in blue. This FOV includes the cells shown in (A). (C) Temporal relationship between death and proliferation events (n = 68 cells, 9 FOVs, and 4 mice). The time when a cell dies is set as day 0 (reference point), and the relative time when proliferation occurs in its vicinity (≤200 μm) is calculated. The pie chart illustrates the fractions of cells proliferating in the vicinity of a dying cell 4 days before (light gray), during (gray), or 4 days after (dark gray) the death of the reference cell. (D) Spatial relationship between a dead cell and the nearest proliferating or resident cell (n = 53 dead cells, 9 FOVs, and 4 mice). (E) Summary of the data shown in (D) (median ± IQR; n = 53 cells, 9 FOVs, and 4 mice). Statistical differences: p < 0.001, Wilcoxon signed-ranks test. Scale bar in (A) is 50 μm.

References

    1. Alliot F., Godin I., Pessac B. Microglia derive from progenitors, originating from the yolk sac, and which proliferate in the brain. Brain Res. Dev. Brain Res. 1999;117:145–152. - PubMed
    1. Bilbo S.D., Schwarz J.M. Early-life programming of later-life brain and behavior: a critical role for the immune system. Front. Behav. Neurosci. 2009;3:14. - PMC - PubMed
    1. Bruttger J., Karram K., Wörtge S., Regen T., Marini F., Hoppmann N., Klein M., Blank T., Yona S., Wolf Y. Genetic cell ablation reveals clusters of local self-renewing microglia in the mammalian central nervous system. Immunity. 2015;43:92–106. - PubMed
    1. Cameron I.L., Greulich R.C. Evidence for an essentially constant duration of DNA synthesis in renewing epithelia of the adult mouse. J. Cell Biol. 1963;18:31–40. - PMC - PubMed
    1. Cunningham C.L., Martínez-Cerdeño V., Noctor S.C. Microglia regulate the number of neural precursor cells in the developing cerebral cortex. J. Neurosci. 2013;33:4216–4233. - PMC - PubMed

Publication types

Substances