. 2017 Jan 10;18(2):482-495.
doi: 10.1016/j.celrep.2016.12.054.

MLL-AF4 Spreading Identifies Binding Sites that Are Distinct from Super-Enhancers and that Govern Sensitivity to DOT1L Inhibition in Leukemia

Affiliations

MLL-AF4 Spreading Identifies Binding Sites that Are Distinct from Super-Enhancers and that Govern Sensitivity to DOT1L Inhibition in Leukemia

Jon Kerry et al. Cell Rep. .

Abstract

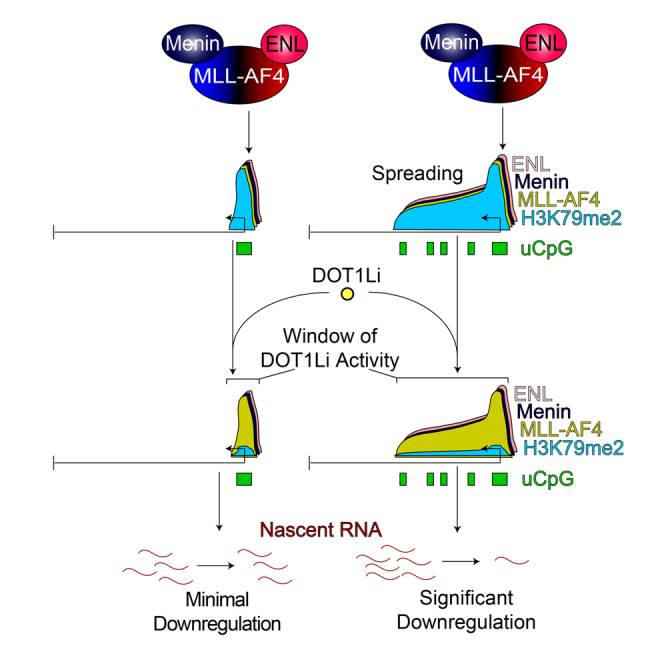
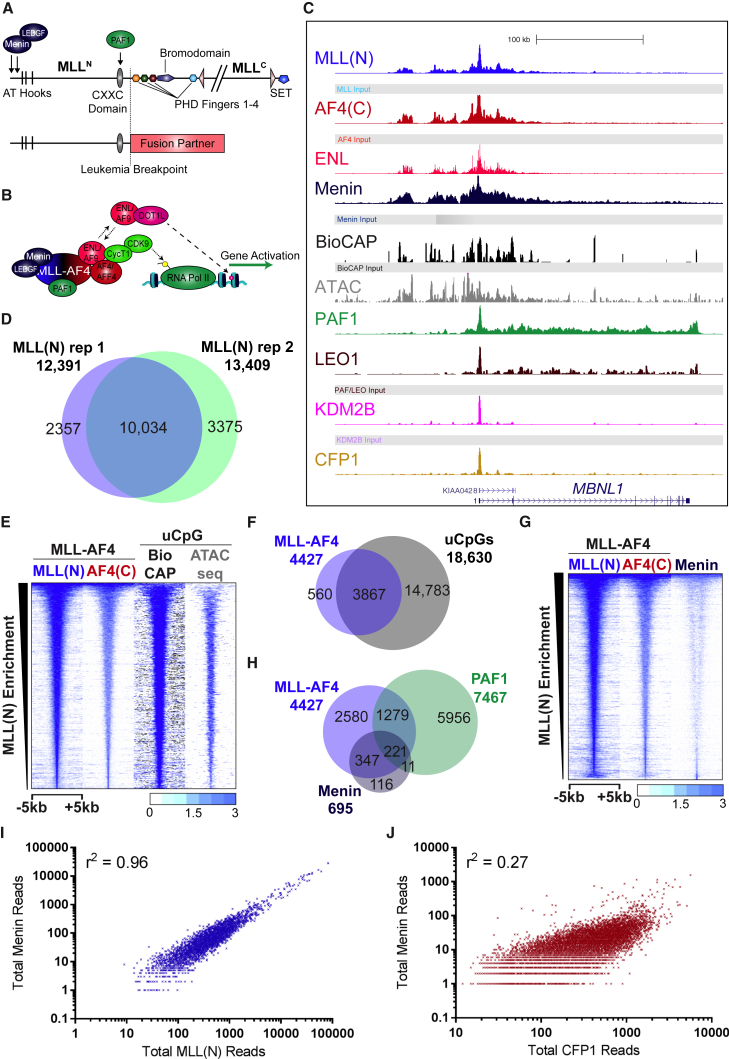
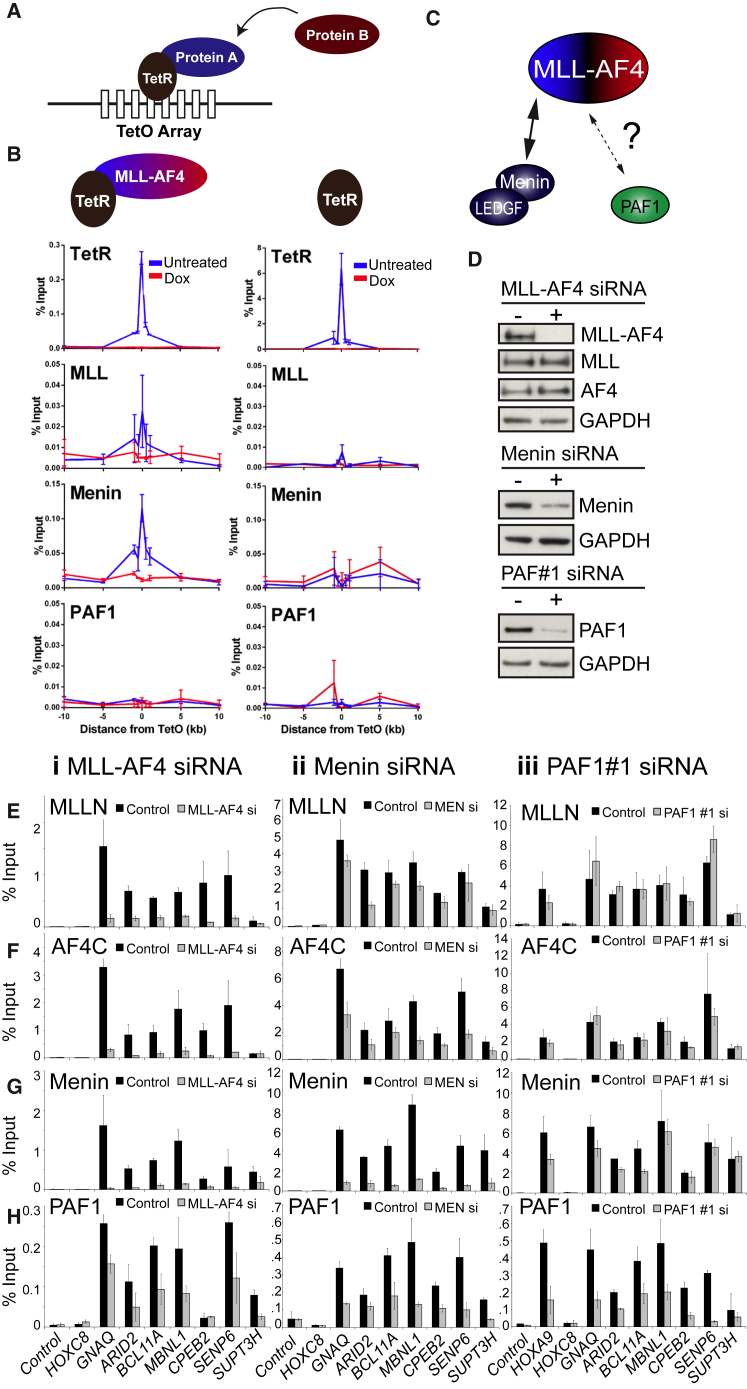
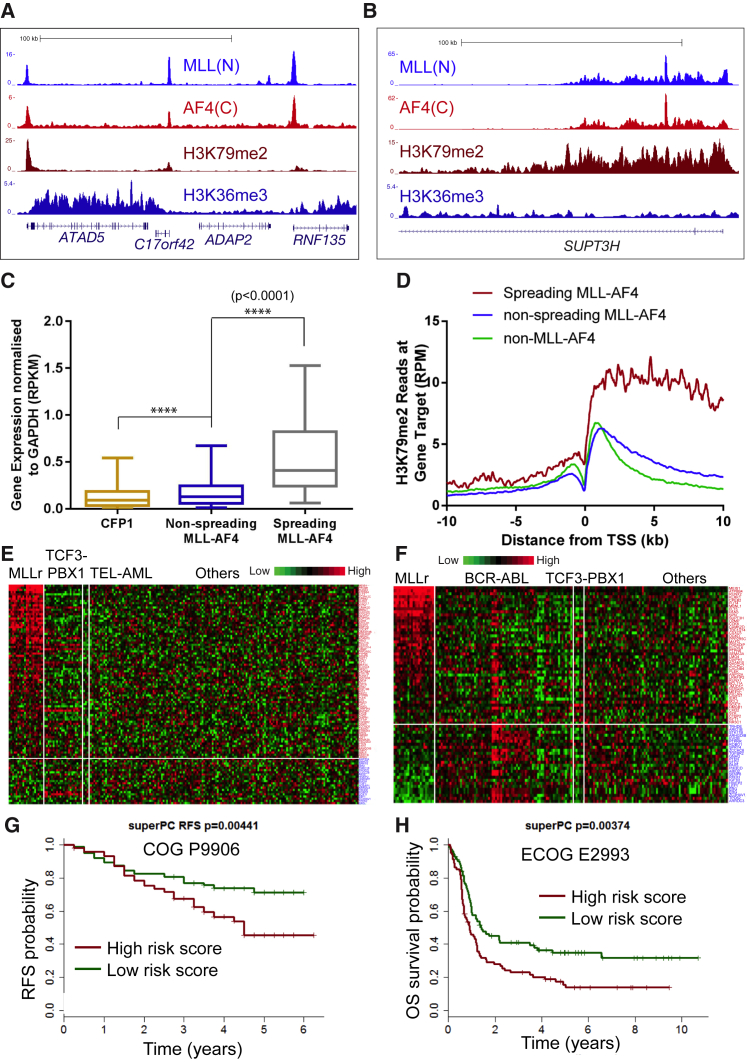
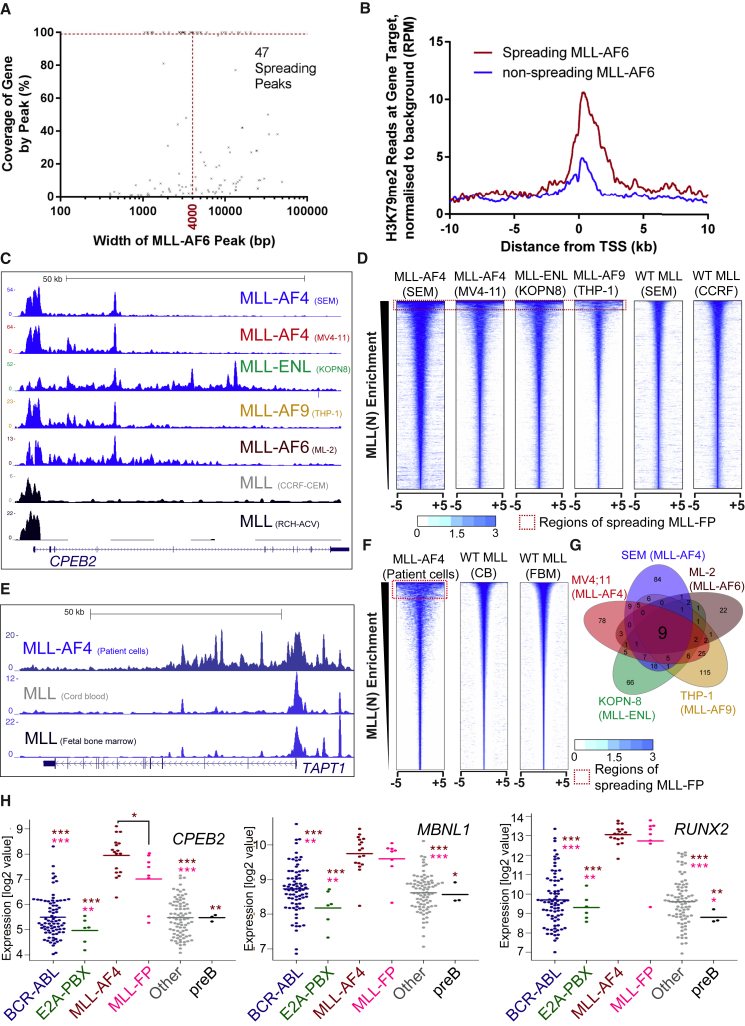
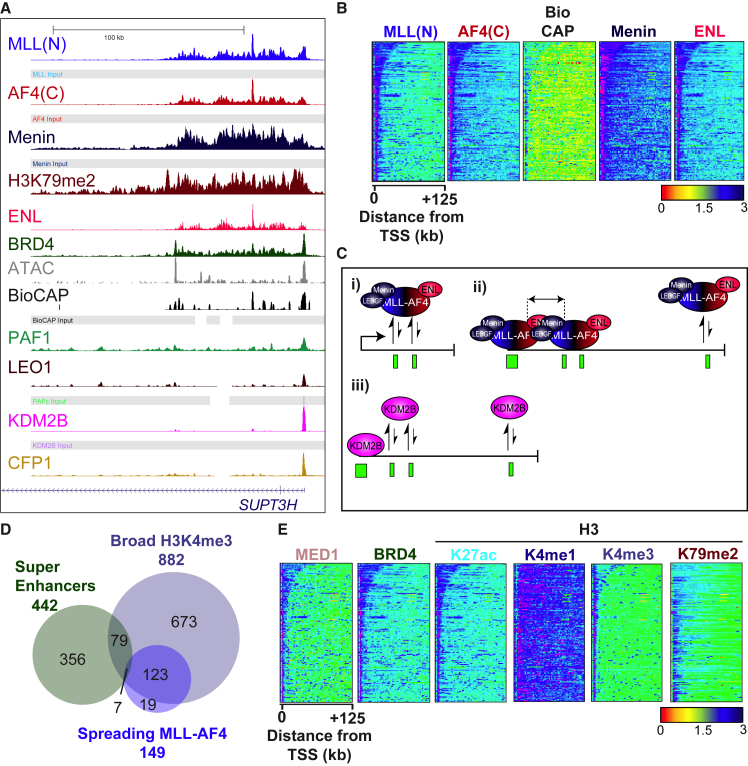
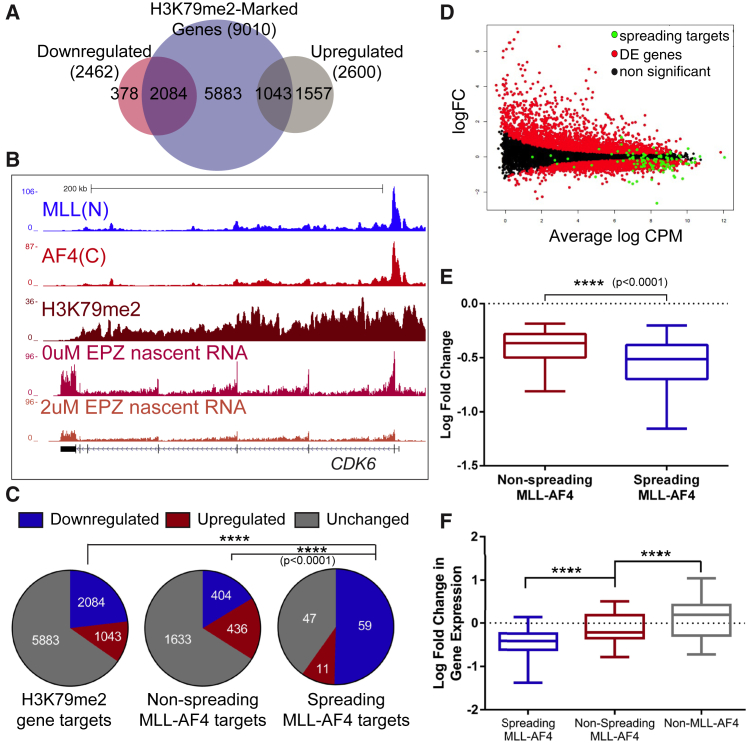
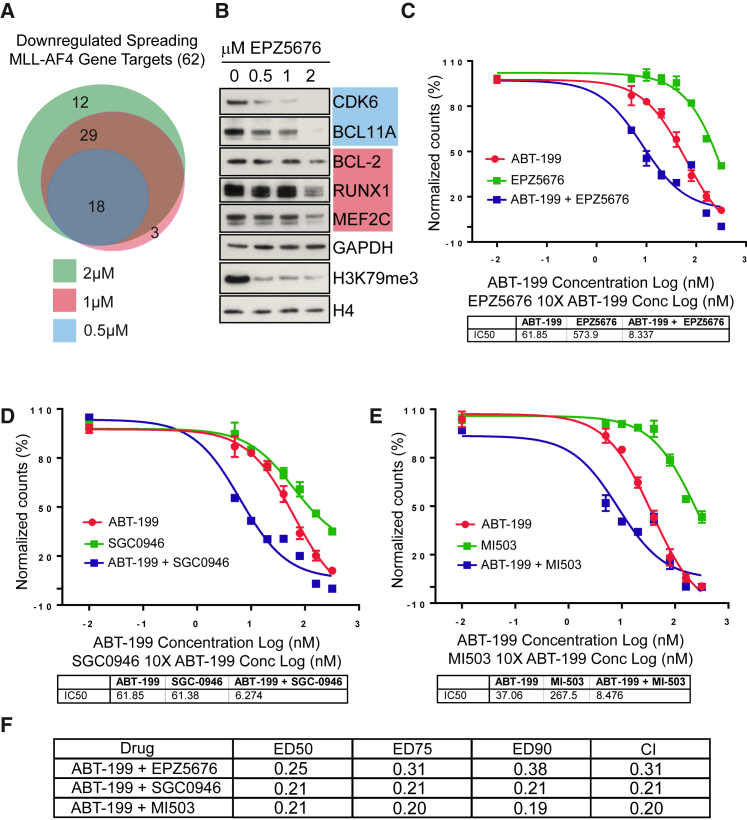
Understanding the underlying molecular mechanisms of defined cancers is crucial for effective personalized therapies. Translocations of the mixed-lineage leukemia (MLL) gene produce fusion proteins such as MLL-AF4 that disrupt epigenetic pathways and cause poor-prognosis leukemias. Here, we find that at a subset of gene targets, MLL-AF4 binding spreads into the gene body and is associated with the spreading of Menin binding, increased transcription, increased H3K79 methylation (H3K79me2/3), a disruption of normal H3K36me3 patterns, and unmethylated CpG regions in the gene body. Compared to other H3K79me2/3 marked genes, MLL-AF4 spreading gene expression is downregulated by inhibitors of the H3K79 methyltransferase DOT1L. This sensitivity mediates synergistic interactions with additional targeted drug treatments. Therefore, epigenetic spreading and enhanced susceptibility to epidrugs provides a potential marker for better understanding combination therapies in humans.

Keywords: DOT1L; H3K79me2; MLL; MLL-AF4; drug combination therapy; epigenetic spreading; epigenetic therapy; leukemia.


Figures

None
Graphical abstract
Figure 1
Figure 1
MLL-AF4 Is Recruited Exclusively to uCpG Regions Bound by Menin (A) Schematic showing MLL and MLL fusion protein interaction sites. (B) Schematic showing the MLL-AF4 core complex. (C) Example ChIP-seq, Bio-CAP-seq, and ATAC-seq tracks in SEM cells. (D) Venn diagram showing overlap between two biological replicates of MLL(N) ChIP-seq. (E) Heatmap showing ChIP-seq, Bio-CAP-seq, and ATAC-seq reads at all 4,427 MLL-AF4 binding sites in SEM cells. Scale bar represents tags per base pair (bp) per 107 reads. (F) Venn diagram showing overlap between MLL-AF4 binding sites and uCpG regions (Bio-CAP-seq and ATAC-seq) in SEM cells. (G) Heatmap showing MLL(N), AF4(C), and Menin ChIP-seq reads at all MLL-AF4 binding sites in SEM cells. Scale bar as in (E). (H) Venn diagram showing overlap between MLL-AF4, PAF1, and Menin binding sites in SEM cells. (I and J) Scatterplot showing a strong correlation (r2 = 0.96) between MLL(N) and Menin ChIP-seq signal at all MLL-AF4 peaks (I) in SEM cells and a weak correlation between Menin and CFP1 (r2 = 0.27) at all CFP1 peaks (J) in SEM cells. See also Figure S1.
Figure 2
Figure 2
The MLL-AF4:Menin Interaction Is Sufficient but Not Necessary for Recruitment (A) The Tet-repressor (TetR) recruitment system. An array of Tet-operator (TetO) sequences was centrally inserted into a BAC lacking known promoter, enhancer, or uCpG features, and the BAC was inserted into chromosome 8 of mouse embryonic stem cells (mESCs) (Blackledge et al., 2014). Proteins of interest fused to the TetR can be anchored at the TetO array. The TetR-TetO interaction can be disrupted with doxycycline treatment, allowing one to test whether recruitment of a specific protein is dependent on the continuous presence of a particular TetR fusion. (B) ChIP-qPCR showing the binding of TetR-MLL-AF4 (using FS2 [TetR] and MLL(N) antibody), Menin, and PAF1 in TetO mESCs transfected with TetR-MLL-AF4 (left panel) and in TetR-only control mESCs (right panel). Error bars represent the SD of two biological replicates. Red line, with doxycycline. (C) The TetR experiments indicate that there is a strong interaction between MLL-AF4 and Menin and an undetectable interaction between MLL-AF4 and PAF1. (D) SEM cells were treated with MLL-AF4, Menin, or PAF1 siRNAs, and individual representative western blots from the experiments in E–H are shown. (E–H) MLL-N (E), AF4-C (F), Menin (G), and PAF1 (H) ChIP in control (black bars) and siRNA-treated (gray bars) SEM cells as follows: column i, MLL-AF4 siRNA; column ii, Menin siRNA; and column iii, PAF1 siRNA. Note that the control samples are the same between PAF1#1 siRNA and PAF1#2 siRNA (see Figure S2H) experiments as these were performed in parallel. Error bars represent the SD of at least three biological replicates. See also Figure S2.
Figure 3
Figure 3
MLL-AF4 Spreading Marks a Subset of Highly Expressed Genes (A and B) Example ChIP-seq tracks showing promoter-restricted (A) or spreading (B) of MLL-AF4, H3K79me2, and H3K36me3 in SEM cells. (C) Box-and-whisker plot showing the median and interquartile (IQ) range of gene expression of spreading MLL-AF4 gene targets (n = 149) compared to non-spreading MLL-AF4 targets (n = 2,878) and CFP1 targets (n = 6,147). Gene expression, normalized to GAPDH expression, is derived from four biological replicates of nascent RNA-seq in SEM cells. ∗∗∗∗p < 0.0001, two-tailed Mann-Whitney U test. (D) Composite binding plot of H3K79me2 ChIP-seq reads at the TSS of gene targets of spreading MLL-AF4 (red), non-spreading MLL-AF4 (blue), and non-MLL-AF4 targets that are marked by H3K79me2 (green). (E and F) Heatmap expression data showing overexpression of 79% (E, COG P9906 patients [Harvey et al., 2010]) or 64% (F, ECOG 2993 patients [Geng et al., 2012]) of SEM spreading targets in MLL patients (MLLr) compared to the ALL patient subsets indicated. (G and H) Super-PC analysis (Bair and Tibshirani, 2004) using the spreading-gene target list showing relapse-free survival (RFS) of ALL patients (G, COG P9906 [Harvey et al., 2010]) and overall survival (OS) of ALL patients (H, ECOG 2993 [Geng et al., 2012]) classified by either high- or low-risk scores computed using the spreading MLL-AF4 gene targets in a super-PC model; see Supplemental Experimental Procedures, Survival Analysis, for details. See also Figure S3.
Figure 4
Figure 4
MLL-FP Spreading Occurs in Multiple in MLL Leukemias (A) Spreading MLL-AF6 peaks were defined as peaks that extend greater than 4 kb from the TSS into the gene body without going beyond the end of the gene. Using these criteria, 47 spreading MLL-AF6 peaks were identified in ML-2 cells (Table S2). (B) Composite binding plot of H3K79me2 ChIP-seq reads at the TSS of gene targets of spreading MLL-AF6 (red) and non-spreading MLL-AF6 (blue) in ML-2 cells. (C) Example ChIP-seq tracks of MLL(N) in MLL-FP and germline MLL cell lines. (D) Heatmaps of MLL(N) ChIP-seq reads from different MLL-FP cell lines as well as wild-type MLL in SEM cells and in non-MLLr cell lines. Red dotted line indicates spreading across a 10-kb window. Scale bar represents tags per base pair per 107 reads. (E) Example ChIP-seq tracks of MLL(N) showing spreading in MLL-AF4 patient cells (top) compared to wild-type MLL in mononuclear cells derived from cord blood (middle) and fetal bone marrow (bottom). (F) Heatmaps showing MLL(N) ChIP-seq reads from the experiments in (E); scale and red line as in (D). (G) Venn diagram showing the overlap between gene targets of spreading MLL(N) ChIP-seq several MLLr cell lines. (H) CPEB2, MBNL1, and RUNX2 are overexpressed in MLL-AF4 and other MLL-FP patients compared to different patient samples and normal pre-B cells. Each dot indicates an individual patient sample. Data are taken from an ECOG E2993 clinical trial (Geng et al., 2012). Dark red asterisk () indicates a significant difference compared to MLL-AF4, and pink asterisk () indicates a significant difference compared to the MLL-FP group (which includes MLL-ENL [6], MLL-AF9 [1], and MLL-EPS15 [1]). ∗∗∗p < 0.001, ∗∗p < 0.01, p < 0.05. A two-tailed Wilcoxon test was used to calculate p values, and p values for the different comparisons are listed in Table S5. See also Figures S4 and S5.
Figure 5
Figure 5
Spreading Correlates with Members of the Menin:LEDGF and Super-Elongation Complexes (A) Example ChIP-seq tracks at SUPT3H in SEM cells. (B) Heatmap of MLL-AF4, Bio-Cap, Menin, and ENL signal at all 149 spreading MLL-AF4 targets, ordered by length of spreading peak. Scale bar represents tags per bp per 107 reads. (C) Schematic showing a proposed model for spreading across uCpG regions by MLL-FPs. (i) In the absence of promoter-bound MLL-AF4, CXXC-mediated recruitment of the fusion protein to uCpG-poor regions in the gene body are not stabilized. (ii) Stable CXXC-mediated recruitment to uCpG-rich promoter regions can stabilize nearby MLL-AF4 recruitment at gene body uCpG regions due to common interactions with complex members such as Menin and ENL, whereas distal recruitment events remain unstable. (iii) Because other CXXC proteins, such as KDM2B, do not interact with complex member such as Menin or ENL, promoter-bound KDM2B is not sufficient to stabilize neighboring CXXC-mediated recruitment to CpG-poor uCpG regions in the gene body. (D) Venn diagram showing the overlap between gene targets of super-enhancers, broad H3K4me3 peaks, and spreading MLL-AF4, in SEM cells. (E) Heatmap showing ChIP-seq reads of the components indicated at all 149 spreading MLL-AF4 gene targets in SEM cells; scale bar as in (B). See also Figure S6.
Figure 6
Figure 6
Spreading MLL-AF4 Targets Show Increased Sensitivity to DOT1L Inhibition (A) Venn diagram showing an overlap between H3K79me2-marked genes and upregulated and downregulated genes in SEM cells following treatment with 2 μM EPZ-5676. (B) Example ChIP-seq tracks at CDK6 and nascent RNA-seq in control (0 μM) and 2 μM EPZ-5676-treated SEM cells. (C) Pie charts showing the proportion of genes that are significantly downregulated (blue), upregulated (red), or remain unchanged (gray), among H3K79me2-marked genes (left), non-spreading MLL-AF4 gene targets (center), and spreading MLL-AF4 gene targets (right), following treatment of SEM cells with 2 μM EPZ-5676. ∗∗∗∗p < 0.0001, Fisher’s exact test. (D) Smear plot showing the fold change in gene expression of all genes in SEM cells following treatment with 2 μM EPZ-5676 compared to their expression level (CPM). Black, non-significant change in gene expression; red, differentially expressed gene; green, spreading MLL-AF4 gene targets. (E) Box-and-whisker plot showing the median and IQ range of fold change in expression of all significantly downregulated gene targets of non-spreading MLL-AF4 (red) compared to spreading MLL-AF4 (blue), after 2 μM EPZ-5676 treatment in SEM cells. ∗∗∗∗p < 0.0001, Mann-Whitney U test. (F) Box-and-whisker plot showing the median and IQ range of fold change in expression of all significantly affected spreading MLL-AF4 (blue), non-spreading MLL-AF4 (red), and non-MLL-AF4 gene targets following siRNA-mediated knockdown of MLL-AF4 in SEM cells. ∗∗∗∗p < 0.0001, Mann-Whitney U test. See also Figure S7.
Figure 7
Figure 7
Sensitivity of Spreading Gene Targets Provides a Rationale for Combined Therapy Using DOT1L Inhibitors (A) Venn diagram showing the overlap of spreading MLL-AF4 gene targets that are downregulated as measured by nascent RNA-seq following 0.5 μM (blue), 1 μM (red), and 2 μM (green) EPZ-5676 treatment. (B) Western blot showing the protein expression of several spreading MLL-AF4 targets and controls in the presence of control, 0.5, 1, or 2 μM EPZ-5676 treatments. Blue and red boxes relate to treatment colors in (A) that led to the lowest level of treatment that resulted in reduced gene transcription. (C–E) A cell viability assay of SEMK2 cells treated with a DMSO control, different concentrations of ABT-199 (320, 160, 80, 40, 20, 10, and 5 nM, and DMSO control) alone, or in combination with a 1:10 ratio of either EPZ5676 (C), SGC0946 (D), or MI503 (E) (3,200, 1,600, 800, 400, 200, 100, and 50 nM, and DMSO control). (F) A tabular summary of the combination index for the different drug treatments calculated as in Milella et al. (2002).

References

    1. Bair E., Tibshirani R. Semi-supervised methods to predict patient survival from gene expression data. PLoS Biol. 2004;2:E108. - PMC - PubMed
    1. Ballabio E., Milne T.A. Molecular and epigenetic mechanisms of MLL in human leukemogenesis. Cancers (Basel) 2012;4:904–944. - PMC - PubMed
    1. Benayoun B.A., Pollina E.A., Ucar D., Mahmoudi S., Karra K., Wong E.D., Devarajan K., Daugherty A.C., Kundaje A.B., Mancini E. H3K4me3 breadth is linked to cell identity and transcriptional consistency. Cell. 2014;158:673–688. - PMC - PubMed
    1. Benito J.M., Godfrey L., Kojima K., Hogdal L., Wunderlich M., Geng H., Marzo I., Harutyunyan K.G., Golfman L., North P. MLL-rearranged acute lymphoblastic leukemias activate BCL-2 through H3K79 methylation and are sensitive to the BCL-2-specific antagonist ABT-199. Cell Rep. 2015;13:2715–2727. - PMC - PubMed
    1. Bernt K.M., Zhu N., Sinha A.U., Vempati S., Faber J., Krivtsov A.V., Feng Z., Punt N., Daigle A., Bullinger L. MLL-rearranged leukemia is dependent on aberrant H3K79 methylation by DOT1L. Cancer Cell. 2011;20:66–78. - PMC - PubMed

MeSH terms