. 2017 Jan 10;18(2):557-570.
doi: 10.1016/j.celrep.2016.12.011.

Major Shifts in Glial Regional Identity Are a Transcriptional Hallmark of Human Brain Aging

Affiliations

Major Shifts in Glial Regional Identity Are a Transcriptional Hallmark of Human Brain Aging

Lilach Soreq et al. Cell Rep. .

Abstract

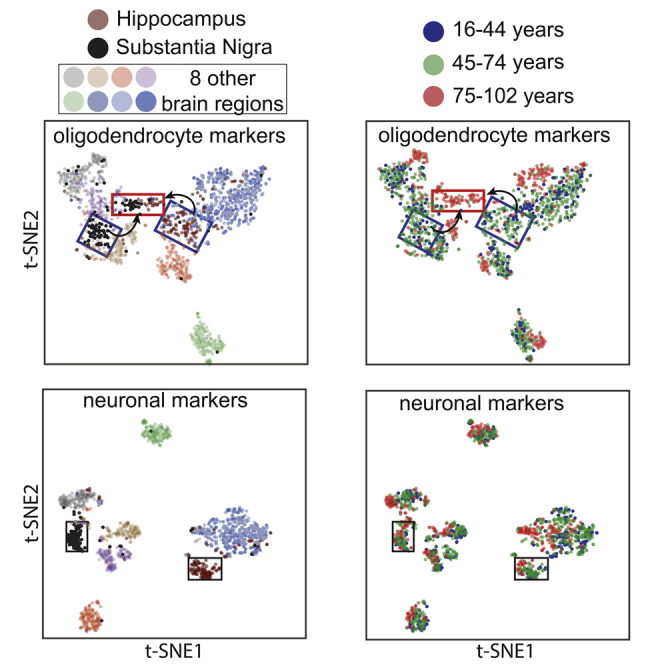
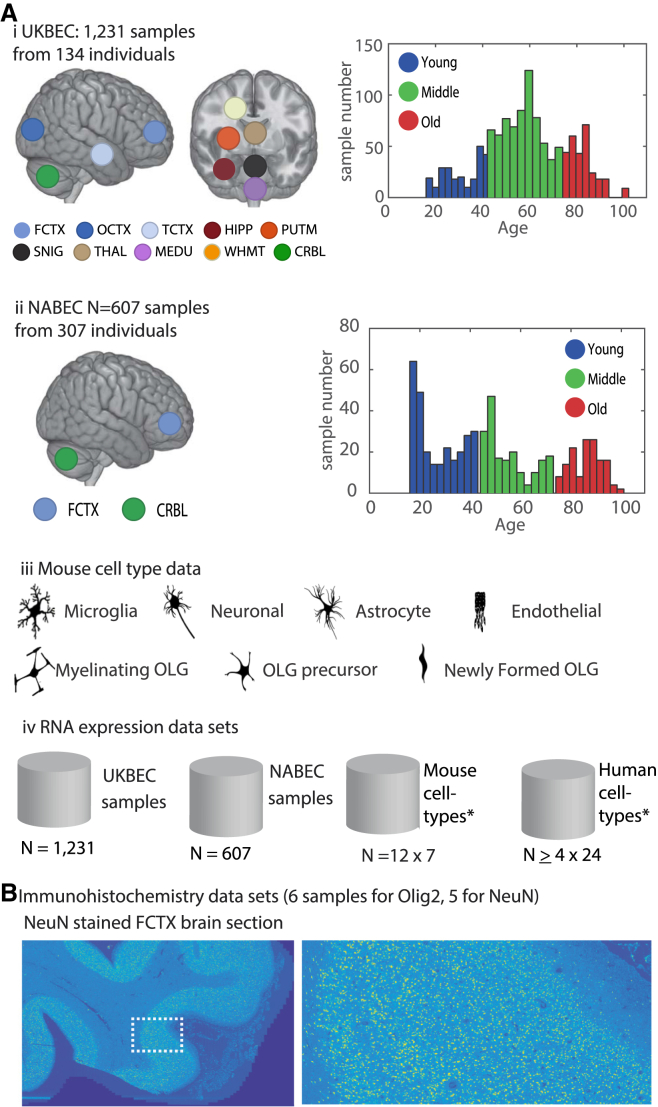
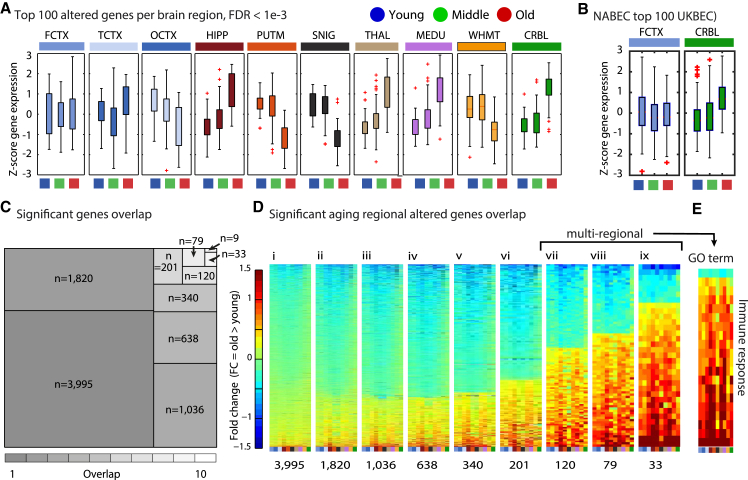
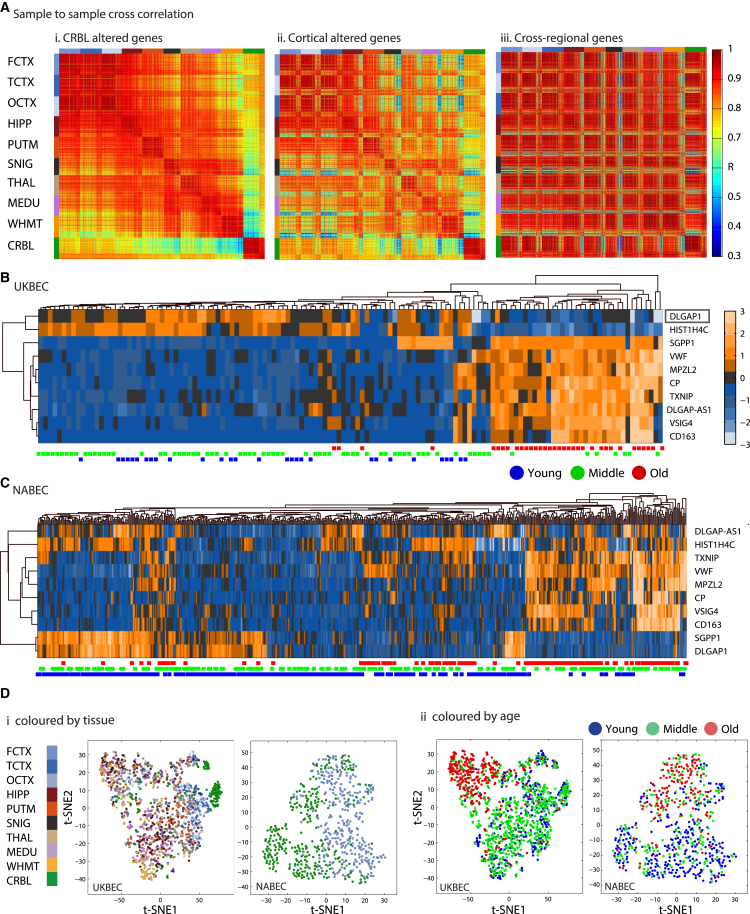
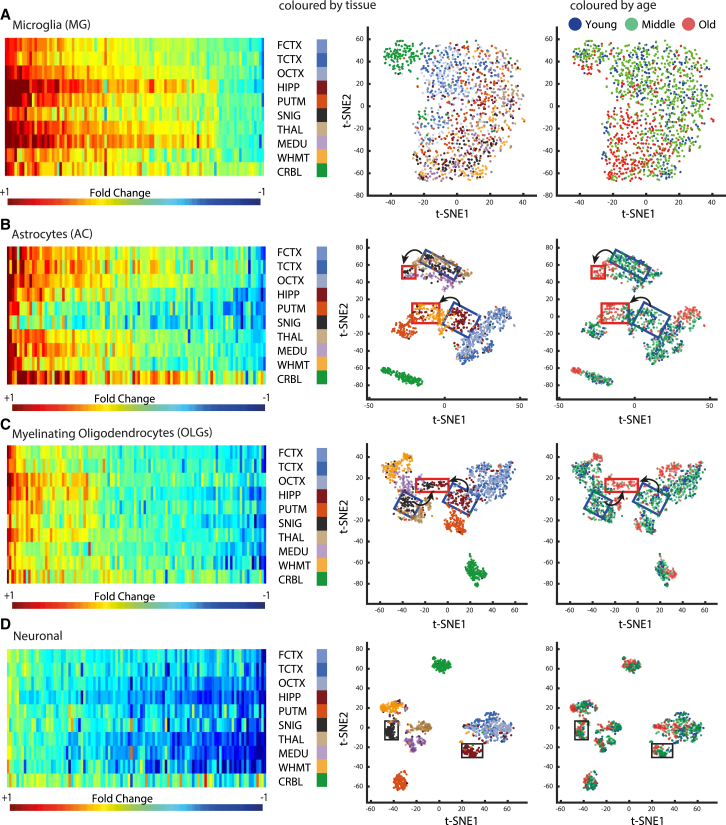
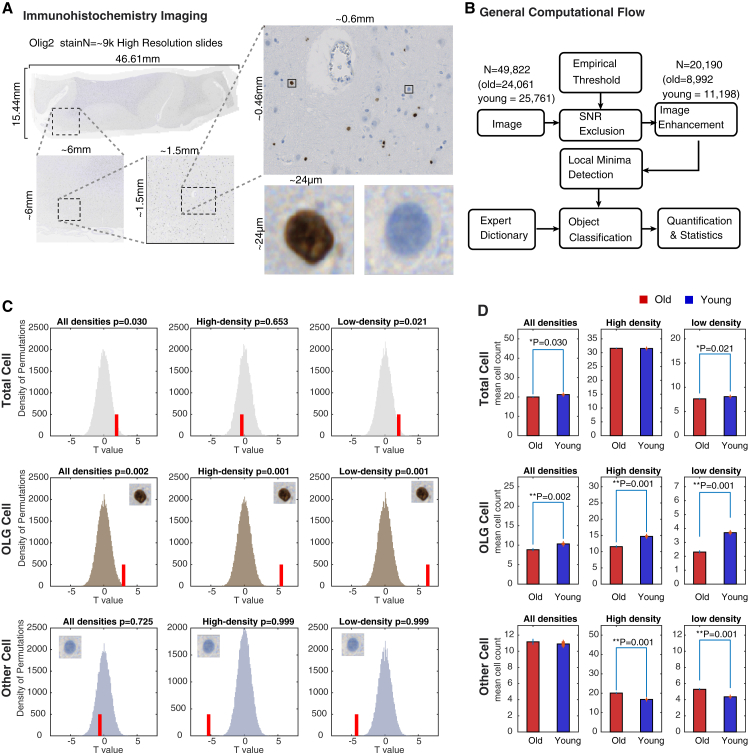
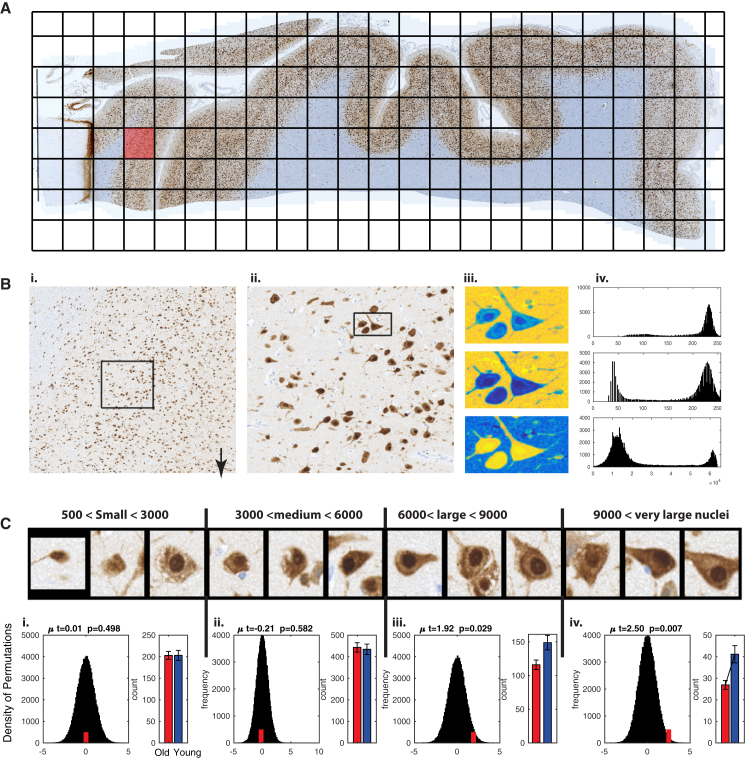
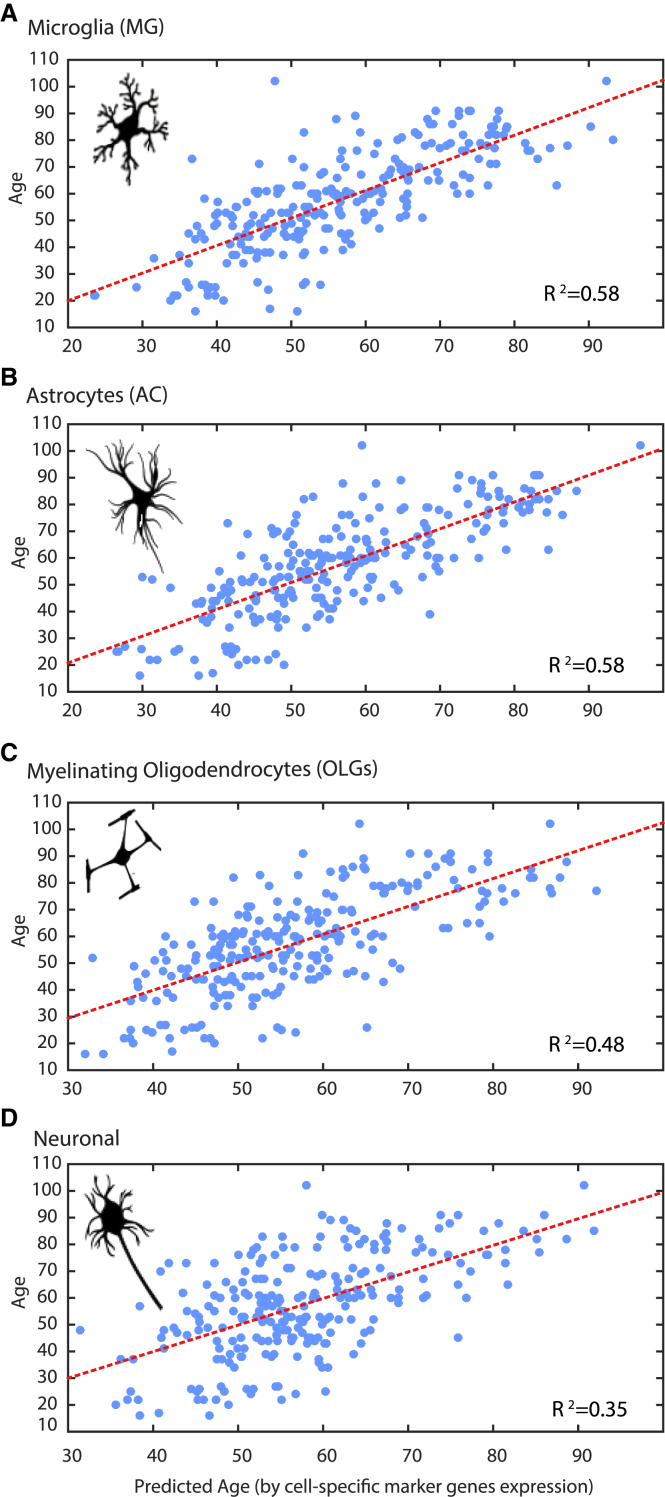
Gene expression studies suggest that aging of the human brain is determined by a complex interplay of molecular events, although both its region- and cell-type-specific consequences remain poorly understood. Here, we extensively characterized aging-altered gene expression changes across ten human brain regions from 480 individuals ranging in age from 16 to 106 years. We show that astrocyte- and oligodendrocyte-specific genes, but not neuron-specific genes, shift their regional expression patterns upon aging, particularly in the hippocampus and substantia nigra, while the expression of microglia- and endothelial-specific genes increase in all brain regions. In line with these changes, high-resolution immunohistochemistry demonstrated decreased numbers of oligodendrocytes and of neuronal subpopulations in the aging brain cortex. Finally, glial-specific genes predict age with greater precision than neuron-specific genes, thus highlighting the need for greater mechanistic understanding of neuron-glia interactions in aging and late-life diseases.

Keywords: RNA-seq; aging; brain; exon microarrays; gene expression; immunohistochemistry; machine learning; microglia; neurons; olgiodendrocytes.


Figures

None
Graphical abstract
Figure 1
Figure 1
Analyzed Samples and Datasets (A) The samples of the UKBEC and NABEC datasets were divided into three age groups each (young: 16–44, middle: 45–74, old: ≥75). (i) The main analyzed dataset (UKBEC) is composed of 1,231 brain samples interrogated by exon microarrays, from brain samples of 134 individuals from 16 to 102 years old and up to ten brain regions each. The brain regions included both cortical and sub-cortical regions, specifically: the frontal cortex (FCTX), temporal cortex (TCTX), occipital cortex (OCTX), intralobular white matter (WHMT), cerebellum (CRBL), substantia nigra (SNIG), putamen (PUTM), thalamus (THAL), hippocampus (HIPP), and medulla (MEDU) for UKBEC and the FCTX and CRBL for NABEC. (ii) The independent (NABEC) dataset of brain samples from FCTX and CRBL 307 individuals (16–101 years old). (iii) In addition, seven cell types were identified based on analysis of available RNA-seq data from mice cortex (http://web.stanford.edu/group/barres_lab/brain_rnaseq.html). (iv) A summary of all expression data used in this study. The total number of samples described in (i)–(iii) is listed, as well as the human RNA-seq analysis of 24 CNS human cell types (Table S7) (http://web.stanford.edu/group/barres_lab/brainseqMariko/brainseq2.html). (B) High-resolution immunohistochemical imaging dataset was produced from samples of young and three old FCTX from the UKBEC cohort, following staining by OLIG2 antibody and computational analysis for the quantification of the OLG cell population. Staining by NeuN of FCTX sections from the same brain samples followed by targeted computational analysis was conducted for quantification of the neuronal cell population (an example of one of the NeuN stained sections is shown on the right, in the zoomed-in view of the area marked on the left-hand side). OLG, oligodendrocyte.
Figure 2
Figure 2
Multi-regional Aging-Altered Genes Are Mainly Upregulated (A) The direction of expression change of the top 100 genes detected as significantly differentially expressed upon aging in each of the studied expression datasets from ten UKBEC brain regions (ANOVA test significance threshold: FDR < 1e−3; the test compared the three defined age groups). (B) Age-group based separation of 607 FCTX and CRBL samples (the NABEC cohort) was based on measured expression of the nine cross-regional genes. (C) A tree map of the number of genes that were altered upon aging, dependent on the number of brain regions where the change is observed. (D) Fold change of the genes that were altered upon aging, separated into heatmaps dependent on the number of brain regions where the change is observed. (E) Fold change of the multi-regional genes that were enriched in the Gene Ontology term immune response (standardized Z score; range is as shown for the heatmaps on the left). Brain region abbreviations are explained in the legend to Figure 1A. See also Figure S1A for the total number of aging-altered genes per region.
Figure 3
Figure 3
The Nine Cross-Regional Genes Discriminate Samples Based on Age (A) Correlation scores were calculated between each pair of brain samples among the UKBEC samples based on different lists of aging-altered genes using Spearman correlation. (i) Correlation scores based on CRBL aging-altered genes. (ii) Correlation scores based on cortical aging-altered genes. (iii) Correlation scores based on cross-regional aging-altered genes. See Figure S1B for correlation based on WHMT-altered genes. (B) Hierarchical classification of the UKBEC cohort based on the expression signals of the cross-regional altered genes and the DLGAP antisense. Rows, genes; columns, samples. Age group is denoted in blue (young: 16–44 years), green (middle-age: 45–74 years), or red (old: ≥75 years). The dendrograms show the Euclidian distance measured for both rows and columns. Right color bar, standardized fold change (Z score; range: −3 to 3; orange represents increased expression in aging, and blue denotes decrease). (C) Hierarchical classification of the NABEC expression dataset based on the profiles of the cross-regional genes and the DLGAP antisense. (D) Non-linear dimensionality reduction by t-distributed stochastic neighbor embedding (t-SNE) is based on the expression of the nine cross-regional genes, with the x axis showing t-SNE1 and the y axis showing t-SNE2. Either the ten UKBEC brain regions or the two NABEC brain regions (FCTX and CRBL) are classified, as marked in the plots. (i) Each sample is colored based on its corresponding tissue (colors are marked on the left). (ii) The same samples are colored based on their age group (colors are marked on the top). Brain region abbreviations are explained in the legend to Figure 1A.
Figure 4
Figure 4
Glia-Specific Genes Show Major Shifts in Regional Identity upon Aging On the left, heatmaps show the fold change between old and young groups in the expression of the top 100 aging-altered cell-type-specific genes across regions (the color bar corresponds to the standardized Z score, with blue corresponding to decrease and red to increase in gene expression; range: −1 to +1). On the right, non-linear dimensionality reduction by t-distributed stochastic neighbor embedding (t-SNE) is used to classify a sample of the ten UKBEC brain regions based on the expression of the top 20 aging-altered cell-specific genes, with the x axis showing t-SNE1 and the y axis showing t-SNE2. In the first plot, each sample is colored based on its corresponding tissue (colors are marked on the left of the plot), and in the second plot, the same samples are colored based on their age group (colors are marked on the top of the plots). (A) Sample classification based on the aging-altered MG-specific genes. (B) Sample classification based on the aging-altered AC-specific genes. (C) Sample classification based on aging-altered myelinating OLG-specific genes. (D) Sample classification based on the expression signals of aging-altered neuron-specific genes. The SNIG and PUTM samples are marked by rectangles as an example of the loss of region-specific expression upon aging for OLG- and AC-specific genes. Brain region abbreviations are explained in the legend to Figure 1A. MG, microglia; AC, astrocyte; OLG, oligodendrocyte. See Figure S2 for sample classification based on region-specific genes compared with multi-regional genes and Figure S6 for heatmaps and classification plots based on the three cell-type microarray gene markers.
Figure 5
Figure 5
Decreased Counts of Oligodendrocytes in the Frontal Cortex upon Aging Six FCTX brain sections were stained and imaged (from three old and three young post-mortem brain samples). Each sample contains thousands of equal-size slides each 1,600 × 1,200 pixels, as captured by a Zeiss AxioScan slide scanner following staining with the Olig2 antibody. (A) An example of a BA9-Olig2 slide shown in a full-resolution pyramid, with gradual zooming into two typical cells: one stained brown (OLG cells) and one stained blue (other cells). (B) General computational pipeline for the analysis of high-resolution immunohistochemical high-dimensional imaging data allowed us to quantify both OLG and other cells in each FCTX slide. (C) Comparison of OLG counts that asks if the number of cells of interest is different in young samples compared to old (i.e., red bar shifted to the right means increased count in young samples). In each panel, the histogram represents the null distribution of t values calculated using two-tailed Student’s t test over slide cell counts randomly sampled from the entire population of the six samples, using 100 random iterations over 500 permutations where the true-label t statistics is depicted with a red bar, and the remaining distribution was calculated based on shuffled labels. The analysis was done on overall 8,766 young and 10,922 old group slides (left). From a total of 2,612 young and 1,828 old group high-density slides, the 50 slides with the highest density were selected per case for quantification. Similarly, from 1,154 young and 1,277 old group low-density slides, the 50 slides with the lowest density were chosen per sample for quantification. (D) Cell counts in samples from old (red) and young (blue) groups, with significance calculated with t statistics as described in (C). The star marks bars with a p value < 0.05 and the mean T statistic, p value and SD of the permutation test are reported on top of the graphs.
Figure 6
Figure 6
Decreased Counts of Specific Neuronal Populations in the Frontal Cortex upon Aging (A) An image of one NeuN-stained FCTX section, with re-defined tiles demonstrated by black rectangles (file size = 37.4 GB). (B) (i) Enlargement of a single tile of 10,000 × 10,000 pixels (size = 225 MB). (ii) Enlargement of a 2,500 × 2,500 pixel section. (iii) Three cells as observed in the red channel (top, shown in light blue) and blue channel (middle), and intersection of the two channels (bottom) differentiates between neuronal cells (stained by NeuN in brown on the original slides) and other cells (stained by Heamotoxylin in blue in the middle plot). (iv) The x axis represents the color frequency distribution of the red and blue channels across an intensity range of 256 gray levels, while the y axis represents the frequency of pixel intensity in the image tile depicted in (iii). (C) Examples of detected neurons that contain small, medium, medium to large (E), or large cell body (F) with size given in pixels. Underneath each image is the histogram that asks if the number of cells of interest is different in young samples compared to old (i.e., red bar shifted to the right means increased count in young samples). The histogram shows the null distribution of t values, calculated using two-tailed Student’s t test over slide counts using 100,000 random permutations from the entire population of the six samples (black bars), while the mean of the true-label t statistics is depicted with a red bar. The right graph shows the cell counts in samples from old (red) and young (blue) groups, with significance calculated with t statistics based on 10,000 random permutations. The star marks bars with a p value < 0.05, and the mean t statistics, p value, and SD of the permutation test are reported on top of the graphs.
Figure 7
Figure 7
Glial-Specific Genes Are Most Capable of Predicting Biological Age (A–D) Analysis of the accuracy of cell-type-specific genes in predicting the biological age of UKBEC brain samples: (A) MG-specific genes (R2 = 0.58), (B) AC-specific genes (R2 = 0.58), (C) neuron-specific genes (R2 = 0.35), (D) OLG precursor-specific genes (R2 = 0.48). In all plots, the y axis denotes the actual age and the x axis denotes the predicted age. MG, microglia; AC, astrocytes; OLG, oligodendrocytes. See Figure S4C for age association plots of endothelial, OLG precursor, and newly formed OLG cell-specific genes.

References

    1. Baruch K., Deczkowska A., David E., Castellano J.M., Miller O., Kertser A., Berkutzki T., Barnett-Itzhaki Z., Bezalel D., Wyss-Coray T. Aging. Aging-induced type I interferon response at the choroid plexus negatively affects brain function. Science. 2014;346:89–93. - PMC - PubMed
    1. Bjornsson C.S., Lin G., Al-Kofahi Y., Narayanaswamy A., Smith K.L., Shain W., Roysam B. Associative image analysis: a method for automated quantification of 3D multi-parameter images of brain tissue. J. Neurosci. Methods. 2008;170:165–178. - PMC - PubMed
    1. Cahoy J.D., Emery B., Kaushal A., Foo L.C., Zamanian J.L., Christopherson K.S., Xing Y., Lubischer J.L., Krieg P.A., Krupenko S.A. A transcriptome database for astrocytes, neurons, and oligodendrocytes: a new resource for understanding brain development and function. J. Neurosci. 2008;28:264–278. - PMC - PubMed
    1. Cerbai F., Lana D., Nosi D., Petkova-Kirova P., Zecchi S., Brothers H.M., Wenk G.L., Giovannini M.G. The neuron-astrocyte-microglia triad in normal brain ageing and in a model of neuroinflammation in the rat hippocampus. PLoS ONE. 2012;7:e45250. - PMC - PubMed
    1. Cribbs D.H., Berchtold N.C., Perreau V., Coleman P.D., Rogers J., Tenner A.J., Cotman C.W. Extensive innate immune gene activation accompanies brain aging, increasing vulnerability to cognitive decline and neurodegeneration: a microarray study. J. Neuroinflammation. 2012;9:179. - PMC - PubMed

Publication types

MeSH terms