

DNA Occupancy of Polymerizing Transcription Factors: A Chemical Model of the ETS Family Factor Yan
- PMID: 28076810
- PMCID: PMC5232354
- DOI: 10.1016/j.bpj.2016.11.901
DNA Occupancy of Polymerizing Transcription Factors: A Chemical Model of the ETS Family Factor Yan
Abstract
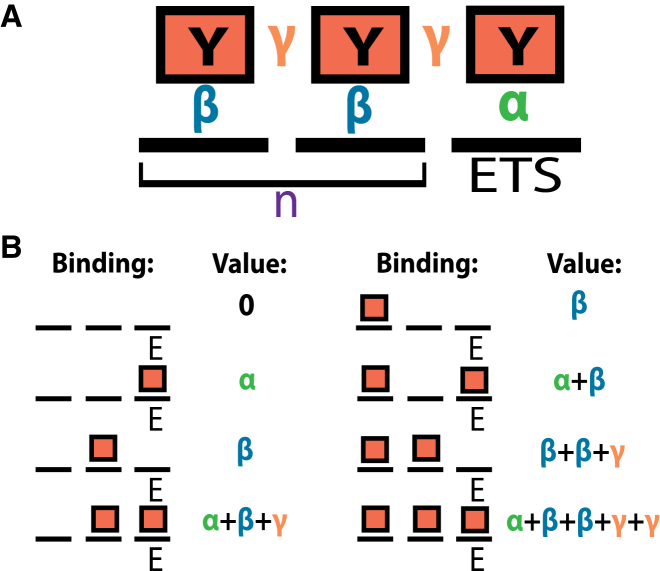
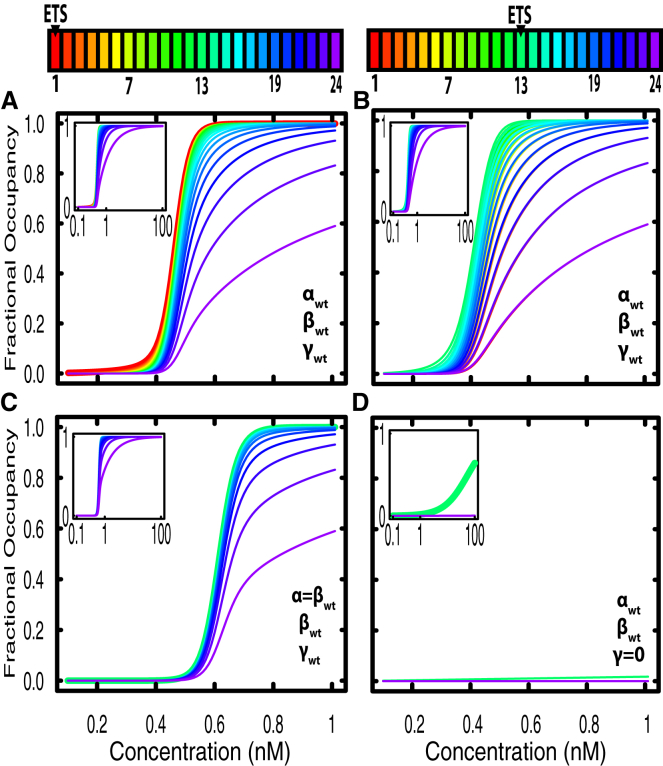
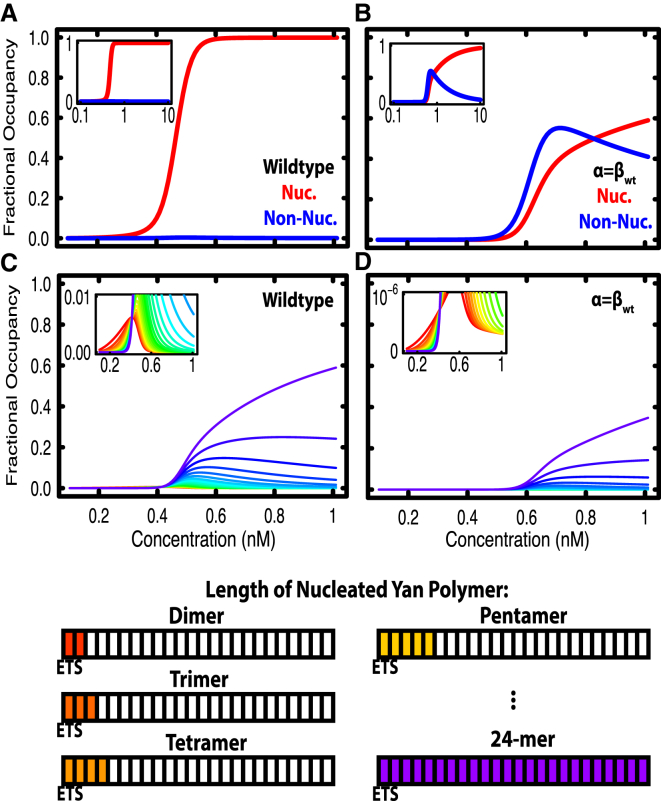
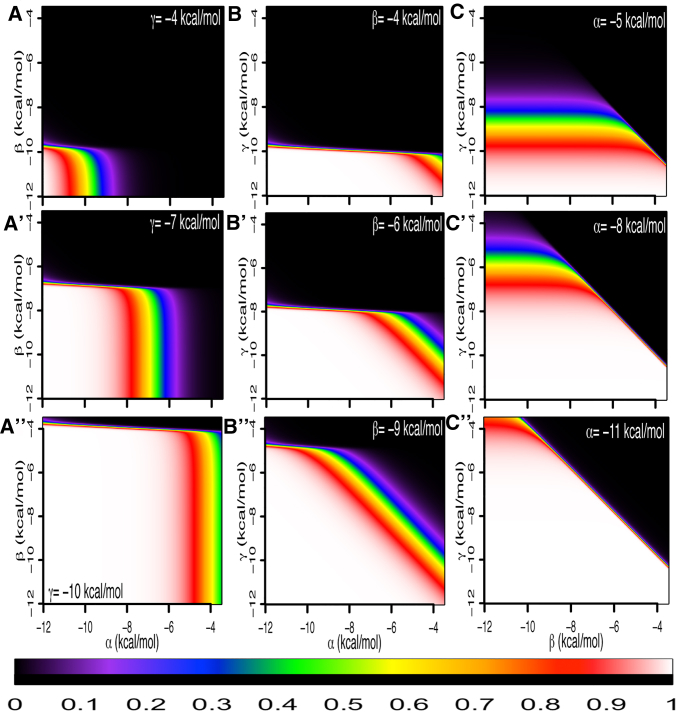
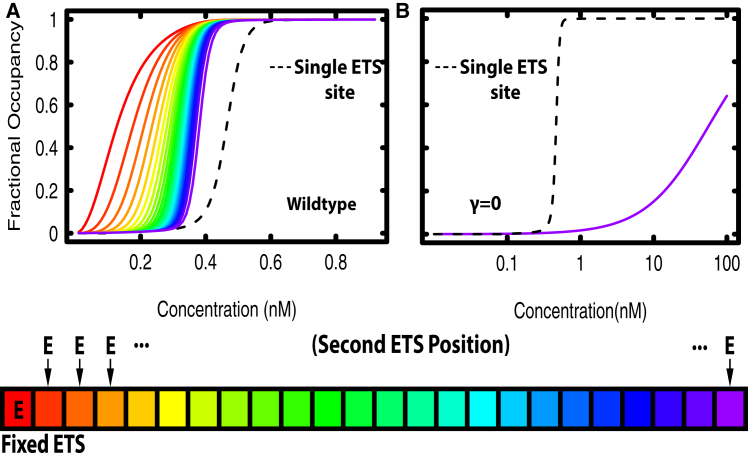
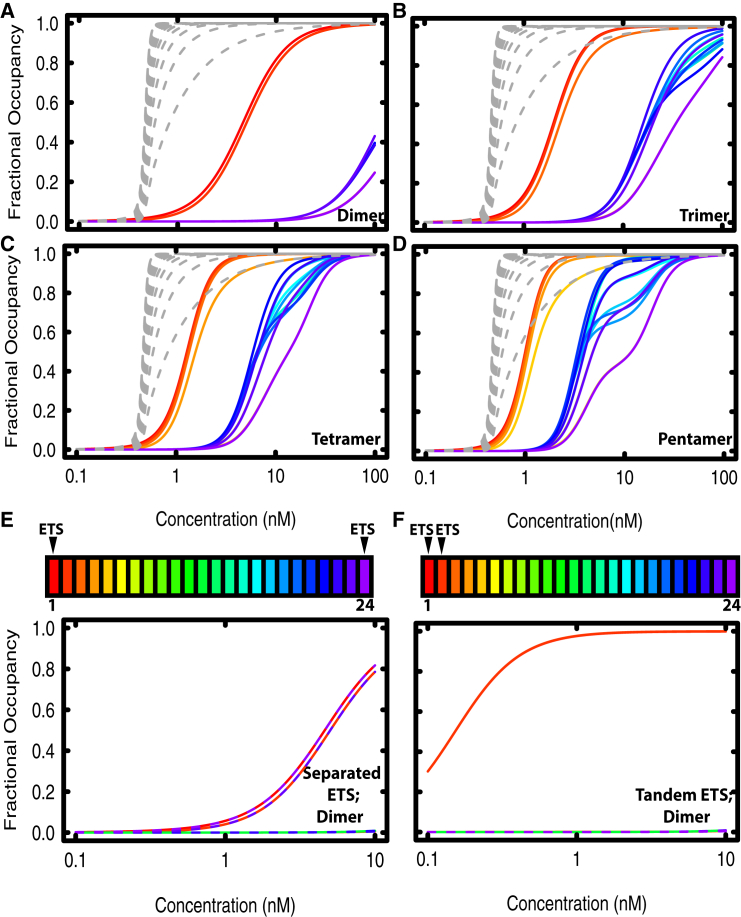
Transcription factors use both protein-DNA and protein-protein interactions to assemble appropriate complexes to regulate gene expression. Although most transcription factors operate as monomers or dimers, a few, including the E26 transformation-specific family repressors Drosophila melanogaster Yan and its human homolog TEL/ETV6, can polymerize. Although polymerization is required for both the normal and oncogenic function of Yan and TEL/ETV6, the mechanisms by which it influences the recruitment, organization, and stability of transcriptional complexes remain poorly understood. Further, a quantitative description of the DNA occupancy of a polymerizing transcription factor is lacking, and such a description would have broader applications to the conceptually related area of polymerizing chromatin regulators. To expand the theoretical basis for understanding how the oligomeric state of a transcriptional regulator influences its chromatin occupancy and function, we leveraged the extensive biochemical characterization of E26 transformation-specific factors to develop a mathematical model of Yan occupancy at chemical equilibrium. We find that spreading condensation from a specific binding site can take place in a path-independent manner given reasonable values of the free energies of specific and non-specific DNA binding and protein-protein cooperativity. Our calculations show that polymerization confers upon a transcription factor the unique ability to extend occupancy across DNA regions far from specific binding sites. In contrast, dimerization promotes recruitment to clustered binding sites and maximizes discrimination between specific and non-specific sites. We speculate that the association with non-specific DNA afforded by polymerization may enable regulatory behaviors that are well-suited to transcriptional repressors but perhaps incompatible with precise activation.
Copyright © 2017 Biophysical Society. Published by Elsevier Inc. All rights reserved.
Figures
Similar articles
-
Cooperative recruitment of Yan via a high-affinity ETS supersite organizes repression to confer specificity and robustness to cardiac cell fate specification.Genes Dev. 2018 Mar 1;32(5-6):389-401. doi: 10.1101/gad.307132.117. Epub 2018 Mar 13. Genes Dev. 2018. PMID: 29535190 Free PMC article.
-
The relationship between long-range chromatin occupancy and polymerization of the Drosophila ETS family transcriptional repressor Yan.Genetics. 2013 Feb;193(2):633-49. doi: 10.1534/genetics.112.146647. Epub 2012 Nov 19. Genetics. 2013. PMID: 23172856 Free PMC article.
-
Chromatin occupancy patterns of the ETS repressor Yan: a mechanism for buffering gene expression against noise?Fly (Austin). 2013 Apr-Jun;7(2):92-8. doi: 10.4161/fly.24162. Epub 2013 Apr 1. Fly (Austin). 2013. PMID: 23575308 Free PMC article.
-
Sterile alpha motif domain-mediated self-association plays an essential role in modulating the activity of the Drosophila ETS family transcriptional repressor Yan.Mol Cell Biol. 2010 Mar;30(5):1158-70. doi: 10.1128/MCB.01225-09. Epub 2010 Jan 4. Mol Cell Biol. 2010. PMID: 20048052 Free PMC article.
-
Proteins of the ETS family with transcriptional repressor activity.Oncogene. 2000 Dec 18;19(55):6524-32. doi: 10.1038/sj.onc.1204045. Oncogene. 2000. PMID: 11175368 Review.
Cited by
-
Cooperative recruitment of Yan via a high-affinity ETS supersite organizes repression to confer specificity and robustness to cardiac cell fate specification.Genes Dev. 2018 Mar 1;32(5-6):389-401. doi: 10.1101/gad.307132.117. Epub 2018 Mar 13. Genes Dev. 2018. PMID: 29535190 Free PMC article.
-
Tuned polymerization of the transcription factor Yan limits off-DNA sequestration to confer context-specific repression.Elife. 2018 Nov 9;7:e37545. doi: 10.7554/eLife.37545. Elife. 2018. PMID: 30412049 Free PMC article.
-
Ratiometric sensing of Pnt and Yan transcription factor levels confers ultrasensitivity to photoreceptor fate transitions in Drosophila.Development. 2023 Apr 15;150(8):dev201467. doi: 10.1242/dev.201467. Epub 2023 Apr 24. Development. 2023. PMID: 36942737 Free PMC article.
-
Sticky, Adaptable, and Many-sided: SAM protein versatility in normal and pathological hematopoietic states.Bioessays. 2023 Aug;45(8):e2300022. doi: 10.1002/bies.202300022. Epub 2023 Jun 15. Bioessays. 2023. PMID: 37318311 Free PMC article. Review.
-
A quantitative binding model for the Apl protein, the dual purpose recombination-directionality factor and lysis-lysogeny regulator of bacteriophage 186.Nucleic Acids Res. 2020 Sep 18;48(16):8914-8926. doi: 10.1093/nar/gkaa655. Nucleic Acids Res. 2020. PMID: 32789491 Free PMC article.
References
-
- Funnell A.P., Crossley M. Homo- and heterodimerization in transcriptional regulation. Adv. Exp. Med. Biol. 2012;747:105–121. - PubMed
-
- Weake V.M., Workman J.L. Inducible gene expression: diverse regulatory mechanisms. Nat. Rev. Genet. 2010;11:426–437. - PubMed
-
- Perissi V., Jepsen K., Rosenfeld M.G. Deconstructing repression: evolving models of co-repressor action. Nat. Rev. Genet. 2010;11:109–123. - PubMed
-
- Garrell J., Campuzano S. The helix-loop-helix domain: a common motif for bristles, muscles and sex. BioEssays. 1991;13:493–498. - PubMed
-
- Germain P., Bourguet W. Dimerization of nuclear receptors. Methods Cell Biol. 2013;117:21–41. - PubMed
MeSH terms
Substances
Grants and funding
LinkOut - more resources
Full Text Sources
Other Literature Sources
Molecular Biology Databases
