. 2017 Jan 11;18(1):25.
doi: 10.1186/s12859-016-1437-3.

SCOPA and META-SCOPA: software for the analysis and aggregation of genome-wide association studies of multiple correlated phenotypes

Affiliations

SCOPA and META-SCOPA: software for the analysis and aggregation of genome-wide association studies of multiple correlated phenotypes

Reedik Mägi et al. BMC Bioinformatics. .

Abstract

Background: Genome-wide association studies (GWAS) of single nucleotide polymorphisms (SNPs) have been successful in identifying loci contributing genetic effects to a wide range of complex human diseases and quantitative traits. The traditional approach to GWAS analysis is to consider each phenotype separately, despite the fact that many diseases and quantitative traits are correlated with each other, and often measured in the same sample of individuals. Multivariate analyses of correlated phenotypes have been demonstrated, by simulation, to increase power to detect association with SNPs, and thus may enable improved detection of novel loci contributing to diseases and quantitative traits.

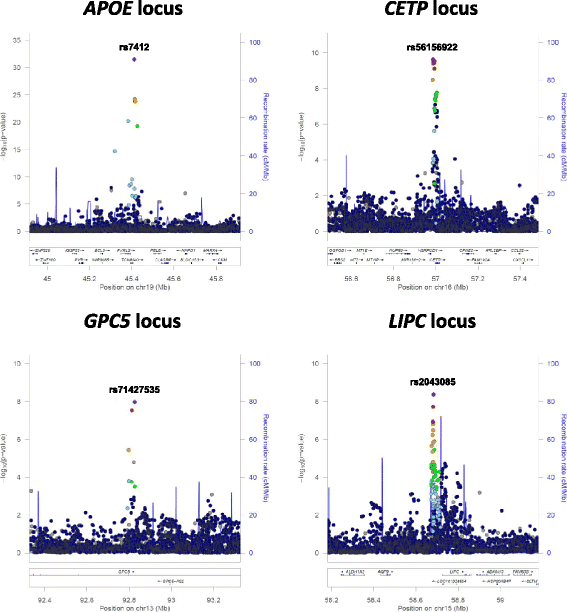
Results: We have developed the SCOPA software to enable GWAS analysis of multiple correlated phenotypes. The software implements "reverse regression" methodology, which treats the genotype of an individual at a SNP as the outcome and the phenotypes as predictors in a general linear model. SCOPA can be applied to quantitative traits and categorical phenotypes, and can accommodate imputed genotypes under a dosage model. The accompanying META-SCOPA software enables meta-analysis of association summary statistics from SCOPA across GWAS. Application of SCOPA to two GWAS of high-and low-density lipoprotein cholesterol, triglycerides and body mass index, and subsequent meta-analysis with META-SCOPA, highlighted stronger association signals than univariate phenotype analysis at established lipid and obesity loci. The META-SCOPA meta-analysis also revealed a novel signal of association at genome-wide significance for triglycerides mapping to GPC5 (lead SNP rs71427535, p = 1.1x10⁻⁸), which has not been reported in previous large-scale GWAS of lipid traits.

Conclusions: The SCOPA and META-SCOPA software enable discovery and dissection of multiple phenotype association signals through implementation of a powerful reverse regression approach.

Keywords: Correlation; Genome-wide association study; Meta-analysis; Multiple phenotypes; Multivariate analysis; Reverse regression.


Figures

Fig. 1
Fig. 1
Manhattan plot of META-SCOPA meta-analysis of GWAS of lipid traits and BMI in 1,441 individuals from the Estonian Genome Center, University of Tartu. Each point represents a SNP passing quality control, plotted according to their genomic position (NCBI build GRCh37, UCSC hg19 assembly) on the x-axis and their p-value for multiple phenotype association (on -log10 scale) on the y-axis. Previously reported loci for lipid traits and BMI are highlighted in purple. Names of loci attaining genome-wide significance (p <5x10⁻⁸) are reported as the nearest gene to the lead SNP, unless a better biological candidate maps nearby. SNPs attaining genome-wide significant, but not mapping to previously reported loci for lipid traits or BMI, are highlighted in green
Fig. 2
Fig. 2
Signal plots for loci attaining genome-wide significance (p <5x10⁻⁸) from META-SCOPA meta-analysis of GWAS of lipid traits and BMI in 1,441 individuals from the Estonian Genome Center, University of Tartu. Each point represents a SNP passing quality control in the association analysis, plotted with their p-value (on a -log10 scale) as a function of genomic position (NCBI build GRCh37, UCSC hg19 assembly). In each plot, the lead SNP is represented by the purple symbol. The colour coding of all other variants indicates linkage disequilibrium with the lead SNP in European ancestry haplotypes from the 1000 Genomes Project reference panel: red r 2 ≥0.8; gold 0.6 ≤ r 2 <0.8; green 0.4 ≤ r 2 <0.6; cyan 0.2 ≤ r 2 <0.4; blue r 2 <0.2; grey r 2 unknown. Recombination rates are estimated from Phase II HapMap and gene annotations are taken from the University of California Santa Cruz genome browser

References

    1. Welter D, MacArthur J, Morales J, Burdett T, Hall P, Junkins H, Klemm A, Flicek P, Manolio T, Hindorff L, Parkinson H. The NHGRI GWAS catalog, a curated resource of SNP-trait associations. Nucleic Acids Res. 2014;42:D1001–6. doi: 10.1093/nar/gkt1229. - DOI - PMC - PubMed
    1. Teslovich TM, et al. Biological, clinical and population relevance of 95 loci for blood lipids. Nature. 2010;466:707–13. doi: 10.1038/nature09270. - DOI - PMC - PubMed
    1. Ellinghaus D, et al. Analysis of five chronic inflammatory diseases identifies 27 new associations and highlights disease-specific patterns at shared loci. Nat Genet. 2016;48:510–8. doi: 10.1038/ng.3528. - DOI - PMC - PubMed
    1. Solovieff N, Cotsapas C, Lee PH, Purcell SM, Smoller JW. Pleiotropy in complex traits: challenges and strategies. Nat Rev Genet. 2013;14:483–95. doi: 10.1038/nrg3461. - DOI - PMC - PubMed
    1. Shriner D. Moving toward systems genetics through multiple trait analysis in genome-wide association studies. Front Genet. 2012;3:1. doi: 10.3389/fgene.2012.00001. - DOI - PMC - PubMed