

GBS-based single dosage markers for linkage and QTL mapping allow gene mining for yield-related traits in sugarcane
- PMID: 28077090
- PMCID: PMC5225503
- DOI: 10.1186/s12864-016-3383-x
GBS-based single dosage markers for linkage and QTL mapping allow gene mining for yield-related traits in sugarcane
Abstract
Background: Sugarcane (Saccharum spp.) is predominantly an autopolyploid plant with a variable ploidy level, frequent aneuploidy and a large genome that hampers investigation of its organization. Genetic architecture studies are important for identifying genomic regions associated with traits of interest. However, due to the genetic complexity of sugarcane, the practical applications of genomic tools have been notably delayed in this crop, in contrast to other crops that have already advanced to marker-assisted selection (MAS) and genomic selection. High-throughput next-generation sequencing (NGS) technologies have opened new opportunities for discovering molecular markers, especially single nucleotide polymorphisms (SNPs) and insertion-deletion (indels), at the genome-wide level. The objectives of this study were to (i) establish a pipeline for identifying variants from genotyping-by-sequencing (GBS) data in sugarcane, (ii) construct an integrated genetic map with GBS-based markers plus target region amplification polymorphisms and microsatellites, (iii) detect QTLs related to yield component traits, and (iv) perform annotation of the sequences that originated the associated markers with mapped QTLs to search putative candidate genes.
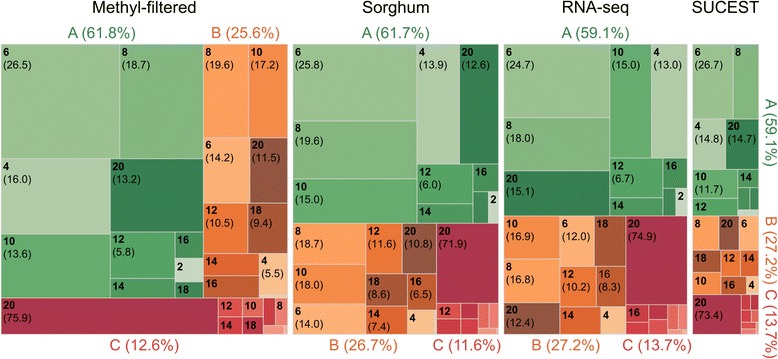
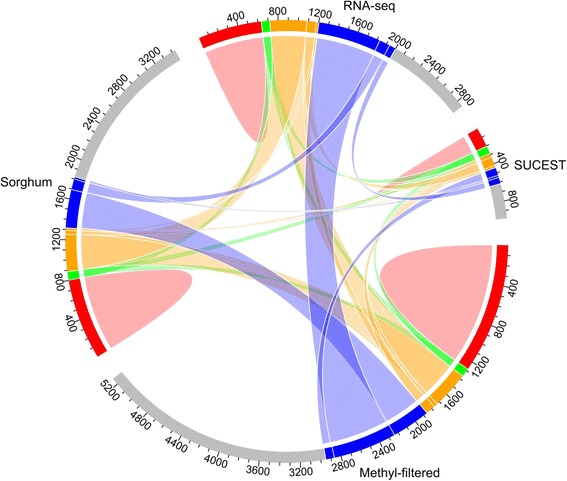
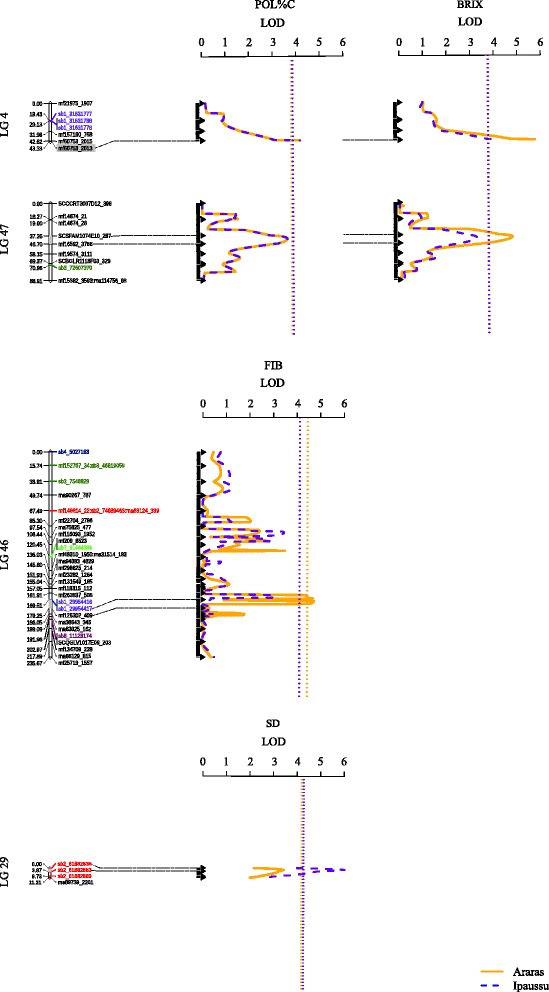
Results: We used four pseudo-references to align the GBS reads. Depending on the reference, from 3,433 to 15,906 high-quality markers were discovered, and half of them segregated as single-dose markers (SDMs) on average. In addition to 7,049 non-redundant SDMs from GBS, 629 gel-based markers were used in a subsequent linkage analysis. Of 7,678 SDMs, 993 were mapped. These markers were distributed throughout 223 linkage groups, which were clustered in 18 homo(eo)logous groups (HGs), with a cumulative map length of 3,682.04 cM and an average marker density of 3.70 cM. We performed QTL mapping of four traits and found seven QTLs. Our results suggest the presence of a stable QTL across locations. Furthermore, QTLs to soluble solid content (BRIX) and fiber content (FIB) traits had markers linked to putative candidate genes.
Conclusions: This study is the first to report the use of GBS for large-scale variant discovery and genotyping of a mapping population in sugarcane, providing several insights regarding the use of NGS data in a polyploid, non-model species. The use of GBS generated a large number of markers and still enabled ploidy and allelic dosage estimation. Moreover, we were able to identify seven QTLs, two of which had great potential for validation and future use for molecular breeding in sugarcane.
Keywords: Allelic dosage; Molecular markers; Polyploidy; Quantitative traits; SNPs; Saccharum spp.
Figures
References
-
- D’Hont A, Glaszmann JC. Sugarcane genome analysis with molecular markers, a first decade of research. Proc Int Soc Sugar Cane Technol. 2001;24:556–9.
-
- D’Hont A, Ison D, Alix K, Roux C, Glaszmann JC. Determination of basic chromosome numbers in the genus Saccharum by physical mapping of ribosomal RNA genes. Genome. 1998;41:221–5. doi: 10.1139/gen-41-2-221. - DOI
Publication types
MeSH terms
Substances
LinkOut - more resources
Full Text Sources
Other Literature Sources
Miscellaneous
