

Relationships between flortaucipir PET tau binding and amyloid burden, clinical diagnosis, age and cognition
- PMID: 28077397
- PMCID: PMC5382945
- DOI: 10.1093/brain/aww334
Relationships between flortaucipir PET tau binding and amyloid burden, clinical diagnosis, age and cognition
Abstract
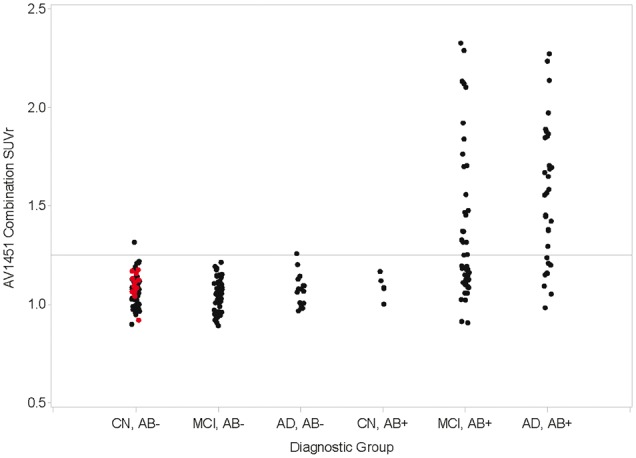
The advent of tau-targeted positron emission tomography tracers such as flortaucipir (18F-AV-1451, also known as 18F-T807) have made it possible to investigate the sequence of development of tau and amyloid-β in relationship to age, and to the development of cognitive impairment due to Alzheimer's disease. In this study, flortaucipir tau and florbetapir amyloid positron emission tomography were obtained for 217 subjects including 16 young and 58 older cognitively normal subjects, 95 subjects with mild cognitive impairment (Mini-Mental State Examination 24-30) and 48 subjects with clinically-defined possible or probable Alzheimer's disease (Mini-Mental State Examination >10). Images were evaluated visually and quantitatively by regional and voxel-based cortical to cerebellar standard uptake value ratios. For amyloid positron emission tomography positive (Aβ+) subjects, flortaucipir neocortical standard uptake value ratio was significantly higher with more advanced clinical stage (Alzheimer's disease > mild cognitive impairment > older cognitively normal) and was significantly elevated for Aβ+ mild cognitive impairment and Alzheimer's disease subjects relative to the respective Aβ- subjects. In contrast, florbetapir Aβ- older cognitively normal subjects showed an increase in flortaucipir standard uptake value ratios in mesial temporal lobe regions (amygdala, hippocampus/choroid plexus region of interest) compared to younger cognitively normal subjects, but no increased standard uptake value ratios in neocortical regions. Analysis of covariance with planned contrasts showed no differences in regional or composite posterior neocortical flortaucipir standard uptake value ratio as a function of diagnostic group among Aβ- older cognitively normal or clinically diagnosed Alzheimer's disease or mild cognitive impairment subjects. The pattern of flortaucipir distribution among Aβ+ subjects was reminiscent of the cross-sectional distribution of tau reported in post-mortem pathology studies, in that the most commonly affected regions were the inferior and lateral temporal lobes, the same regions where the first signs of increased retention appeared in Aβ+ cognitively normal subjects. However, there was large variability in extent/density of flortaucipir tau binding among Aβ+ subjects. Although high neocortical flortaucipir retention was consistently associated with an Aβ+ florbetapir positron emission tomography scan, not all Aβ+ subjects had elevated flortaucipir standard uptake value ratios. Finally, within the Aβ+ group, increasing levels of flortaucipir tau binding were associated with increased cognitive impairment, as assessed by Mini-Mental State Examination and Alzheimer's Disease Assessment Scale. These results suggest development of tau beyond the mesial temporal lobe is associated with, and may be dependent on, amyloid accumulation. Further, the results are consistent with the hypothesis that cortical tau is associated with cognitive impairment.
Keywords: 18F-AV-1451; PET; florbetapir; flortaucipir; tau.
© The Author (2017). Published by Oxford University Press on behalf of the Guarantors of Brain.
Figures


References
-
- Anand R, Gill KD, Mahdi AA. Therapeutics of Alzheimer's disease: past, present and future. Neuropharmacology 2014; 76 (Part A): 27–50. - PubMed
-
- Bouras C, Hof PR, Giannakopoulos Pl, Michel JP, Morrison JH. Regional distribution of neurofibrillary tangles and senile plaques in the cerebral cortex of elderly patients: a quantitative evaluation of a one-year autopsy population from a geriatric hospital. Cerebral Cortex 1994; 4: 138–50. - PubMed
-
- Braak H, Braak E. Neuropathological stageing of Alzheimer-related changes. Acta Neuropathol 1991; 82: 239–59. - PubMed
Publication types
MeSH terms
Substances
LinkOut - more resources
Full Text Sources
Other Literature Sources
Medical
