. 2018 Jul 20;19(4):554-565.
doi: 10.1093/bib/bbw138.

High-throughput sequencing of the T-cell receptor repertoire: pitfalls and opportunities

Affiliations

High-throughput sequencing of the T-cell receptor repertoire: pitfalls and opportunities

James M Heather et al. Brief Bioinform. .

Abstract

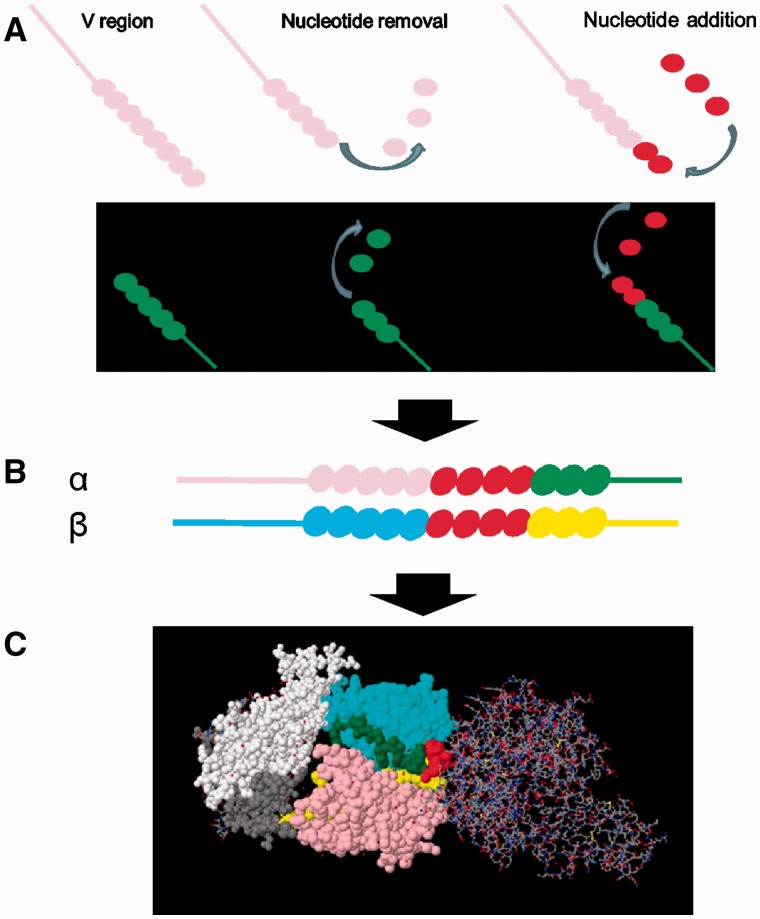
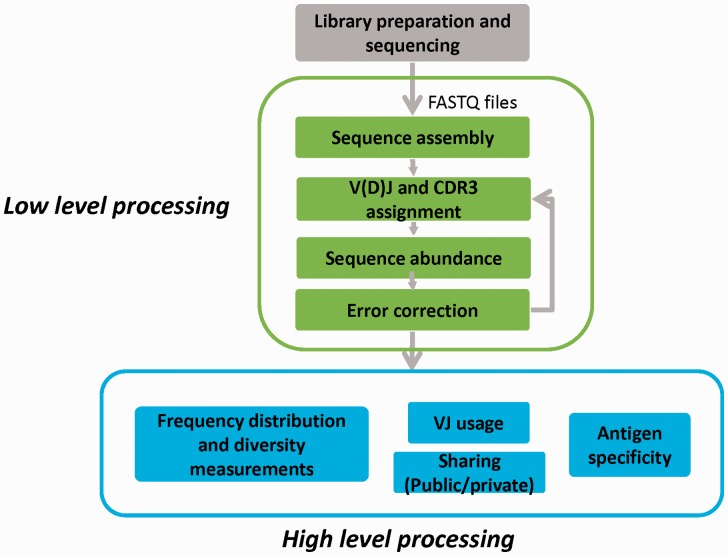
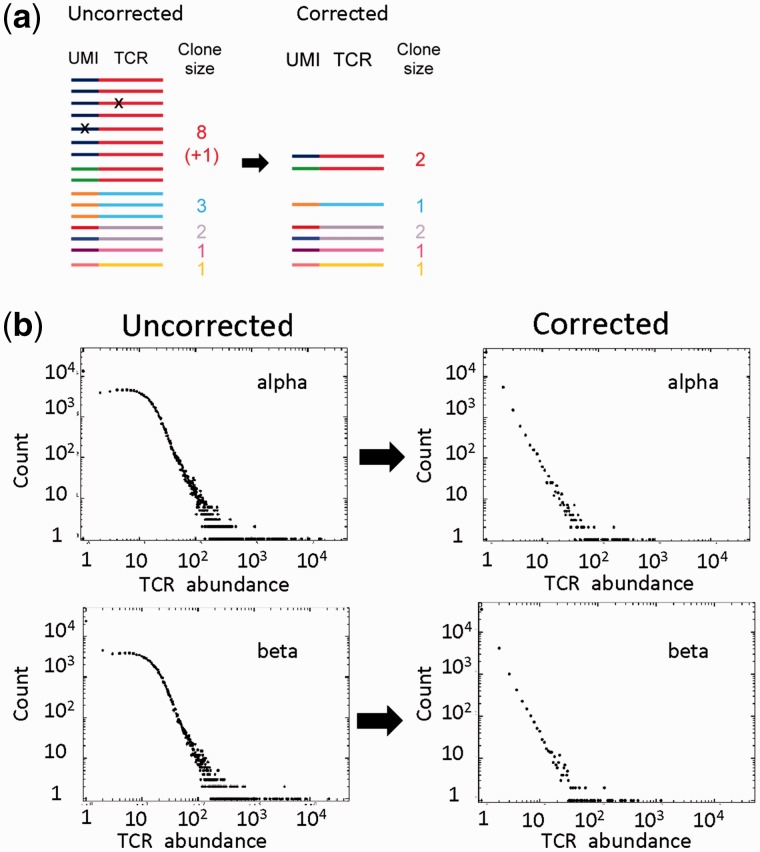
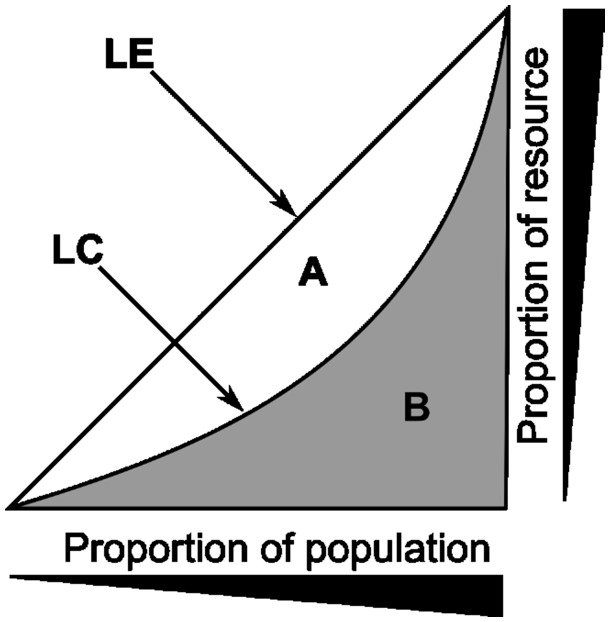
T-cell specificity is determined by the T-cell receptor, a heterodimeric protein coded for by an extremely diverse set of genes produced by imprecise somatic gene recombination. Massively parallel high-throughput sequencing allows millions of different T-cell receptor genes to be characterized from a single sample of blood or tissue. However, the extraordinary heterogeneity of the immune repertoire poses significant challenges for subsequent analysis of the data. We outline the major steps in processing of repertoire data, considering low-level processing of raw sequence files and high-level algorithms, which seek to extract biological or pathological information. The latest generation of bioinformatics tools allows millions of DNA sequences to be accurately and rapidly assigned to their respective variable V and J gene segments, and to reconstruct an almost error-free representation of the non-templated additions and deletions that occur. High-level processing can measure the diversity of the repertoire in different samples, quantify V and J usage and identify private and public T-cell receptors. Finally, we discuss the major challenge of linking T-cell receptor sequence to function, and specifically to antigen recognition. Sophisticated machine learning algorithms are being developed that can combine the paradoxical degeneracy and cross-reactivity of individual T-cell receptors with the specificity of the overall T-cell immune response. Computational analysis will provide the key to unlock the potential of the T-cell receptor repertoire to give insight into the fundamental biology of the adaptive immune system and to provide powerful biomarkers of disease.


Figures

Figure 1
Figure 1
T-cell recombination and the generation of diversity. Individual V and J genes are selected stochastically (but not uniformly) and recombined during T-cell development in the thymus. During recombination base pairs can be removed and/or added at the junction before the final ligation (A). Both alpha and beta genes undergo recombination independently. Beta genes incorporate an additional D region minigene between V and J, giving rise to two junctions (not shown). Finally, alpha and beta V regions are transcribed, spliced onto their respective constant regions (B) and translated, and the two proteins heterodimerize to give rise to a single TCR (C). The TCR/MHC/peptide complex shown here is derived from the PDB structure 1FYT, and displayed using RasMol [3]. The TCR is shown in space fill, and the peptide/MHC complex is shown in stick representation on the right. Pink – Vα; yellow – Jα; blue – Vβ; green – Jβ; and red – CDR3.
Figure 2
Figure 2
The main stages involved in the study of immune repertoires. Grey box (top): library preparation and sequencing. Green boxes (middle): low-level processing that includes sequence assembly, assignment to genomic V, D and J genes, extraction of CDR3 regions and error correction. See sections ‘Gene assignment’, ‘Sequence and abundance error-correction strategies’ and ‘Benchmarking and its challenges’ of this review. Blue boxes (bottom): high-level processing and analysis, which includes diversity measurements, and determining clonal frequency distributions, analysis of differential V and J usage, analysis of inter-individual sharing of TCR sequences (public versus private) and relationship between sequence and antigen specificity. See sections ‘High-level repertoire processing: revealing biological and clinical meaning’, ‘Measures of diversity’ and ‘Antigen specificity’ of this review.
Figure 3
Figure 3
Error correction using UMIs. (A) Schematic of the error-correction process. Each TCR is associated with a UMI, which acts as a molecular barcode. TCRs are clustered based on UMI. Identical TCRs within a cluster (i.e. with the same molecular barcode) are collapsed to a count of 1. Minority variants within a cluster are similarly merged with the majority variant. The number of clusters (i.e. same TCR, different UMI) gives the corrected abundance count for that TCR. Optionally, barcodes within a specified molecular distance of each other (usually 1 or 2 Hamming units) can be clustered together. (B) The effects of error correction on sequence abundance data for a set of TCR alpha and beta sequences obtained from a sample of unfractionated peripheral blood. The number of TCRs with each abundance observed is plotted against the abundance itself (labeled TCR abundance), e.g. the leftmost point represents the number of TCRs that occur only once in the sample, the next point the number that occurs twice, etc. The figure shows the distribution obtained before (left) and after (right) error correction using UMIs.
Figure 4
Figure 4
The Lorenz plot and the Gini index. LE – line of equality; LC – Lorenz curve; the Gini index is defined as the ratio of the areas A/(A + B) (0≤G≤1). Individual members within a population, which in the context of the repertoire is unique TCR sequences, are ranked in order of abundance. The Lorenz curve is obtained by plotting the cumulative abundance of each TCR against its rank (lowest to highest). If all individual species are of equal abundance, the Lorenz curve follows the diagonal, and the Gini index is zero. The more unequal the distribution of abundances, the larger the Gini index (≤1).
Figure 5
Figure 5
Measures of diversity. (A) The ‘true diversity’ refers to the number of equally abundant species within a population needed for the average proportional abundance of the species to equal that observed (where all species may not be equally abundant). It is calculated as the inverse of the weighted generalized mean of order q of the proportion (p) of each species within a population of size N. (B) The richness (R) is the number of distinct species observed. It is equivalent to ‘true diversity’ of order 0. (C) Shannon diversity index (ShI, often referred to as the Shannon Entropy) is the logarithm of the ‘true diversity’, as q → 1. (D) The Simpsons diversity index (SI) is the inverse of the ‘true diversity’ of order 2.

Similar articles

Cited by

References

    1. Alt FW, Oltz EM, Young F, et al.VDJ recombination. Immunol Today 1992; 13:306–14. - PubMed
    1. Krangel MS. Mechanics of T cell receptor gene rearrangement. Curr Opin Immunol 2009; 21:133–9. - PMC - PubMed
    1. Bernstein HJ. Recent changes to RasMol, recombining the variants. Trends Biochem Sci 2000; 25:453–5. - PubMed
    1. Vanhanen R, Heikkilä N, Aggarwal K, et al.T cell receptor diversity in the human thymus. Mol Immunol 2016; 76:116–22. - PubMed
    1. Robins HS, Campregher PV, Srivastava SK, et al.Comprehensive assessment of T-cell receptor beta-chain diversity in alpha beta T cells. Blood 2009; 114:4099–107. - PMC - PubMed

Publication types

MeSH terms

Substances