

Predicting patient 'cost blooms' in Denmark: a longitudinal population-based study
- PMID: 28077408
- PMCID: PMC5253526
- DOI: 10.1136/bmjopen-2016-011580
Predicting patient 'cost blooms' in Denmark: a longitudinal population-based study
Abstract
Objectives: To compare the ability of standard versus enhanced models to predict future high-cost patients, especially those who move from a lower to the upper decile of per capita healthcare expenditures within 1 year-that is, 'cost bloomers'.
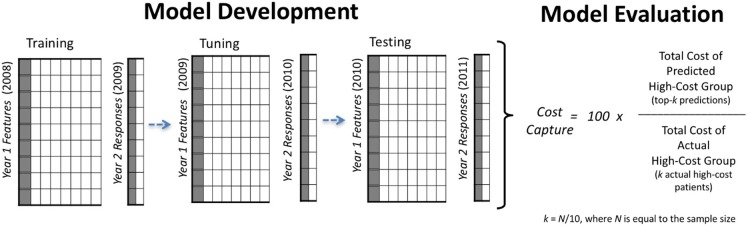
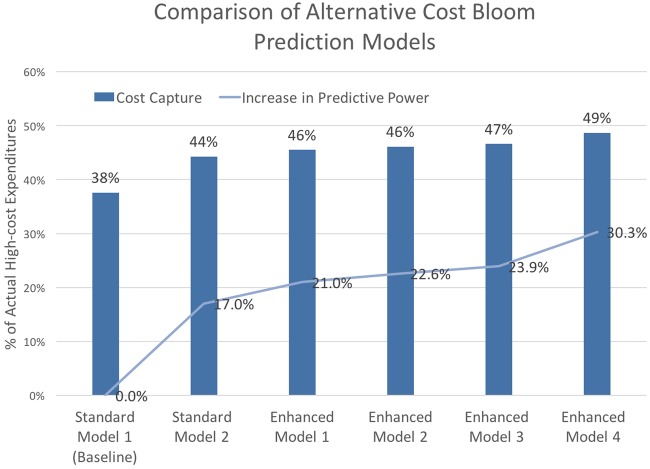
Design: We developed alternative models to predict being in the upper decile of healthcare expenditures in year 2 of a sample, based on data from year 1. Our 6 alternative models ranged from a standard cost-prediction model with 4 variables (ie, traditional model features), to our largest enhanced model with 1053 non-traditional model features. To quantify any increases in predictive power that enhanced models achieved over standard tools, we compared the prospective predictive performance of each model.
Participants and setting: We used the population of Western Denmark between 2004 and 2011 (2 146 801 individuals) to predict future high-cost patients and characterise high-cost patient subgroups. Using the most recent 2-year period (2010-2011) for model evaluation, our whole-population model used a cohort of 1 557 950 individuals with a full year of active residency in year 1 (2010). Our cost-bloom model excluded the 155 795 individuals who were already high cost at the population level in year 1, resulting in 1 402 155 individuals for prediction of cost bloomers in year 2 (2011).
Primary outcome measures: Using unseen data from a future year, we evaluated each model's prospective predictive performance by calculating the ratio of predicted high-cost patient expenditures to the actual high-cost patient expenditures in Year 2-that is, cost capture.
Results: Our best enhanced model achieved a 21% and 30% improvement in cost capture over a standard diagnosis-based model for predicting population-level high-cost patients and cost bloomers, respectively.
Conclusions: In combination with modern statistical learning methods for analysing large data sets, models enhanced with a large and diverse set of features led to better performance-especially for predicting future cost bloomers.
Keywords: high-cost patients; predictive analytics.
Published by the BMJ Publishing Group Limited. For permission to use (where not already granted under a licence) please go to http://www.bmj.com/company/products-services/rights-and-licensing/.
Conflict of interest statement
Conflicts of Interest: None declared.
Figures
References
-
- National Institute for Health Care Management. The concentration of health care spending. NIHCM Data Brief: NIHCM Foundation, 2012.
-
- Cohen S, Uberoi N. Differentials in the concentration in the level of health expenditures across population subgroups in the U.S., 2010. Statistical Brief . Agency for Healthcare Research and Quality, 2013. - PubMed
-
- Cohen SB, Yu W. The concentration and persistence in the level of health expenditures over time: estimates for the U.S. population, 2008–2009. Agency for Healthcare Research and Quality, 2012.
Publication types
MeSH terms
Grants and funding
LinkOut - more resources
Full Text Sources
Other Literature Sources
Medical