

Human RIF1 and protein phosphatase 1 stimulate DNA replication origin licensing but suppress origin activation
- PMID: 28077461
- PMCID: PMC5331243
- DOI: 10.15252/embr.201641983
Human RIF1 and protein phosphatase 1 stimulate DNA replication origin licensing but suppress origin activation
Abstract
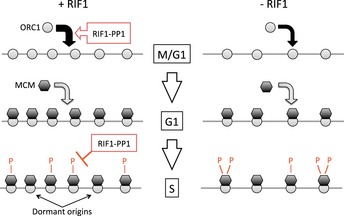
The human RIF1 protein controls DNA replication, but the molecular mechanism is largely unknown. Here, we demonstrate that human RIF1 negatively regulates DNA replication by forming a complex with protein phosphatase 1 (PP1) that limits phosphorylation-mediated activation of the MCM replicative helicase. We identify specific residues on four MCM helicase subunits that show hyperphosphorylation upon RIF1 depletion, with the regulatory N-terminal domain of MCM4 being particularly strongly affected. In addition to this role in limiting origin activation, we discover an unexpected new role for human RIF1-PP1 in mediating efficient origin licensing. Specifically, during the G1 phase of the cell cycle, RIF1-PP1 protects the origin-binding ORC1 protein from untimely phosphorylation and consequent degradation by the proteasome. Depletion of RIF1 or inhibition of PP1 destabilizes ORC1, thereby reducing origin licensing. Consistent with reduced origin licensing, RIF1-depleted cells exhibit increased spacing between active origins. Human RIF1 therefore acts as a PP1-targeting subunit that regulates DNA replication positively by stimulating the origin licensing step, and then negatively by counteracting replication origin activation.
Keywords: MCM; ORC1; PP1; RIF1; origin licensing.
© 2017 The Authors. Published under the terms of the CC BY 4.0 license.
Figures
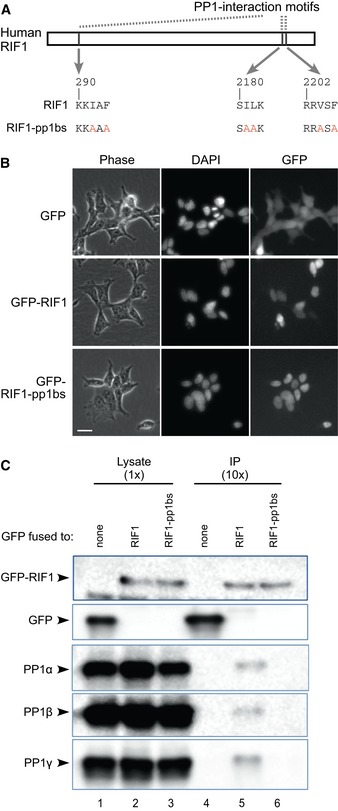
Construction of RIF1 cDNA mutated at its PP1 interaction motifs. Critical residues in all three potential PP1 interaction motifs are substituted with alanine, to create a RIF‐pp1bs allele.
Expression and localization of GFP‐RIF1 fusion proteins in stably transfected cells. Flp‐In T‐REx 293 cells with GFP, GFP‐RIF1, or GFP‐RIF1‐pp1bs were cultivated with 1 μM doxycycline (DOX) for 3 days, and expression and localization of GFP proteins were confirmed by fluorescence microscopy. Phase‐contrast, DAPI‐stain, and GFP images are shown. Scale bar indicates 25 μm.
RIF1 binds PP1 protein isoforms through its PP1 interaction motifs. GFP, GFP‐RIF1, and GFP‐RIF1‐pp1bs proteins were recovered from cell extracts using GFP‐Trap beads, and co‐purifying proteins were analyzed by Western blotting with anti‐GFP (upper two panels) or isoform‐specific PP1 antibodies (lower panels).
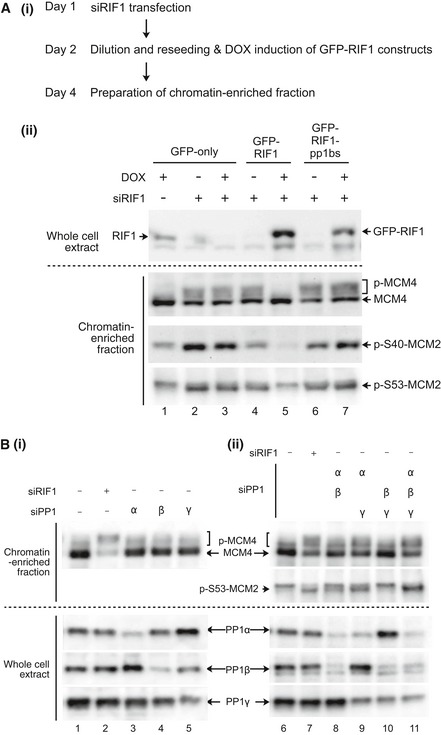
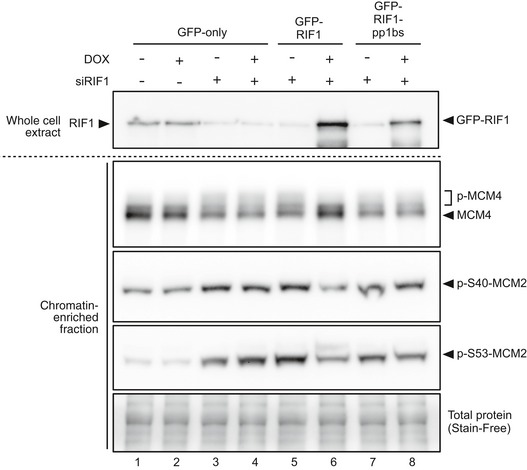
(i) Outline of experiment. On Day 1, Flp‐In T‐REx 293 cells with integrated GFP, GFP‐RIF1, or GFP‐RIF1‐pp1bs constructs were transfected with human RIF1 siRNA or non‐targeting control siRNA. On day 2, cells were diluted to ensure continuous cell proliferation throughout the experiment, and DOX was added to induce transcription of GFP, or siRNA‐resistant GFP‐RIF1 or GFP‐RIF1‐pp1bs. On day 4, chromatin‐enriched samples were prepared for Western blotting. (ii) GFP‐RIF1 prevents hyperphosphorylation of chromatin‐associated MCM proteins, while GFP‐RIF1‐pp1bs cannot. Upper panel confirms removal of endogenous RIF1 and expression of GFP‐RIF1 or GFP‐RIF1‐pp1bs. Lower three panels show Western blot analysis of chromatin‐associated proteins using antibodies recognizing MCM4, phosphorylated MCM2‐S40, or phosphorylated MCM2‐S53. Loading was normalized by total protein as described in Materials and Methods.
(i) Depletion of single PP1 isoforms does not affect MCM4 phosphorylation. PP1α, PP1β, or PP1γ isoforms were depleted from HEK293 cells using isoform‐specific siRNAs as indicated, and then, phosphorylation of MCM proteins was analyzed after 2 days as in (A). Depletion of PP1α, PP1β, or PP1γ was confirmed (lower three panels) by Western blotting with isoform‐specific antibodies. (ii) Simultaneous depletion of PP1α and PP1γ leads to hyperphosphorylation of MCM proteins. Double and triple siRNA transfections were performed. Equal amounts of siRNAs were mixed to give a constant total siRNA concentration (50 nM), and phosphorylation status of MCM proteins were analyzed as in (A). Loading was normalized by total protein.
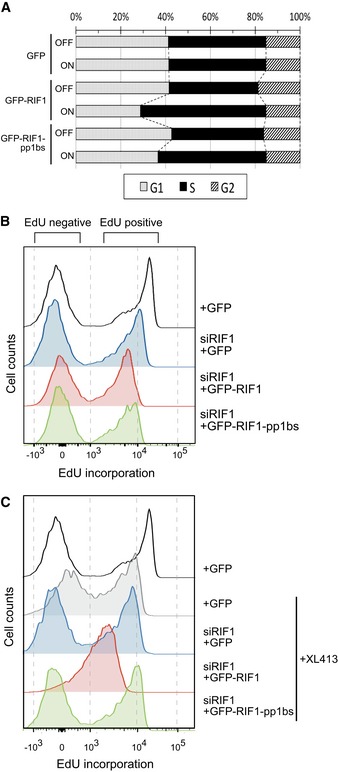
Ectopic expression of GFP‐RIF1 causes S‐phase accumulation. Flp‐In T‐REx 293 cells with stable GFP, GFP‐RIF1, or GFP‐RIF1‐pp1bs constructs were grown with or without DOX for 2 days. Plot shows cell cycle distribution of cells based on DNA content measured by flow cytometry.
Effect of depletion and ectopic expression of RIF1 on DNA synthesis. Flp‐In T‐REx 293 cells with stable GFP, GFP‐RIF1, or GFP‐RIF1‐pp1bs constructs were depleted for endogenous RIF1 by siRNA, and then after 1 day, GFP, GFP‐RIF1, or GFP‐RIF1‐pp1bs was induced by DOX addition. Two days later, cells were pulse‐labeled with 20 μM EdU for 15 min prior to flow cytometry analysis of EdU incorporation. Overlaid histograms show EdU incorporation in each condition. Note the x‐axis scale is bi‐exponential.
Effect of depletion and ectopic expression of RIF1 on DNA synthesis in the presence of 10 μM XL413. Cells were prepared and analyzed as in (B) but with XL413 added at the same time as DOX.
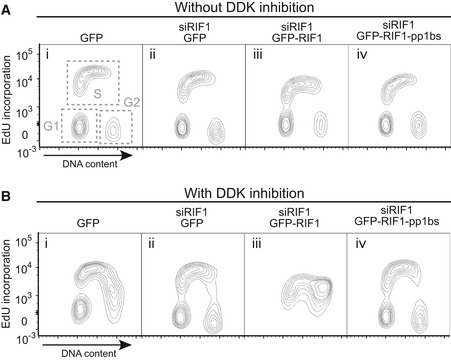
Effect of depletion followed by ectopic expression of RIF1 on DNA synthesis and cell cycle distribution, showing two‐dimensional plots of samples in Fig 3B and C. Flp‐In T‐REx 293 cells with stable GFP, GFP‐RIF1, or GFP‐RIF1‐pp1bs constructs were depleted for endogenous RIF1 by siRNA, and 1 day later, GFP, GFP‐RIF1, or GFP‐RIF1‐pp1bs was induced. Further 2 days later, cells were pulse‐labeled with 20 μM EdU for 15 min prior to preparation of cells for flow cytometry analysis of DNA content and EdU incorporation. Note the y‐axis scale is bi‐exponential.
Effect of depletion and ectopic expression of RIF1 on DNA synthesis limited by XL413 addition. Cells were prepared as in (A) but in the presence of 10 μM XL413, added at the same time as DOX induction.
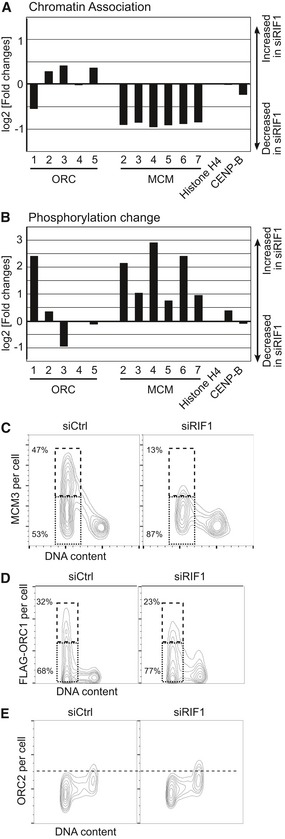
Reduced chromatin association of ORC1 and MCM proteins in RIF1‐depleted cells. Amounts of chromatin‐associated ORC and MCM proteins in HEK293 cells treated with siCtrl or siRIF1 were analyzed by quantitative proteomics as in Table 1. ORC6 was not detected perhaps due to its weak association with other ORC subunits 75. Histone H4 and CENP‐B are controls showing similar chromatin association in the presence or absence of RIF1.
Increased phosphorylation of ORC1 and MCM proteins in RIF1‐depleted cells. Relative changes in phosphorylation of chromatin‐associated ORC and MCM proteins were analyzed as in Table 1. Plot shows the log2 value for the residue most affected by depleting RIF1, for each protein. Values are normalized by the change in chromatin association of each protein.
MCM loading onto chromatin is impaired in RIF1‐depleted cells. Abundance of chromatin‐associated MCM3 in control and RIF1‐depleted HEK293 cells was analyzed by flow cytometry. Two‐dimensional contour plots are shown (x‐axis: DNA content, y‐axis: MCM3 protein abundance). The y‐axis is on a linear scale. Dashed and dotted boxes indicate G1 cells with “high‐MCM3” and “low‐MCM3”, respectively.
Reduced chromatin association of ORC1 in RIF1‐depleted cells. Amounts of chromatin‐associated FLAG‐ORC1 in control and RIF1‐depleted FLAG‐ORC1 HEK293 cells were analyzed by flow cytometry as in (C). Dashed and dotted boxes indicate G1 cells with “high‐FLAG‐ORC1” and “low‐FLAG‐ORC1”, respectively.
ORC2 was similarly analyzed, in the same set of cells as in (D).
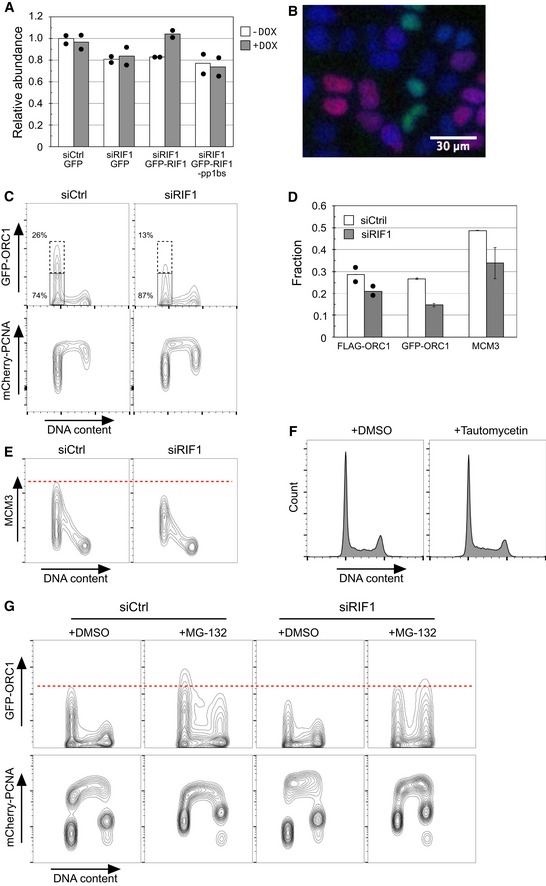
Rif1 removal or loss of Rif1‐PP1 interaction compromises chromatin association of MCM4 protein. The abundance of chromatin‐associated MCM4 (phosphorylated + unphosphorylated) was measured in Western blots and plotted relative to the control condition (i.e., Flp‐In T‐REx 293 cell line containing GFP construct without DOX induction). Bars plot the average value obtained in two biologically independent experiments, with the values obtained from each experiment indicated by filled circles.
Specimen image of permeabilized HeLa‐derived cells expressing GFP‐ORC1 and mCherry‐PCNA, showing that either GFP‐ORC1 or mCherry‐PCNA is chromatin‐associated but not both. GFP‐ORC1 mCherry‐PCNA HeLa cells were permeabilized with 0.1% NP‐40, fixed for 10 min by 1% formaldehyde, and stained with 0.5 μg/ml DAPI. DAPI‐stained DNA (blue), GFP‐ORC1 (green), and mCherry‐PCNA (red) are shown in pseudo‐color. Scale bar indicates 30 μm.
RIF1 is required for protection of GFP‐ORC1. Flow cytometry quantification of cell cycle‐specific association of GFP‐ORC1 and mCherry‐PCNA in GFP‐ORC1 mCherry‐PCNA HeLa cells. The cells were transfected with either control siRNA (siCtrl) or siRNA against RIF1 (siRIF1), followed by 3 days of incubation before flow cytometry analysis. Note the y‐axis scale of mCherry‐PCNA plot is bi‐exponential.
Proportion of G1‐phase cells showing “high‐ORC1” and “high‐MCM3” chromatin association. The fractions of G1‐phase cells with “high‐FLAG‐ORC1”, “high‐GFP‐ORC1”, and “high‐MCM3” chromatin association were measured as shown in Fig 4C and D, and panel (C). Results show the means of two, five, and three experiments for FLAG‐ORC1, GFP‐ORC1, and MCM3, respectively. Filled circles indicate the values obtained from two independent experiments for FLAG‐ORC1, with error bars indicating the SEM in other experiments.
RIF1 is required for full loading of MCM3 on chromatin in the FLAG‐ORC1 293 cell line. Chromatin‐associated MCM3 protein was analyzed by flow cytometry in the same set of cells as in Fig 4D and E.
Transient treatment with tautomycetin does not affect cell cycle distribution. Histograms indicate the DNA content of cells analyzed in Fig 5A and B.
In RIF1‐depleted cells proteasome inhibition rescues the ORC1 protection defect and restores ORC1 chromatin association. Control and RIF1‐depleted GFP‐ORC1 mCherry‐PCNA HeLa cells were incubated for 4 h in the presence of 5 μM MG‐132 and analyzed for abundance of chromatin‐associated GFP‐ORC1 protein as in panel (C).
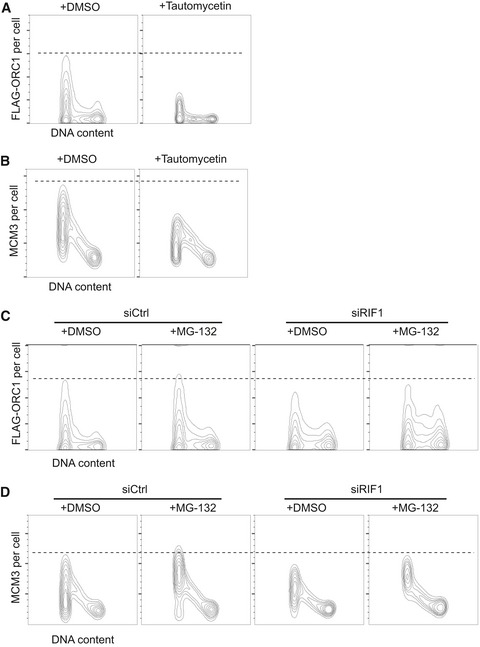
Inhibition of PP1 destabilizes ORC1. FLAG‐ORC1 HEK293 cells were treated for 4 h with 5 μM tautomycetin prior to flow cytometry, and chromatin‐associated FLAG‐ORC1 analyzed as in Fig 4D.
Inhibition of PP1 causes reduced MCM loading. Chromatin‐associated MCM3 protein was analyzed in the same set of the cells as in (A).
Reduced ORC1 chromatin association in RIF1‐depleted cells is partly rescued by inhibiting the proteasome. Control and ORC1‐depleted FLAG‐ORC1 HEK293 cells were treated for 4 h with 20 μM MG‐132 (or DMSO) prior to flow cytometry analysis.
Proteasome inhibition rescues MCM3 chromatin loading. Chromatin‐associated MCM3 was analyzed in the same set of cells as in (C).
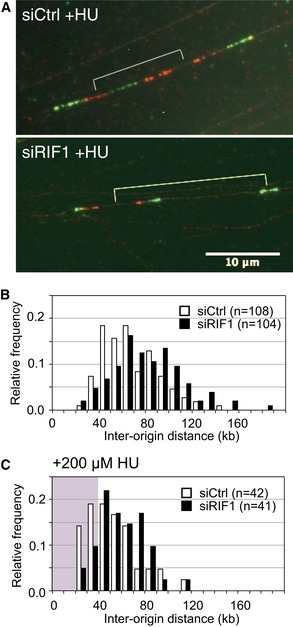
Specimen images of DNA fibers sequentially labeled with CldU and IdU. siControl‐ and siRIF1‐treated Flp‐In T‐REx 293 cells (with integrated GFP) were incubated for 4 h in the presence of 200 μM HU, with pulse‐labeling using CldU (visualized red) then IdU (visualized green) in the final 40 min.
Distribution of origin distance in siCtrl (open bars) and siRIF1 (black bars) cell lines, treated as described in (A) but with no HU treatment. For statistical analysis of IOD data, Mann–Whitney–Wilcoxon test was performed using R (version 3).
Distribution of origin distance in siCtrl (open bars) and siRIF1 (black bars) cell lines, treated as described in (A) including HU treatment. The area corresponding to IOD values shorter than 40 kb is marked by pink background.
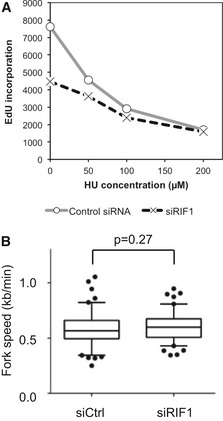
Defective DNA synthesis in RIF1‐depleted cells in the presence of low HU concentrations. siCtrl‐ and siRIF1‐treated HEK293 cells were incubated for 4.5 h with the indicated concentration of HU and in the final 30 min EdU‐labeled to assess the cellular DNA synthesis rate, measured by flow cytometry analysis.
Loss of RIF1 does not affect replication fork rate. Flp‐In T‐REx cells transfected with siCtrl (left) or siRIF1 (right) were pulse‐labeled sequentially with CldU and IdU, and replication fork rate was determined based on the IdU and CldU track lengths. The results are presented as box‐and‐whisker plots. Whiskers indicate percentiles 5–95, and dots indicate outliers. P‐value was calculated by t‐test. n = 100 for each condition.
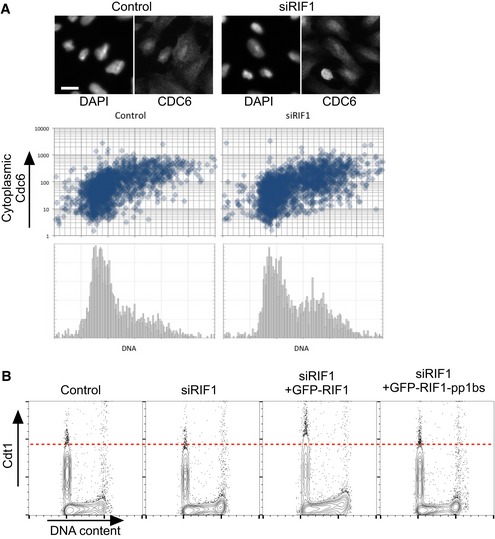
RIF1 does not control the cell cycle‐specific localization of Cdc6 protein. Subcellular localization of Cdc6 protein was previously shown to be cell cycle regulated through its phosphorylation by CDK, which leads to export of Cdc6 protein from the nucleus to the cytoplasm 47. To test whether Rif1 removal affects Cdc6 regulation, subcellular localization of Cdc6 was analyzed by immunofluorescence microscopy in U2OS cells treated with either siCtrl or siRIF1. Abundance of cytoplasmic Cdc6 and DNA content was measured for more than 1,700 cells under each condition using CellProfiler software as follows. Adaptive thresholding was applied to the blue (DAPI‐stained nuclear DNA) and green (anti‐Cdc6 stain) channels to identify areas corresponding to individual nuclei and cells, respectively. The cytoplasmic area was then defined by excluding the nuclear area from the cell area. For each cell, the integrated intensity in the green (Cdc6) channel was then measured separately for the cytoplasmic area, the nuclear area, and the whole cell. Integrated intensity in the blue channel was measured for each nuclear area to obtain a cellular DNA content value. Cells at the edge of images were excluded. Scatter plots show cytoplasmic Cdc6 abundance (y‐axis; log10 scale) against DNA content (x‐axis), while the histograms (lower panels) show DNA content of the corresponding cells. Representative images are presented at the top. The scale bar indicates 30 μm.
RIF1 has only a minor effect on Cdt1 stability. Degradation of Cdt1 protein is regulated in a similar way to ORC1: outside G1 phase, Cdt1 is phosphorylated and degraded 48. The effect of depletion followed by ectopic expression of RIF1 on Cdt1 abundance was tested by flow cytometry. Flp‐In T‐REx 293 cells with stable GFP, GFP‐RIF1, or GFP‐RIF1‐pp1bs constructs were depleted for endogenous RIF1 by siRNA, and 1 day later GFP, GFP‐RIF1, or GFP‐RIF1‐pp1bs was induced. After further 3 days, cells were prepared for flow cytometry and abundance of Cdt1 protein per cell was analyzed by flow cytometry.
Similar articles
-
Rif1 controls DNA replication by directing Protein Phosphatase 1 to reverse Cdc7-mediated phosphorylation of the MCM complex.Genes Dev. 2014 Feb 15;28(4):372-83. doi: 10.1101/gad.231258.113. Genes Dev. 2014. PMID: 24532715 Free PMC article.
-
Protein phosphatase 1 recruitment by Rif1 regulates DNA replication origin firing by counteracting DDK activity.Cell Rep. 2014 Apr 10;7(1):53-61. doi: 10.1016/j.celrep.2014.02.019. Epub 2014 Mar 20. Cell Rep. 2014. PMID: 24656819 Free PMC article.
-
Reversal of DDK-Mediated MCM Phosphorylation by Rif1-PP1 Regulates Replication Initiation and Replisome Stability Independently of ATR/Chk1.Cell Rep. 2017 Mar 7;18(10):2508-2520. doi: 10.1016/j.celrep.2017.02.042. Cell Rep. 2017. PMID: 28273463 Free PMC article.
-
Behavior of replication origins in Eukaryota - spatio-temporal dynamics of licensing and firing.Cell Cycle. 2015;14(14):2251-64. doi: 10.1080/15384101.2015.1056421. Epub 2015 Jun 1. Cell Cycle. 2015. PMID: 26030591 Free PMC article. Review.
-
ChECing out Rif1 action in freely cycling cells.Curr Genet. 2019 Apr;65(2):429-434. doi: 10.1007/s00294-018-0902-0. Epub 2018 Nov 19. Curr Genet. 2019. PMID: 30456647 Review.
Cited by
-
Use of Nuclear and Chromatin Enrichment Procedures for Quantitation of Yeast DNA Replication Proteins Using SILAC.Methods Mol Biol. 2023;2603:209-218. doi: 10.1007/978-1-0716-2863-8_17. Methods Mol Biol. 2023. PMID: 36370282
-
Rif1 inhibits replication fork progression and controls DNA copy number in Drosophila.Elife. 2018 Oct 2;7:e39140. doi: 10.7554/eLife.39140. Elife. 2018. PMID: 30277458 Free PMC article.
-
RecQL4 tethering on the pre-replicative complex induces unscheduled origin activation and replication stress in human cells.J Biol Chem. 2019 Nov 1;294(44):16255-16265. doi: 10.1074/jbc.RA119.009996. Epub 2019 Sep 13. J Biol Chem. 2019. PMID: 31519754 Free PMC article.
-
Towards the Mechanism of Yeast Telomere Dynamics.Trends Cell Biol. 2019 May;29(5):361-370. doi: 10.1016/j.tcb.2019.01.005. Epub 2019 Feb 11. Trends Cell Biol. 2019. PMID: 30765145 Free PMC article. Review.
-
Rif1 restrains the rate of replication origin firing in Xenopus laevis.Commun Biol. 2023 Jul 29;6(1):788. doi: 10.1038/s42003-023-05172-8. Commun Biol. 2023. PMID: 37516798 Free PMC article.
References
-
- Zegerman P (2015) Evolutionary conservation of the CDK targets in eukaryotic DNA replication initiation. Chromosoma 124: 309–321 - PubMed
-
- Diffley JF (2010) The many faces of redundancy in DNA replication control. Cold Spring Harb Symp Quant Biol 75: 135–142 - PubMed
-
- Mendez J, Zou‐Yang XH, Kim SY, Hidaka M, Tansey WP, Stillman B (2002) Human origin recognition complex large subunit is degraded by ubiquitin‐mediated proteolysis after initiation of DNA replication. Mol Cell 9: 481–491 - PubMed
MeSH terms
Substances
Grants and funding
LinkOut - more resources
Full Text Sources
Other Literature Sources
Miscellaneous
