. 2017 Mar 10;292(10):4371-4381.
doi: 10.1074/jbc.M116.762062. Epub 2017 Jan 11.

The Creatininase Homolog MftE from Mycobacterium smegmatis Catalyzes a Peptide Cleavage Reaction in the Biosynthesis of a Novel Ribosomally Synthesized Post-translationally Modified Peptide (RiPP)

Affiliations

The Creatininase Homolog MftE from Mycobacterium smegmatis Catalyzes a Peptide Cleavage Reaction in the Biosynthesis of a Novel Ribosomally Synthesized Post-translationally Modified Peptide (RiPP)

Nathan A Bruender et al. J Biol Chem. .

Abstract

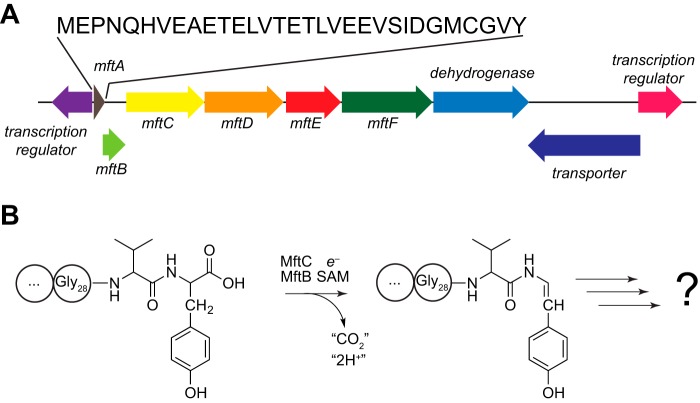
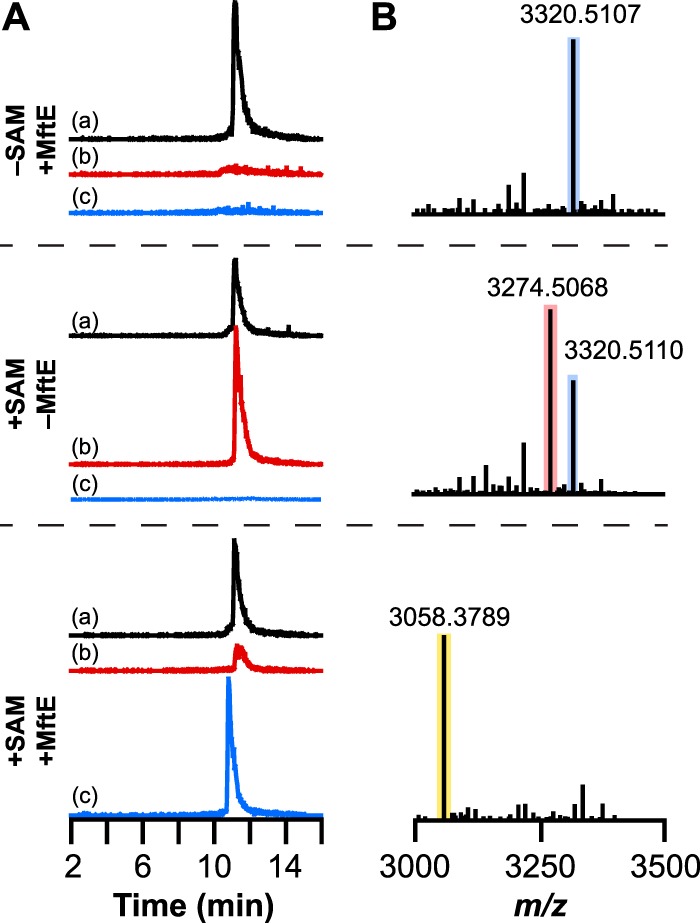
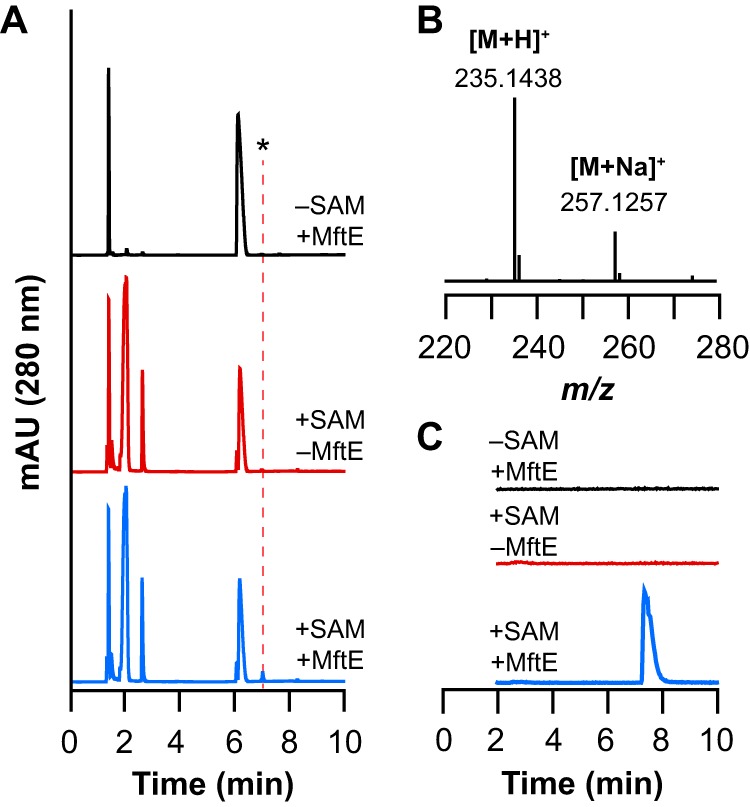
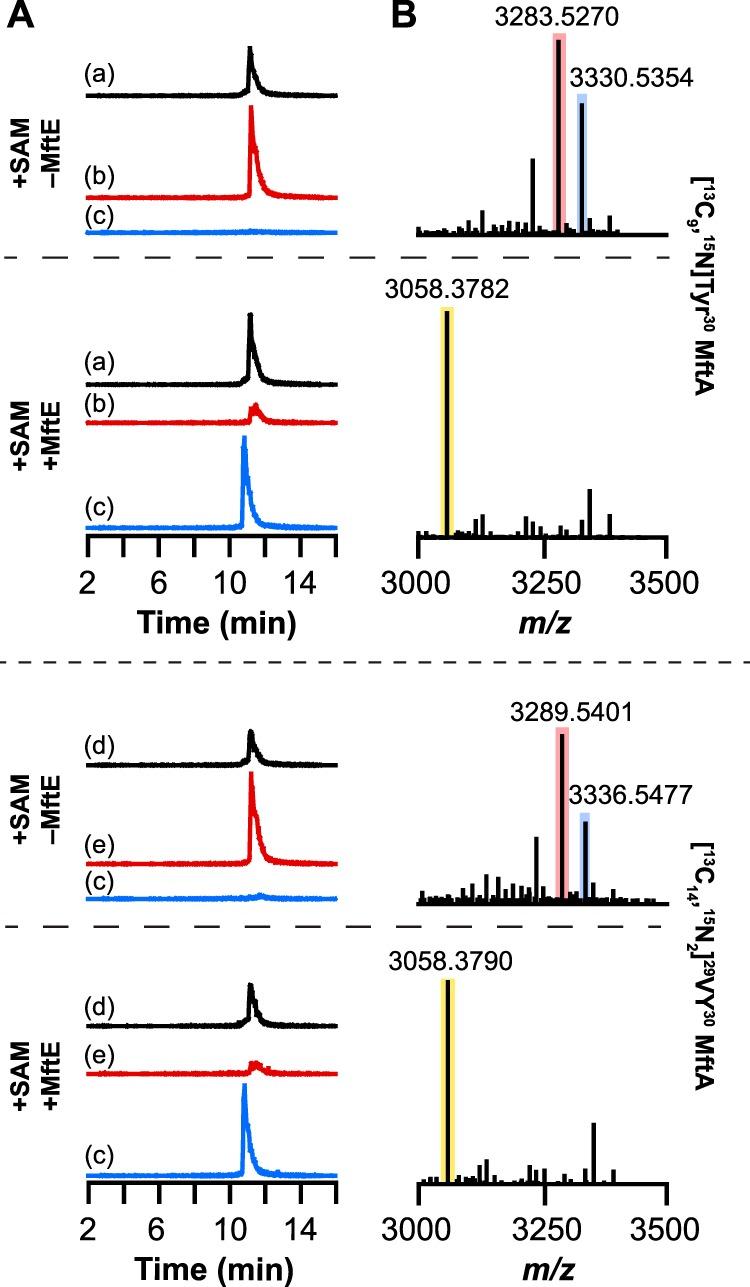
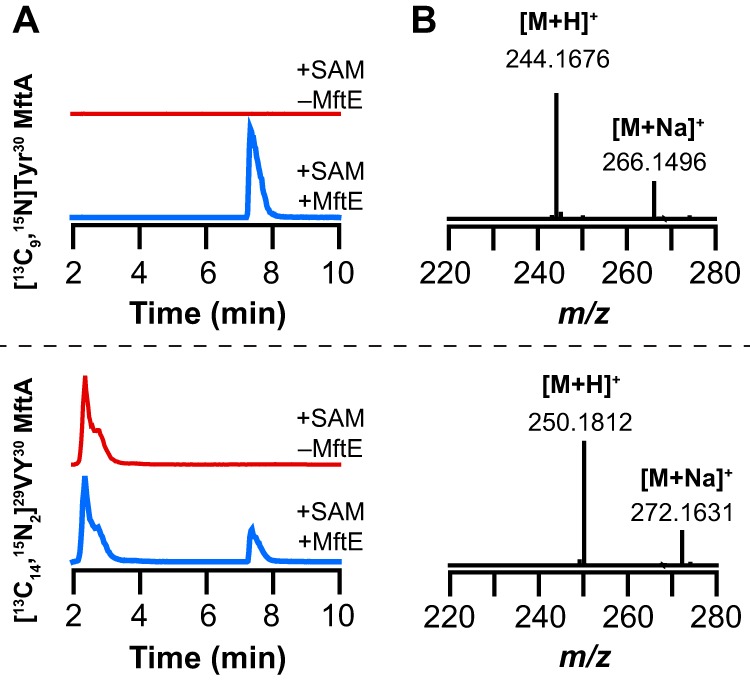
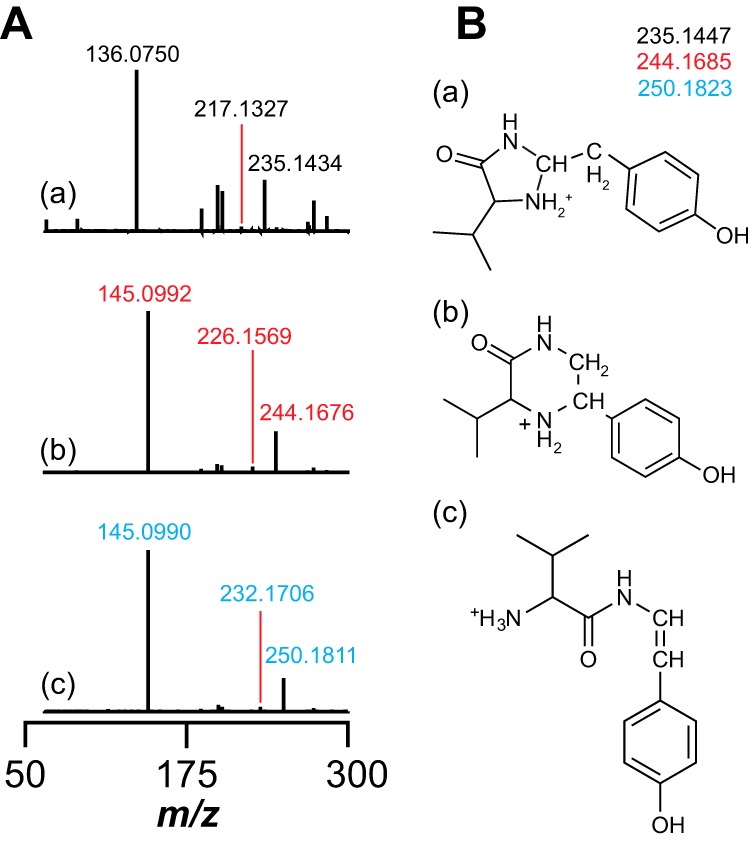
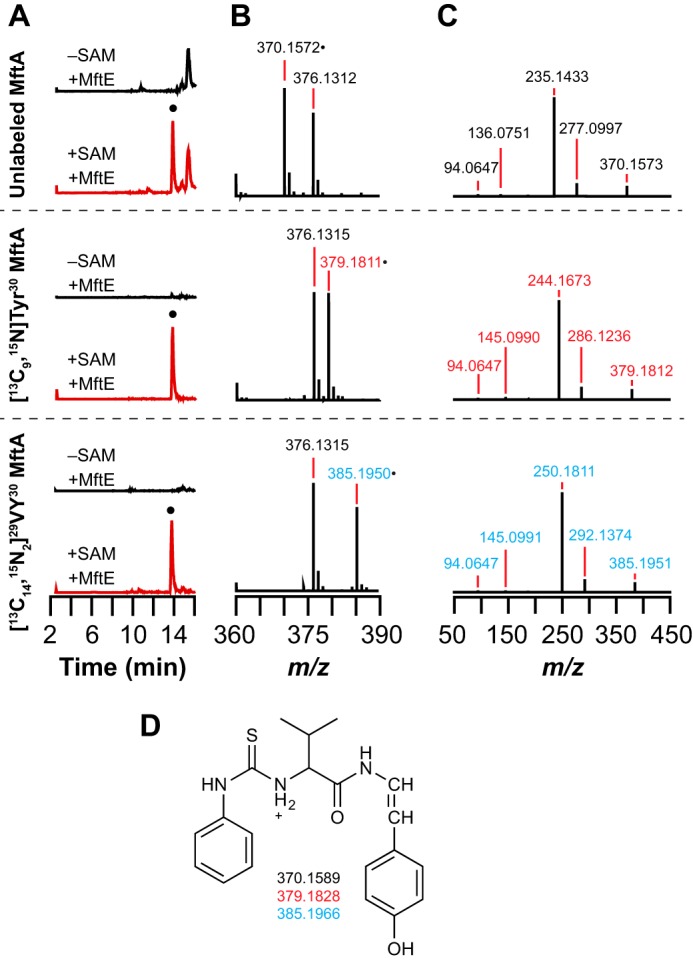
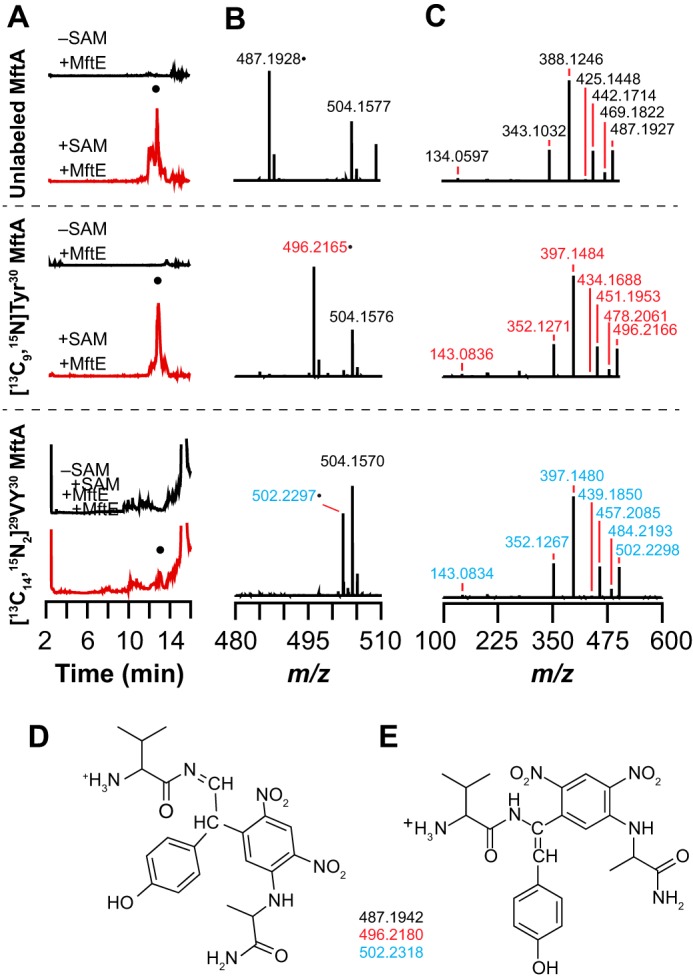
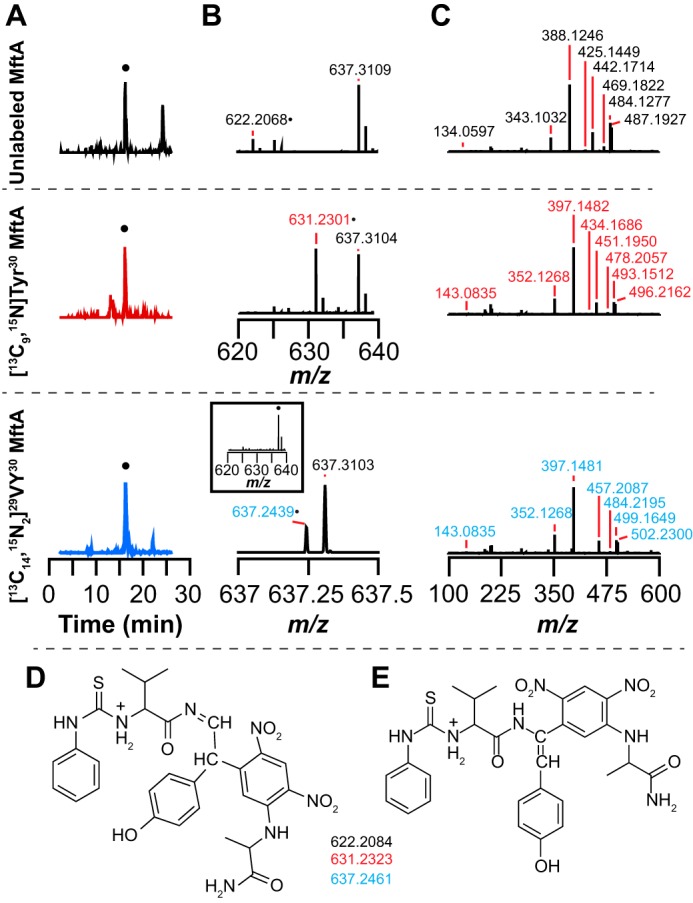
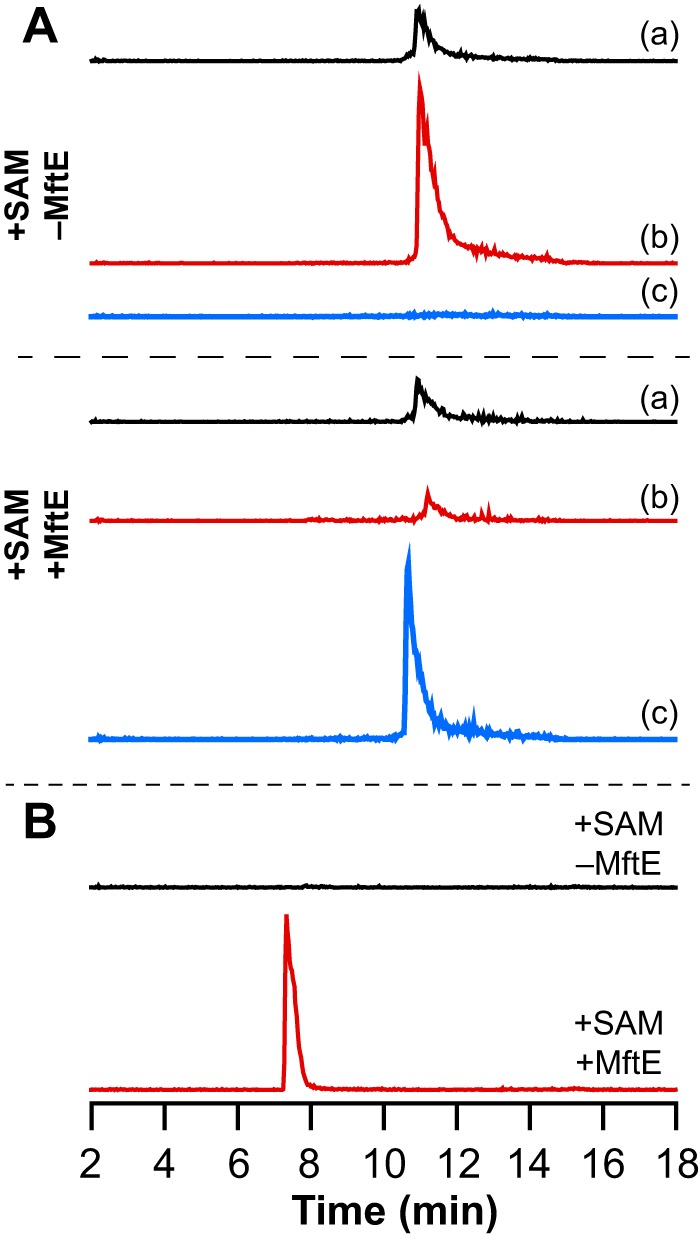
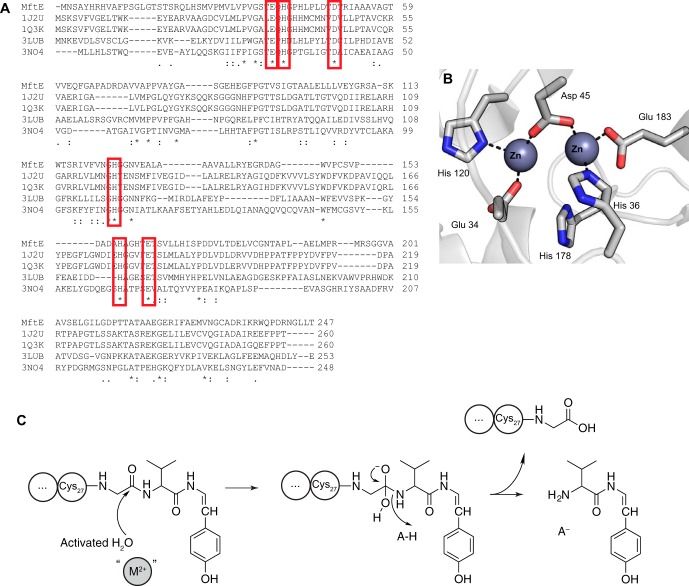
Most ribosomally synthesized and post-translationally modified peptide (RiPP) natural products are processed by tailoring enzymes to create complex natural products that are still recognizably peptide-based. However, some tailoring enzymes dismantle the peptide en route to synthesis of small molecules. A small molecule natural product of as yet unknown structure, mycofactocin, is thought to be synthesized in this way via the mft gene cluster found in many strains of mycobacteria. This cluster harbors at least six genes, which appear to be conserved across species. We have previously shown that one enzyme from this cluster, MftC, catalyzes the oxidative decarboxylation of the C-terminal Tyr of the substrate peptide MftA in a reaction that requires the MftB protein. Herein we show that mftE encodes a creatininase homolog that catalyzes cleavage of the oxidatively decarboxylated MftA peptide to liberate its final two residues, including the C-terminal decarboxylated Tyr (VY*). Unlike MftC, which requires MftB for function, MftE catalyzes the cleavage reaction in the absence of MftB. The identification of this novel metabolite, VY*, supports the notion that the mft cluster is involved in generating a small molecule from the MftA peptide. The ability to produce VY* from MftA by in vitro reconstitution of the activities of MftB, MftC, and MftE sets the stage for identification of the novel metabolite that results from the proteins encoded by the mft cluster.

Keywords: enzyme catalysis; enzyme mechanism; natural product biosynthesis; proteolytic enzyme; secondary metabolism.


Conflict of interest statement

The authors declare that they have no conflicts of interest with the contents of this article

Figures

FIGURE 1.
FIGURE 1.
The gene encoding MftE is clustered with those encoding MftA, MftB, and MftC in mycobacteria. A, cluster of genes near the mftA gene in M. smegmatis ATCC 700084. The mftA, mftB, and mftC encode the peptide substrate, accessory protein, and a member of the radical SAM superfamily, respectively. B, MftC catalyzes the oxidative decarboxylation of the MftA peptide in an MftB-dependent manner in the presence of SAM and a strong reductant, such as dithionite. MftE is shown to encode a peptidase in this study. The functions of the other conserved ORFs and the identity of the product derived from the mftA gene are not known.
FIGURE 2.
FIGURE 2.
UHPLC-MS analysis of MftA modification by MftE. A, extracted ion chromatograms corresponding to the +2 charge state of MftA peptide are shown. In control reactions, either SAM (−SAM +MftE) or MftE (+SAMMftE) was omitted. In each extracted ion chromatogram, a corresponds to unmodified MftA (m/z = 1660.5–1661.5), b corresponds to the oxidatively decarboxylated MftA (m/z = 1637.5–1638.5) resulting from the reaction of MftA with MftC in the presence of SAM and MftB, and c corresponds to a truncated MftA peptide that comprises Glu1–Gly28 (MftA(1–28)) (m/z = 1529.5–1530.5). B, the deconvoluted [M + H]+ mass spectra were generated from the full mass spectra in supplemental Fig. S1. These show the loss of 46.0042 atomic mass units upon action of MftB + MftC and 216.1279 atomic mass units after further modification of the oxidatively decarboxylated MftA by MftE. The blue, red, and yellow boxes correspond to unmodified MftA, oxidatively decarboxylated MftA, and MftA(1–28), respectively.
FIGURE 3.
FIGURE 3.
UHPLC-MS analysis of reactions monitoring for new product that corresponds to valine and oxidative decarboxylated tyrosine (VY*) dipeptide from reaction containing natural abundance MftA. A, UHPLC chromatogram monitoring at 280 nm for reactions containing both SAM and MftE (+SAM +MftE) or controls where either SAM (−SAM +MftE) or MftE (+SAMMftE) were omitted. The new peak indicated by the asterisk (*) that elutes at approximately 7.3 min is only observed in the +SAM +MftE reaction. B, mass spectrum averaged across the peak at approximately 7.8 min. The observed m/z of 235.1438 corresponds to the [M + H]+ of the VY* (theoretical m/z = 235.1447, 3.8 ppm error). The observed m/z of 257.1257 corresponds to the [M + Na]+ of the VY*. C, the extracted ion chromatogram monitoring m/z 234.5–235.5 corresponding to the theoretical m/z of the VY*. The new peak in the extracted ion chromatogram (at 7.8 min) is observed only in the presence of SAM and MftE. This species is not present in reactions where either SAM (−SAM +MftE) or MftE (+SAMMftE) is omitted. mAU, milliabsorbance units.
FIGURE 4.
FIGURE 4.
UHPLC-MS analysis of MftA peptide isolated from reactions containing either [13C9,15N]Tyr30 MftA or [13C14,15N2]29VY30 MftA. A, the extracted ion chromatograms of reactions in the presence or absence of MftE. The chromatograms correspond to the +2 charge state of unmodified [13C9,15N]Tyr30 MftA (m/z = 1665.5–1666.5) (a), oxidatively decarboxylated [13C9,15N]Tyr30 MftA (m/z = 1642–1643) (b), MftA(1–28) (m/z = 1529.5–1530.5) (c), unmodified [13C14,15N2]29VY30 MftA (m/z = 1668.5–1669.5) (d), and oxidatively decarboxylated [13C14,15N2]29VY30 MftA (m/z = 1645–1646) (e). B, the deconvoluted mass spectra generated from the corresponding full mass spectra shown in supplemental Fig. S3. Regardless of which isotopically enriched MftA peptide was used, the new species observed in the extracted ion chromatograms of reactions containing both SAM and MftE has the same mass as the new product observed with natural abundance MftA corresponding to MftA(1–28) shown in Fig. 2B. The blue, red, and yellow boxes correspond to unmodified MftA, oxidatively decarboxylated MftA, and MftA(1–28), respectively.
FIGURE 5.
FIGURE 5.
UHPLC-MS analysis of reactions monitoring for new product that corresponds to valine and oxidative decarboxylated tyrosine (VY*) dipeptide isolated from reactions containing either [13C9,15N]Tyr30 MftA or [13C14,15N2]29VY30 MftA. A, the extracted ion chromatograms monitoring for the VY* dipeptide isolated from reactions where MftE was omitted (+SAMMftE) or present (+SAM +MftE) when incubated with [13C9,15N]Tyr30 MftA (monitoring at m/z = 243.5–244.5) or [13C14,15N2]29VY30 MftA (monitoring at m/z = 249.5–250.5). B, the full mass spectra averaged over the peak in the extracted ion chromatogram that elutes at approximately 7.8 min in A. The observed [M + H]+ of 244.1676 is consistent with the VY* dipeptide containing eight 13C and one 15N atoms (theoretical m/z = 244.1685, 3.7 ppm error). The observed [M + H]+ of 250.1812 is consistent with the VY* dipeptide containing 13 13C and two 15N atoms (theoretical m/z = 250.1823, 4.4 ppm error).
FIGURE 6.
FIGURE 6.
A, MS/MS analysis of VY*. HCD MS/MS spectra of the VY* dipeptide isolated from reactions containing either unlabeled MftA (a), [13C9,15N]Tyr30 MftA (b), or [13C14,15N2]29VY30 MftA (c) are shown. The m/z of 136.0750 (a) and m/z of 145.0992 (b and c) correspond to natural abundance and 13C8,15N-enriched oxidatively decarboxylated tyrosine, respectively. The peaks with m/z of 217.1327 (a), m/z of 226.1569 (b), and m/z of 232.1706 (c) correspond to VY* dipeptide minus water with either no, 13C8,15N, or 13C13,15N2 isotopic enrichment. B, three possible structures of the VY* dipeptide consistent with the full mass spectra and HCD mass spectra data with the theoretical m/z corresponding to the natural abundance, 13C8,15N-, or 13C13,15N2-enriched product.
FIGURE 7.
FIGURE 7.
PITC derivatization of the VY* dipeptide isolated from reactions containing unlabeled MftA, [13C9,15N]Tyr30 MftA, or[13C14,15N2]29VY30 MftA. A, a new peak is observed in the extracted ion chromatograms that elutes at approximately 14 min when monitoring for the PITC-derivatized VY* dipeptide with either no (m/z = 369.8–370.8), 13C8,15N (m/z = 378.8–379.8), or 13C13,15N2 (m/z = 384.8–385.8) isotopic enrichment. The species denoted by ● that elutes at approximately 14 min is only observed in reactions containing MftE and SAM (+SAM +MftE) and is not observed in reactions lacking SAM (−SAM +MftE). B, full mass spectra of the species that elutes at approximately 14 min in the extracted ion chromatograms showing isotope-sensitive peaks for the [M + H]+ at m/z 376.1312, 379.1811, and 385.1950 with unlabeled MftA, [13C9,15N]Tyr30 MftA, or [13C14,15N2]29VY30 MftA. The species with an m/z of 376 is present in all of the samples and is a background peak. C, the isotope-sensitive [M + H]+ peaks in B were isolated and subjected to HCD fragmentation. Possible structures for the fragments are shown in supplemental Fig. S4. D, the proposed structure and corresponding theoretical masses of the PITC-derivatized VY* dipeptide based on the HCD fragmentation results with the natural abundance and isotopically enriched MftA peptides.
FIGURE 8.
FIGURE 8.
Marfey's reagent derivatization of the VY* dipeptide isolated from reactions containing natural abundance MftA, [13C9,15N]Tyr30 MftA, or [13C14,15N2]29VY30 MftA. A, a new species (●) is observed in the extracted ion chromatograms that elutes at approximately 13 min when monitoring for the Marfey's reagent-derivatized VY* dipeptide with either no (unlabeled) (m/z = 486.8–487.7), 13C8,15N (m/z = 495.8–496.8), or 13C13,15N2 (m/z = 501.8–502.8) isotopic enrichment. The peak at 13 min is only observed in reactions containing MftE and SAM (+SAM +MftE) and is not observed when SAM is removed (−SAM +MftE). B, full mass spectra of the species that elutes at approximately 13 min in the extracted ion chromatograms showing isotope-sensitive peaks for the [M + H]+ at m/z 487.1928, 496.2165, and 502.2297 with unlabeled MftA, [13C8,15N]Tyr30 MftA, or [13C13,15N2]29VY30 MftA. C, HCD fragmentation mass spectra of the [M + H]+ parent ion peak in the mass spectra shown in B. Possible structures for the fragments are shown in supplemental Fig. S5. D and E, the two possible structures and theoretical masses of the Marfey's reagent-derivatized VY* dipeptide based on the HCD fragmentation results with the natural abundance and isotopically enriched MftA peptides.
FIGURE 9.
FIGURE 9.
PITC and Marfey's reagent derivatization of the VY* dipeptide isolated from reactions containing natural abundance MftA, [13C9,15N]Tyr30 MftA, or [13C14,15N2]29VY30 MftA. A, a new peak (●) is observed at 16.5 min in the extracted ion chromatograms for PITC- and Marfey's reagent-derivatized VY* dipeptide at the expected m/z for unlabeled (m/z = 621.8–622.8), 13C8,15N (m/z = 630.8–631.8), or 13C13,15N2 (m/z = 636.8–637.8). B, zoomed in mass spectra of 16.5 min showing peaks at the expected m/z for unlabeled (370.1572), [13C8,15N]Tyr30 (379.1811), and [13C13,15N2]29VY30 (385.1950) MftA. A background peak at 637.310 is present in all samples and does not change upon isotopic substitution. C, HCD fragmentation mass spectra of the [M + H]+ parent ion peak in the mass spectra shown in B showing fragments consistent with the adduct. D and E, the two possible structures and theoretical masses of the PITC- and Marfey's reagent-derivatized VY* dipeptide showing the expected masses corresponding to the unlabeled (370.1589), [13C8,15N]Tyr30 (379.1828), and [13C13,15N2]29VY30 (385.1966). The theoretical m/z values are within 4.5 ppm of the experimentally determined values. The two structures differ in the regiochemistry of Marfey's reagent addition as discussed in the text.
FIGURE 10.
FIGURE 10.
MftB is not required for hydrolysis of the oxidatively decarboxylated MftA peptide to form the VY* by MftE. A, extracted ion chromatograms corresponding to the MftA peptide isolated from reactions where MftE was either omitted (+SAMMftE) or present (+SAM +MftE) after in situ generation of the oxidatively decarboxylated MftA peptide. Chromatogram a corresponds to unmodified MftA (m/z = 1660.5–1661.5), chromatogram b corresponds to oxidatively decarboxylated MftA (m/z = 1637.5–1638.5), and chromatogram c corresponds to MftA(1–28) (m/z = 1529.5–1530.5). Each peptide elutes at approximately 11 min when present. The MftA(1–28) peptide is only generated upon incubating the filtrate with MftE. B, extracted ion chromatogram corresponding to the VY* dipeptide (m/z = 234.5–235.5) shows that the VY* dipeptide is generated in the reaction containing MftE (+SAM +MftE) in the absence of MftB but not in the reaction where the MftE was omitted (+SAMMftE).
FIGURE 11.
FIGURE 11.
A, amino acid sequence alignments among MftE and creatininase homologs with known structures. Single, fully conserved residues are indicated with asterisk. Conservation between groups with strongly similar properties is indicated with a colon, and conservation between groups with weakly similar properties is indicated by a period. The red boxes highlight the His, Glu, and Asp residues that are conserved in MftE and map to residues that are structurally observed to coordinate the two divalent metals in the structures of the creatininase homologs (Protein Data Bank codes 1J2U, 1O3K, 3LUB, and 3NO4). B, active site of creatininase from Pseudomonas putida (Protein Data Bank code 1J2U) showing the six conserved residues highlighted in the sequence alignment (25). C, proposed catalytic mechanism of MftE based on the function of homologous creatininase enzymes. The results of ICP-MS are consistent with MftE requiring at least one divalent metal ion (M2+).

References

    1. Fischbach M. A., and Walsh C. T. (2006) Assembly-line enzymology for polyketide and nonribosomal peptide antibiotics: logic, machinery, and mechanisms. Chem. Rev. 106, 3468–3496 - PubMed
    1. Finking R., and Marahiel M. A. (2004) Biosynthesis of nonribosomal peptides. Annu. Rev. Microbiol. 58, 453–488 - PubMed
    1. Arnison P. G., Bibb M. J., Bierbaum G., Bowers A. A., Bugni T. S., Bulaj G., Camarero J. A., Campopiano D. J., Challis G. L., Clardy J., Cotter P. D., Craik D. J., Dawson M., Dittmann E., Donadio S., et al. (2013) Ribosomally synthesized and post-translationally modified peptide natural products: overview and recommendations for a universal nomenclature. Nat. Prod. Rep. 30, 108–160 - PMC - PubMed
    1. Ono K., Okajima T., Tani M., Kuroda S., Sun D., Davidson V. L., and Tanizawa K. (2006) Involvement of a putative [Fe-S]-cluster-binding protein in the biogenesis of quinohemoprotein amine dehydrogenase. J. Biol. Chem. 281, 13672–13684 - PubMed
    1. Nakai T., Ito H., Kobayashi K., Takahashi Y., Hori H., Tsubaki M., Tanizawa K., and Okajima T. (2015) The radical S-adenosyl-l-methionine enzyme QhpD catalyzes sequential formation of intra-protein sulfur-to-methylene carbon thioether bonds. J. Biol. Chem. 290, 11144–11166 - PMC - PubMed

Publication types

MeSH terms

LinkOut - more resources