. 2017 Feb 28;91(6):e02303-16.
doi: 10.1128/JVI.02303-16. Print 2017 Mar 15.

SUN2 Silencing Impairs CD4 T Cell Proliferation and Alters Sensitivity to HIV-1 Infection Independently of Cyclophilin A

Affiliations

SUN2 Silencing Impairs CD4 T Cell Proliferation and Alters Sensitivity to HIV-1 Infection Independently of Cyclophilin A

Daniel A Donahue et al. J Virol. .

Abstract

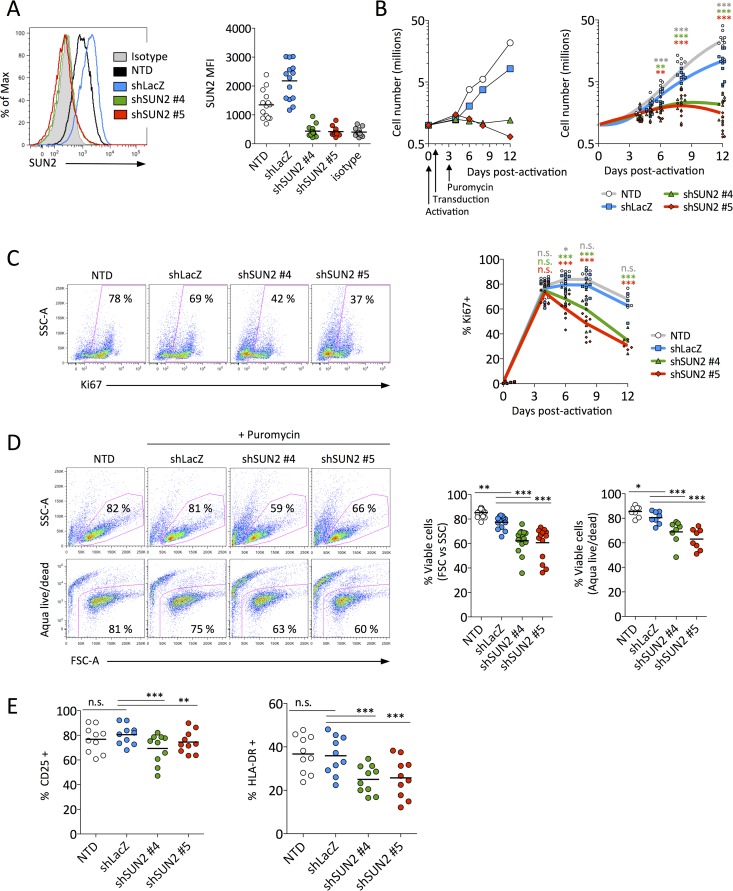
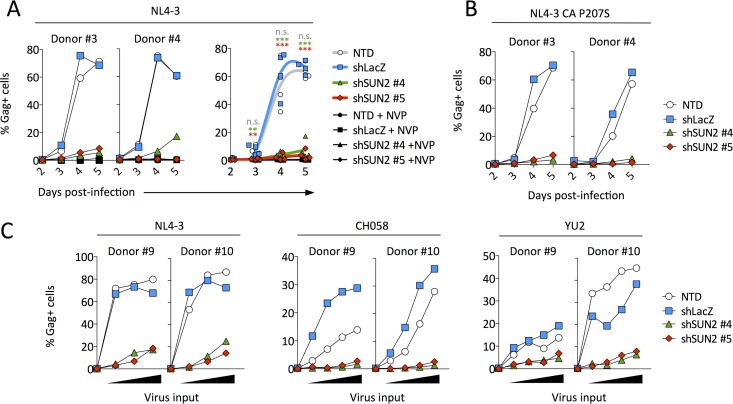
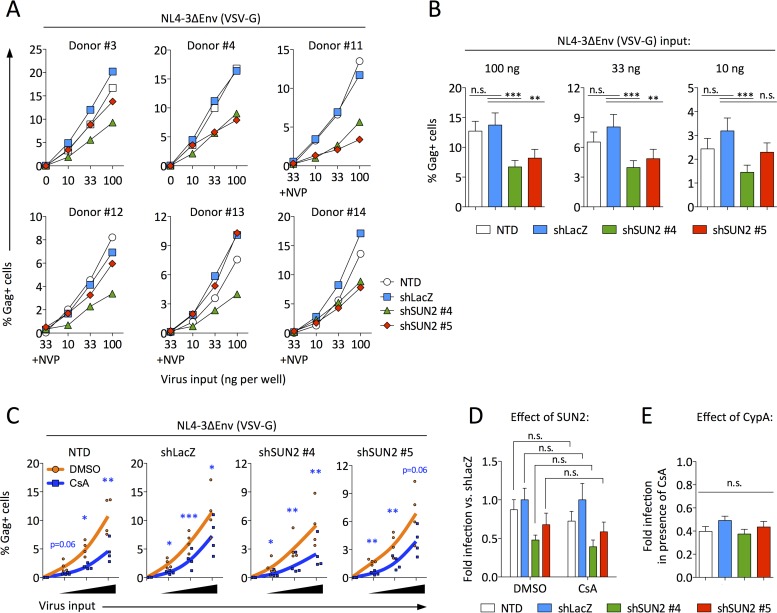
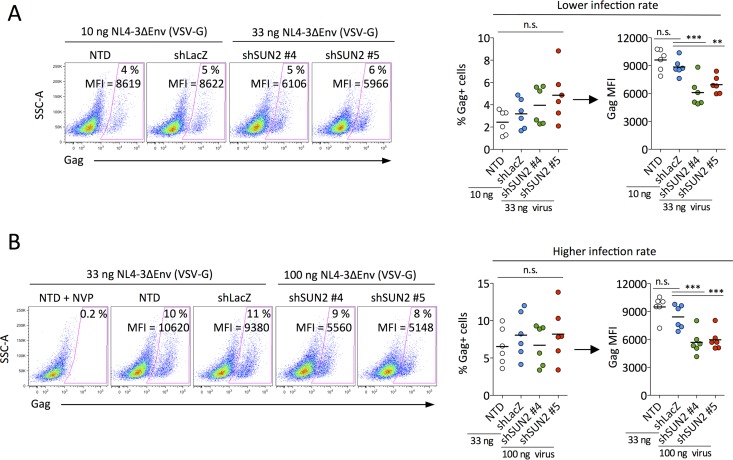
Linker of nucleoskeleton and cytoskeleton (LINC) complexes connect the nucleus to the cytoskeleton in eukaryotic cells. We previously reported that the overexpression of SUN2, an inner nuclear membrane protein and LINC complex component, inhibits HIV infection between the steps of reverse transcription and nuclear import in a capsid-specific manner. We also reported that SUN2 silencing does not modulate HIV infection in several cell lines. Silencing of SUN2 was recently reported to decrease HIV infection of CD4 T cells, an effect which was suggested to result from modulation of cyclophilin A (CypA)-dependent steps of HIV infection. We confirm here that HIV infection of primary CD4 T cells is compromised in the absence of endogenous SUN2, and we extend these findings to additional viral strains. However, we find that CypA is not required for the decreased infection observed in SUN2-silenced cells and, conversely, that endogenous SUN2 is not required for the well-documented positive modulation of HIV infection by CypA. In contrast, CD4 T cells lacking SUN2 exhibit a considerable defect in proliferative capacity and display reduced levels of activation markers and decreased viability. Additionally, SUN2-silenced CD4 T cells that become infected support reduced levels of viral protein expression. Our results demonstrate that SUN2 is required for the optimal activation and proliferation of primary CD4 T cells and suggest that the disruption of these processes explains the contribution of endogenous SUN2 to HIV infection in primary lymphocytes.IMPORTANCE Linker of nucleoskeleton and cytoskeleton (LINC) complexes connect the nucleus to the cytoskeleton. We previously reported that the overexpression of the LINC complex protein SUN2 inhibits HIV infection by targeting the viral capsid and blocking infection before the virus enters the nucleus. A recent report showed that the depletion of endogenous SUN2 in primary CD4 T cells results in decreased HIV infection and that this involves cyclophilin A (CypA), a host protein that interacts with the capsid of HIV to promote infection. We confirm that HIV infection is reduced in CD4 T cells lacking SUN2, but we find no role for CypA. Instead, SUN2 silencing results in CD4 T cells with decreased viability and much lower proliferation rates. Our results show that SUN2 is required for optimal CD4 T cell activation and proliferation and explain the reduced level of HIV infection in the absence of SUN2.

Keywords: CD4 T cell; SUN2; human immunodeficiency virus.


Figures

FIG 1
FIG 1
SUN2 silencing impairs CD4 T cell proliferation, activation, and viability. (A) Representative histograms of SUN2 levels in donor 4 at 5 days postransduction (left) and SUN2 levels (geometric MFI) in 14 donors at days 5 to 6 postransduction (right). (B) Proliferation of control or shSUN2-transduced CD4 T cells for representative donor 11 (left) and for 12 donors (right) relative to 1 million cells at the time of activation. (C) Percentage of cells expressing the proliferation marker Ki67 in representative donor 14 at 8 days postactivation (left) and kinetics of Ki67 expression in 8 donors (right). (D) Viability of control or shSUN2-transduced cells as measured by forward-scatter area (FSC-A) and side-scatter area (SSC-A) properties at day 5 postransduction or by using a fixable viability dye (Aqua Live/Dead) at day 6 postransduction in cells from representative donor 6 (left) or from 14 donors (FSC versus SSC) and 8 donors (Aqua Live/Dead) (right). (E) Activation status of cells from 10 donors as measured by surface levels of the intermediate activation marker CD25 (left) or the late activation marker HLA-DR (right). Note that subsequent experiments (Fig. 2 to 4) were performed using cells from the donors whose data are presented in this figure. In panels B to E, statistical analyses were performed using repeated-measures one-way analysis of variance with Dunnett's posttest to compare each condition to those for shLacZ-transduced cells. n.s., not significant.
FIG 2
FIG 2
Spreading HIV infection in SUN2-silenced CD4 T cells is greatly reduced. (A) Cells were infected overnight with 0.3 ng NL4-3 p24 per well, and the percentage of infected (Gag-positive [Gag+]) cells among the live-cell population was determined on days 2 to 5 postinfection. Results depict representative donors 3 and 4 (left) and the combined results for 4 donors (right). Statistical analysis was performed using repeated-measures one-way analysis of variance with Dunnett's posttest to compare each condition to those for shLacZ-transduced cells. n.s., not significant. (B) Infection of cells from donors 3 and 4, as described above for panel A, using the CA P207S mutant, which is resistant to overexpressed SUN2. (C) Infection of cells from donors 9 and 10 using a range of virus inputs for three different strains (1, 3, or 9 ng p24 per well for NL4-3; 1, 3, 9, or 18 ng p24 per well for CH058; and 1, 3, 9, or 27 ng p24 per well for YU2). Infection levels were measured on day 3 postinfection.
FIG 3
FIG 3
Single-round HIV infection in SUN2-silenced CD4 T cells is modestly reduced independently of CypA. (A) Cells from donors 3, 4, and 11 to 14 were infected by spinoculation using a range of virus inputs. The percentage of infected (Gag+) cells was determined at 48 h postinfection. (B) Combined results for the 6 donors from panel A. (C) Combined results from infection of cells from donors 11 to 14, as described above for panel A, in the presence of 0.02% DMSO or 2 μM CsA. Statistical analyses of data in panels B and C were performed using repeated-measures one-way analysis of variance with Dunnett's posttest to compare each condition to those for shLacZ-transduced cells. n.s., not significant. (D) From the data shown in panel C, the effect of SUN2 was determined by calculating the infection level under each condition relative to infection of shLacZ-transduced cells, for both DMSO and CsA treatments, where a value of <1 indicates that infection was inhibited compared to infection of control cells. For each donor, infection levels were calculated and averaged across all virus input levels. Statistical analyses were performed by unpaired two-tailed t tests. n.s., not significant. (E) From the data shown in panel C, the effect of CypA was determined by calculating the ratio of the percentage of Gag+ cells following CsA treatment to the percentage of Gag+ cells following DMSO treatment, where a value of <1 indicates that CsA inhibited infection. For each donor, ratios were calculated and averaged across all virus input levels. Statistical analysis was performed using one-way analysis of variance. n.s., not significant. In panels B, D, and E, error bars represent standard errors of the means.
FIG 4
FIG 4
SUN2-silenced CD4 T cells support reduced levels of viral gene expression. Shown is a comparison of the percentages of infected cells and levels of gene expression (Gag geometric MFI) at lower (A) and higher (B) rates of productive infection (nanograms of p24 per well used for single-round infection are indicated). Data for representative donor 4 are shown at the left, and the combined results for 6 donors are shown at the right. Gag MFI comparisons are between cell populations with equivalent percentages of infected cells. Statistical analyses were performed using repeated-measures one-way analysis of variance. Where significant differences were identified, Dunnett's posttest was used to compare each condition to those for shLacZ-transduced cells. n.s., not significant.

References

    1. Rothballer A, Kutay U. 2013. The diverse functional LINCs of the nuclear envelope to the cytoskeleton and chromatin. Chromosoma 122:415–429. doi:10.1007/s00412-013-0417-x. - DOI - PMC - PubMed
    1. Starr DA, Fridolfsson HN. 2010. Interactions between nuclei and the cytoskeleton are mediated by SUN-KASH nuclear-envelope bridges. Annu Rev Cell Dev Biol 26:421–444. doi:10.1146/annurev-cellbio-100109-104037. - DOI - PMC - PubMed
    1. Chang W, Worman HJ, Gundersen GG. 2015. Accessorizing and anchoring the LINC complex for multifunctionality. J Cell Biol 208:11–22. doi:10.1083/jcb.201409047. - DOI - PMC - PubMed
    1. Chen C-Y, Chi Y-H, Mutalif RA, Starost MF, Myers TG, Anderson SA, Stewart CL, Jeang K-T. 2012. Accumulation of the inner nuclear envelope protein Sun1 is pathogenic in progeric and dystrophic laminopathies. Cell 149:565–577. doi:10.1016/j.cell.2012.01.059. - DOI - PMC - PubMed
    1. Isermann P, Lammerding J. 2013. Nuclear mechanics and mechanotransduction in health and disease. Curr Biol 23:R1113–R1121. doi:10.1016/j.cub.2013.11.009. - DOI - PMC - PubMed

Publication types

MeSH terms

LinkOut - more resources