. 2017 Feb 28;91(6):e02515-16.
doi: 10.1128/JVI.02515-16. Print 2017 Mar 15.

Characterizing HIV-1 Splicing by Using Next-Generation Sequencing

Affiliations

Characterizing HIV-1 Splicing by Using Next-Generation Sequencing

Ann Emery et al. J Virol. .

Abstract

Full-length human immunodeficiency virus type 1 (HIV-1) RNA serves as the genome or as an mRNA, or this RNA undergoes splicing using four donors and 10 acceptors to create over 50 physiologically relevant transcripts in two size classes (1.8 kb and 4 kb). We developed an assay using Primer ID-tagged deep sequencing to quantify HIV-1 splicing. Using the lab strain NL4-3, we found that A5 (env/nef) is the most commonly used acceptor (about 50%) and A3 (tat) the least used (about 3%). Two small exons are made when a splice to acceptor A1 or A2 is followed by activation of donor D2 or D3, and the high-level use of D2 and D3 dramatically reduces the amount of vif and vpr transcripts. We observed distinct patterns of temperature sensitivity of splicing to acceptors A1 and A2. In addition, disruption of a conserved structure proximal to A1 caused a 10-fold reduction in all transcripts that utilized A1. Analysis of a panel of subtype B transmitted/founder viruses showed that splicing patterns are conserved, but with surprising variability of usage. A subtype C isolate was similar, while a simian immunodeficiency virus (SIV) isolate showed significant differences. We also observed transsplicing from a downstream donor on one transcript to an upstream acceptor on a different transcript, which we detected in 0.3% of 1.8-kb RNA reads. There were several examples of splicing suppression when the env intron was retained in the 4-kb size class. These results demonstrate the utility of this assay and identify new examples of HIV-1 splicing regulation. IMPORTANCE During HIV-1 replication, over 50 conserved spliced RNA variants are generated. The splicing assay described here uses new developments in deep-sequencing technology combined with Primer ID-tagged cDNA primers to efficiently quantify HIV-1 splicing at a depth that allows even low-frequency splice variants to be monitored. We have used this assay to examine several features of HIV-1 splicing and to identify new examples of different mechanisms of regulation of these splicing patterns. This splicing assay can be used to explore in detail how HIV-1 splicing is regulated and, with moderate throughput, could be used to screen for structural elements, small molecules, and host factors that alter these relatively conserved splicing patterns.

Keywords: HIV-1; RNA splicing; next-generation sequencing; primer ID; simian immunodeficiency virus.


Figures

FIG 1
FIG 1
HIV-1 splice patterns and primer locations. Blue, forward primer; red, 1.8-kb class Primer ID-tagged reverse primer; green, 4-kb class Primer ID-tagged reverse primer. Gray boxes are small exons or sequences that may or may not be present in the respective transcripts. Adapted from Purcell and Martin (2).
FIG 2
FIG 2
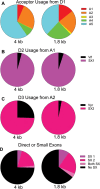
Quantification of HIV-1 splicing patterns. (A) Acceptor usage from D1 in the two size classes. Circles represent all transcripts in the size class. (B) Circles represent the total splices from D1 to A1. Shown are proportions that splice again at D2 and those that remain vif transcripts. (C) Circles represent the total splices to A2 and the proportions that splice again at D3 compared to those that remain vpr transcripts. (D) Circles represent all transcripts in the size class. Shown are proportions of transcripts that contain either one, both, or no small exons. SX1, small exon 1; SX2, small exon 2.
FIG 3
FIG 3
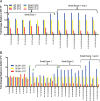
Temperature-dependent splicing regulation. Cells were infected with HIV-1 strain NL4-3, and after several days the culture was divided and placed at the indicated temperatures for the last 6 h. Whole-cell RNA was extracted and viral RNA assessed for splicing. The histogram shows the ratio of the percentage of each 1.8-kb transcript type relative to the 37°C sample (always at a 1:1 ratio with itself). Splice variants are grouped by direct splice to the final acceptor or small exon inclusion. Stars indicate splices to A1 that make vif transcripts or splices to A2 that make vpr. The x axis labels show the splice donors and acceptors used and the protein product of the transcript.
FIG 4
FIG 4
Effects of SLSA1 structural mutations on splicing. The y axis is a log scale of the fold change of splice type abundance of SLSA1 mutant relative to WT NL4-3; the x axis shows the pattern of splice donors and acceptors and the transcript type in the 4-kb and 1.8-kb class with that pattern. A missing bar indicates that the splice type did not occur in the SLSA1 mutant.
FIG 5
FIG 5
Combined effects of temperature and SLSA1 mutation. (A) The histogram shows the ratio of the percentage of each 1.8-kb transcript that utilizes A1 relative to the 37°C WT sample. (B) Ratio of the percentage of all 1.8-kb transcripts from SLSA1 mutant samples relative to the 37°C SLSA1 mutant sample.
FIG 6
FIG 6
Splicing in transmitted/founder viruses. (A) Ranges of A1, A2, and small exon usage in eight transmitted/founder viruses compared to NL4-3. SX1, small exon 1; SX2, small exon 2. NL4-3 samples are from three separate experiments; the red dot indicates the sample run in the transmitted/founder experiment. Results shown are for 1.8-kb transcripts. The red arrow indicates sample 42, which has a mutated D3 sequence. (B) vpr transcripts in transmitted/founder. (C to E) Usage of A3, A5, and A4 variants in transmitted/founder virus, 1.8-kb transcript class.
FIG 7
FIG 7
Cryptic acceptor usage as a percentage of major acceptor usage in transmitted/founder viruses and NL4-3. Transcripts with cryptic acceptor sites are shown as a percentage of noncryptic transcripts using the comparable major acceptor site with the same open reading frame. Cryptic acceptors in the gag-pro-pol (GPP) sequence are compared to total transcripts.
FIG 8
FIG 8
Quantification of splicing in subtype C strain pZM247Fv2. (A) Acceptor usage from D1 in the two size classes. Circles represent all transcripts in the size class. (B) Circles represent the total splices from D1 to A1. Shown are proportions that splice again at D2 and those that remain vif transcripts. (C) Circles represent the total splices to A2 and the proportions that splice again at D3 compared to those that remain vpr transcripts. (D) Circles represent all transcripts in size class. Shown are proportions of transcripts that contain either one, both, or no small exons. SX1, small exon 1; SX2, small exon 2.
FIG 9
FIG 9
SIVmac239 splice patterns and primer locations. Light blue, D0 forward primer; blue, D1 forward primer; red, 1.8-kb class Primer ID-tagged reverse primer; green, 4-kb class Primer ID-tagged reverse primer. Gray boxes are small exons or sequences that may or may not be present in the respective transcripts. The image is not drawn to scale, but relative locations are correct.
FIG 10
FIG 10
Quantification of splicing in SIVmac239. (A) Acceptor usage from D0 in the two size classes. Yellow represents the proportion of transcripts that splice from D0 to A0; black represents the proportion of transcripts that splice directly from D0 to an acceptor other than A0; orange represents the transcripts that do not splice from D0 to A0. (B) Acceptor usage from D1 in the two size classes. Circles represent all transcripts in the size class. (C) Circles represent the total splices from D1 to A1. Shown are proportions that splice again at D2 and those that remain vif transcripts. (D) Circles represent the total splices to A2 and the proportions that splice again at D3 compared to those that remain vpx transcripts. (E) Circles represent the total splices to A6411. Shown are proportions that splice again at D6551 compared to those that remain vpr transcripts. (F) Circles represent all transcripts in the size class. Shown are proportions of transcripts that contain any small exons compared to those that splice directly to the final acceptor.

References

    1. Stoltzfus CM. 2009. Chapter 1. Regulation of HIV-1 alternative RNA splicing and its role in virus replication. Adv Virus Res 74:1–40. doi:10.1016/S0065-3527(09)74001-1. - DOI - PubMed
    1. Purcell DF, Martin MA. 1993. Alternative splicing of human immunodeficiency virus type 1 mRNA modulates viral protein expression, replication, and infectivity. J Virol 67:6365–6378. - PMC - PubMed
    1. Ocwieja KE, Sherrill-Mix S, Mukherjee R, Custers-Allen R, David P, Brown M, Wang S, Link DR, Olson J, Travers K, Schadt E, Bushman FD. 2012. Dynamic regulation of HIV-1 mRNA populations analyzed by single-molecule enrichment and long-read sequencing. Nucleic Acids Res 40:10345–10355. doi:10.1093/nar/gks753. - DOI - PMC - PubMed
    1. Cullen BR, Greene WC. 1990. Functions of the auxiliary gene products of the human immunodeficiency virus type 1. Virology 178:1–5. doi:10.1016/0042-6822(90)90373-Y. - DOI - PubMed
    1. Fischer U, Huber J, Boelens WC, Mattaj IW, Luhrmann R. 1995. The HIV-1 Rev activation domain is a nuclear export signal that accesses an export pathway used by specific cellular RNAs. Cell 82:475–483. doi:10.1016/0092-8674(95)90436-0. - DOI - PubMed

Publication types