. 2017 Apr 1;117(4):1736-1748.
doi: 10.1152/jn.00630.2016. Epub 2017 Jan 11.

Spatial cognition in a virtual reality home-cage extension for freely moving rodents

Affiliations

Spatial cognition in a virtual reality home-cage extension for freely moving rodents

Ursula Kaupert et al. J Neurophysiol. .

Abstract

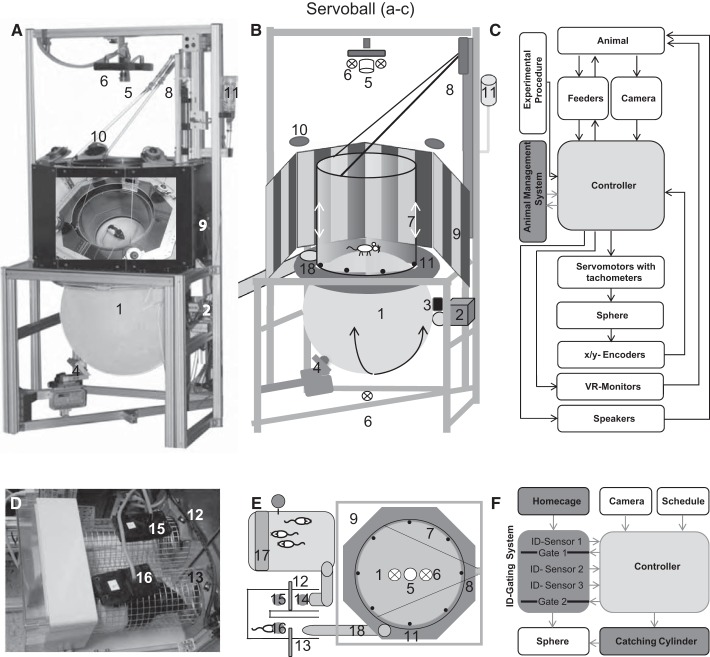
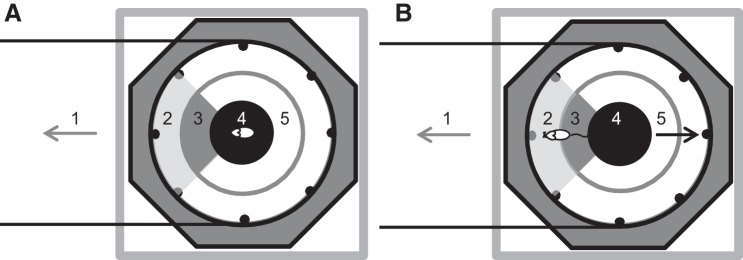
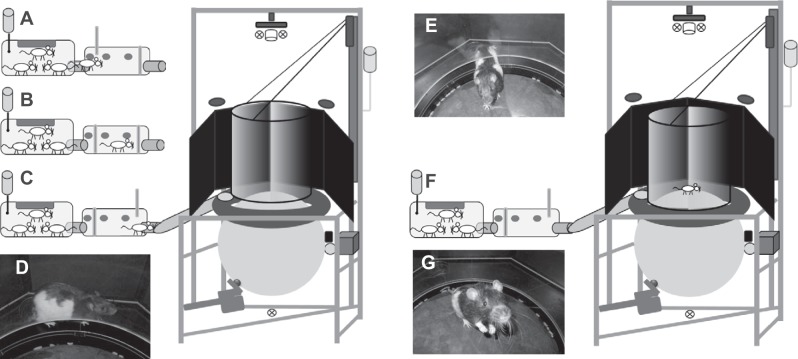
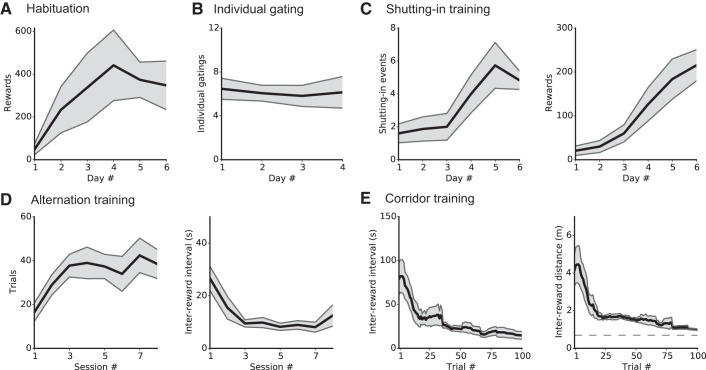
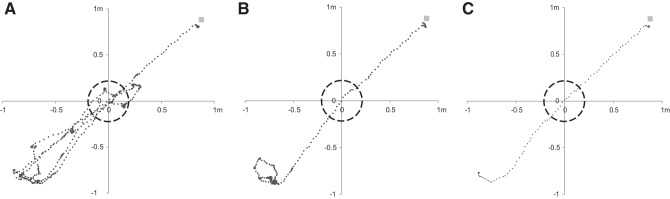
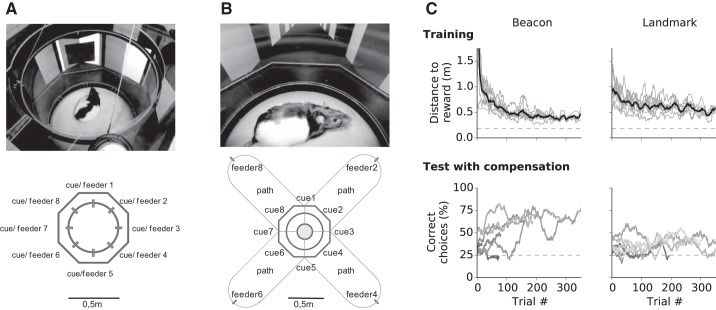
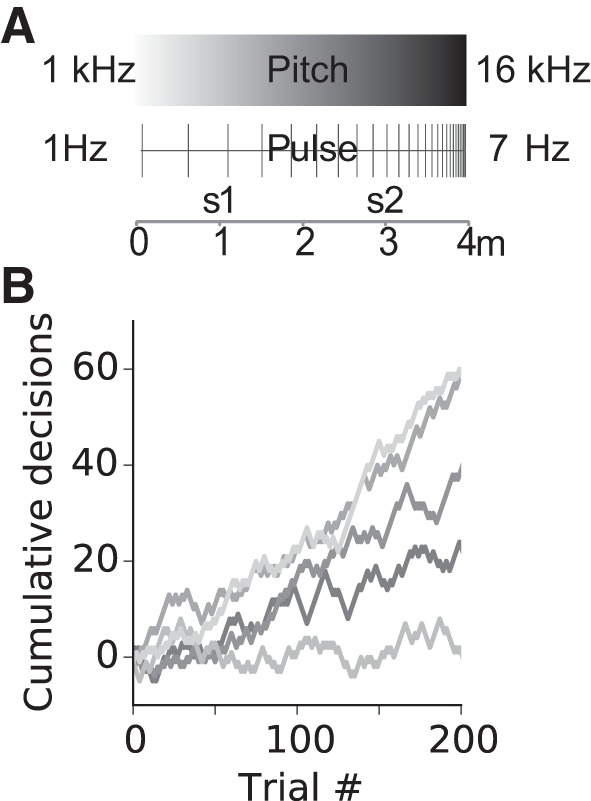
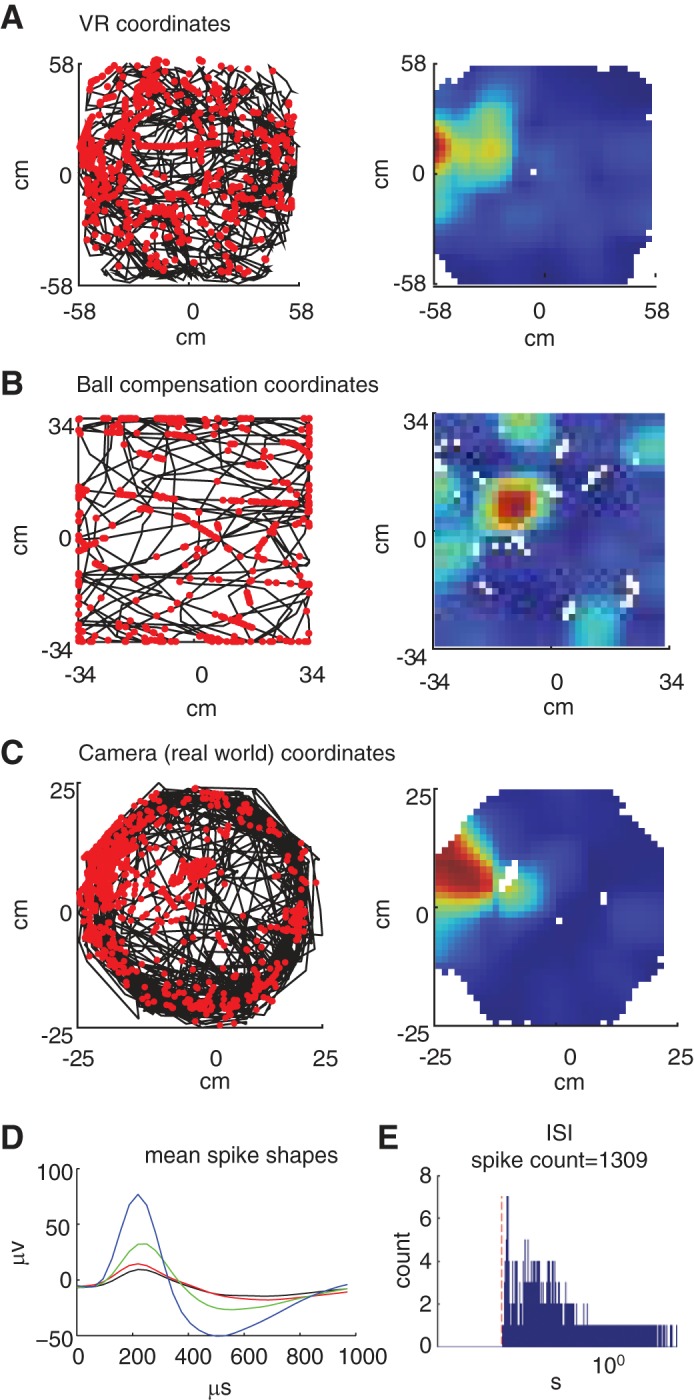
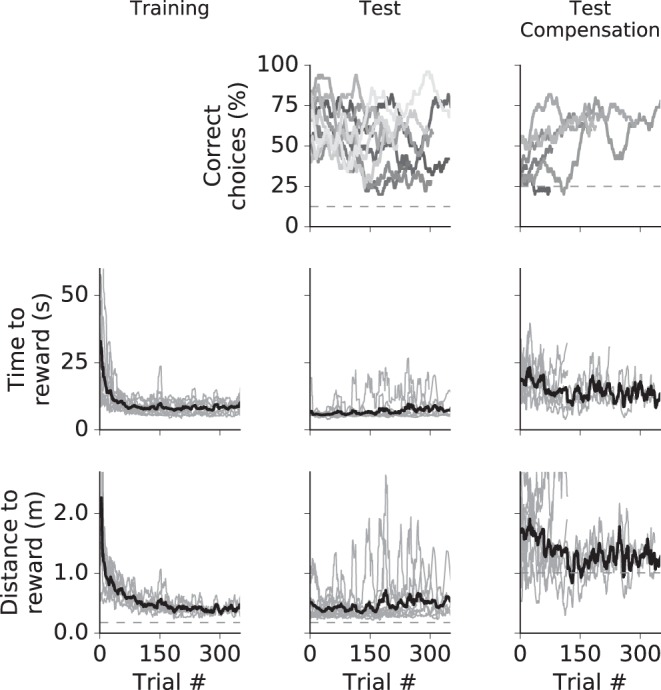
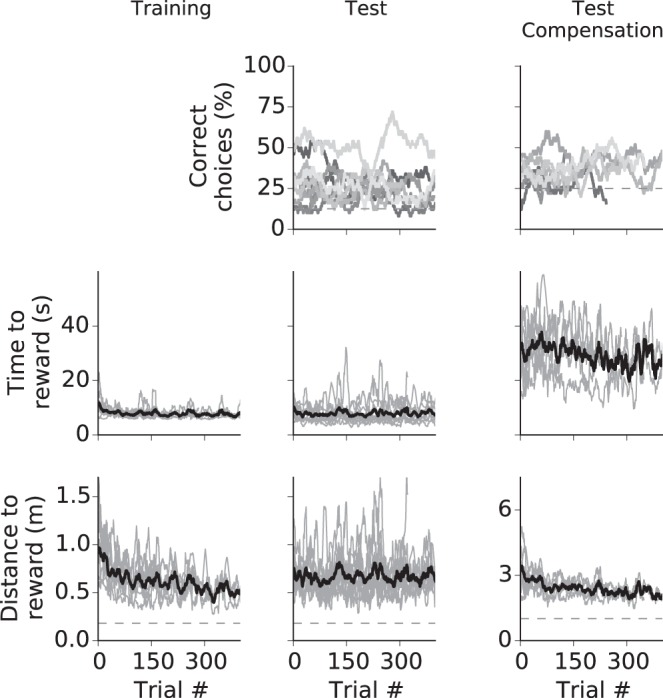
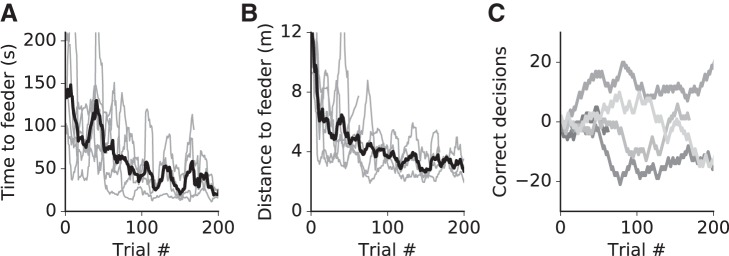
Virtual reality (VR) environments are a powerful tool to investigate brain mechanisms involved in the behavior of animals. With this technique, animals are usually head fixed or secured in a harness, and training for cognitively more complex VR paradigms is time consuming. A VR apparatus allowing free animal movement and the constant operator-independent training of tasks would enable many new applications. Key prospective usages include brain imaging of animal behavior when carrying a miniaturized mobile device such as a fluorescence microscope or an optetrode. Here, we introduce the Servoball, a spherical VR treadmill based on the closed-loop tracking of a freely moving animal and feedback counterrotation of the ball. Furthermore, we present the complete integration of this experimental system with the animals' group home cage, from which single individuals can voluntarily enter through a tunnel with radio-frequency identification (RFID)-automated access control and commence experiments. This automated animal sorter functions as a mechanical replacement of the experimenter. We automatically trained rats using visual or acoustic cues to solve spatial cognitive tasks and recorded spatially modulated entorhinal cells. When electrophysiological extracellular recordings from awake behaving rats were performed, head fixation can dramatically alter results, so that any complex behavior that requires head movement is impossible to achieve. We circumvented this problem with the use of the Servoball in open-field scenarios, as it allows the combination of open-field behavior with the recording of nerve cells, along with all the flexibility that a virtual environment brings. This integrated home cage with a VR arena experimental system permits highly efficient experimentation for complex cognitive experiments.NEW & NOTEWORTHY Virtual reality (VR) environments are a powerful tool for the investigation of brain mechanisms. We introduce the Servoball, a VR treadmill for freely moving rodents. The Servoball is integrated with the animals' group home cage. Single individuals voluntarily enter using automated access control. Training is highly time-efficient, even for cognitively complex VR paradigms.

Keywords: 24/7; freely moving; operator independent; spatial cognition; virtual reality.


Figures

Fig. 1.
Fig. 1.
Experimental apparatus and procedure. Photograph (A), schematic illustration (B), and functional diagram (C) of the Servoball setup. A 60-cm sphere (treadmill, 1) rests on a multidirectional roller system (2 and 4). The sphere is rotated by two orthogonal feedback-controlled position servos (2 and 3). The 2-dimensional position of the freely moving animal is sensed by infrared (6) high-speed video (5). Animal movement is restricted by a Perspex glass cylinder (7), which is moved up and down by a servomotor (8). VR is presented on eight peripheral TFT monitors (9). Four loudspeakers (10) are located above the cylinder. Retractable liquid feeders (11) are integrated beneath the cylinder. DF: animal management system: individual sorter (D), home cage with food supply (E, 17), sorter, Servoball arrangement (E) with functional diagram (F). 14–16: ID sensors; 12 and 13: gates; 18: tunnel giving access to the Servoball. See methods for a description of the individual gating procedure. A: the photograph placed on the backside of the monitor ring shows a view into the system with a rat. VR, virtual reality.
Fig. 2.
Fig. 2.
Schematic of compensation. Zoning of the experimental arena as used for the compensation algorithm. Top view of the setup with the octagonal structure of the TFT-screens, positions of feeders (black dots), and the cylinder surrounding the experimental arena. The animal is located at the right end of a virtual corridor that extends to the left (1). A: the rat is in the center of the inner circle (4) and the compensation mechanism is inactive. B: the rat has left the inner circle (4), crossed the acceleration zone (3), and entered the outer circle (2), where counterrotation of the sphere is set to the maximum of 0.31 m/s. Directions of movement are indicated by arrows representing the animal (gray arrow) and the ball (black arrow). Note that in the example given, the animal is located at the right end of a virtual corridor. Therefore, compensation is only activated when the animal enters the left quarter zone (marked in gray). In the remaining three quarters of the arena (5), compensation is inactivated, so that the animal can walk up to and touch the surrounding wall without initiating movement of the sphere. Black horizontal lines indicate the accessible zone of the path.
Fig. 3.
Fig. 3.
Sequence of the start of a typical experimental session. A: the group home cage with a single rat that has already passed reader 1 and gate 1 and entered the sorter. B: sorter gates are closed and the software ensures that only a single animal has entered. C: gate 2 has opened and the rat enters the tube to the Servoball arena. From the platform surrounding the sphere (D), the rat can enter the experimental arena (E) through the lifted cylinder. F: staying in the center of the experimental arena, the rat initializes the lowering process of the cylinder. G: rat shut in the arena with the cylinder moved downwards. For the description of a sequence of a typical experimental session, see text.
Fig. 4.
Fig. 4.
Duration of pretraining phases. AE: different functions of the Servoball home-cage system are successively activated. A: habituation of group-living rats to entering the Servoball VR arena and using the liquid feeders. Initially, all ID-sorter gates are open and the cylinder is permanently raised, giving all animals simultaneous access to the eight activated liquid reward feeders. Data show the number of rewards collected per individual during 24 h during the 6-day habituation phase. B: learning individual admission to the Servoball arena. After the ID-sorter function is activated, only single animals can access the Servoball arena from the home cage. Data show the number of passages through the ID-sorter and to the Servoball per individual and per 24-h period during the four days of this phase. C: habituation to becoming enclosed by the cylinder before receiving rewards. In this phase, feeders only become active after the cylinder has been lowered to shut in the rat. The cylinder moves downwards when the rat is in the center of the sphere. Left: individual shutting-in events; right: individual rewards per 24 h. D: alternation training. This training occurred within the stationary 49-cm Servoball arena without compensation. Data show successful individual trials per 10-min session (left) and time intervals between rewards (right). E: treadmill training with locomotion compensation activated. Alternation between the 2 ends of a corridor. Lines to the left and right show moving averages from 15 trials, and the gray area shows SE; n = 15 for A, B, and C; n = 8 for D and E. For calculation of the minimum distance in E, see the appendix.
Fig. 5.
Fig. 5.
Exemplary tracking paths. Exemplary tracking paths from a single session of one individual moving between the ends of a 2.0-m alley. The lines in AC are plotted in the VR coordinate system and show data from trials 1, 5, and 10. In the sessions before the trials shown here, the rat was exposed to a 1.4 m alley. The actual distances moved and durations of the trials were 10.1 m and t = 71 s (T1, A), 3.8 m and 25.5 s (T5, B), and 2.6 m and 10.7 s (T10, C). The dashed circle indicates the diameter of the Servoball arena (49 cm) in relation to the dimensions of the alley. During training, the length of the virtual alleys was successively extended (from 1.4 to 2.0 m) and the rats adapted to this quickly, usually during the first session after the implementation of a change. Gray square top right: target feeder.
Fig. 6.
Fig. 6.
Navigation with visual cues. Experimental design during training initially performed within the 49-cm arena without compensation (A) and during tests in a 4-arm radial maze (B) with 1-m arms and active compensation. C: during beacon experiments (left), the cue “hovered” in mid-air above the entry of an alley (cues 2, 4, 6, and 8); during landmark experiments, the landmark was located on the wall to the left of the correct alley (cues 1, 3, 5, and 7). The results from the beacon (left) and landmark (right) experiments show the progressive reduction in locomotion distance to reward during task acquisition (top) in the 49-cm arena and the performance during tests in treadmill mode in the four-arm radial maze (bottom). Individual data are in gray (a 50-trial moving average) and group means are in black. Note advanced liquid dispensers in A. Top left: n = 8; bottom left: n = 7; top right: n = 9; bottom right: n = 7. Dashed lines in C show minimum distance (top) and level for chance performance (bottom).
Fig. 7.
Fig. 7.
Navigation with acoustic cues. A: schematics of acoustic signal characteristics as they changed along a 4-m virtual corridor. In different experiments, either a frequency gradient or a pulse rate gradient was used. Trials commenced at the 1- or 3-m corridor location (s1 and s2). The visible virtual corridor was seemingly endless and absent visual cues indicating position. Positional information was contained in the frequency or pulse rate of the acoustic signal. From its starting location, the animal was required to move to the end of the closest corridor to obtain a reward. B: performance during pulse trials shown as cumulative correct (+1) or incorrect (−1) decisions for n = 5 animals. Line segments with positive slopes indicate phases with predominantly correct choices. Data are 50-trial moving averages. The four loudspeakers presented acoustic signals all with the same output.
Fig. 8.
Fig. 8.
Recording of neural activity in a cell of the entorhinal cortex. One 30-min trial in which the rat was running freely in the environment and collecting water rewards from one of the eight possible reward sites in the virtual environment. A, left: trajectory of the rat and spikes in the virtual environment; the black line represents the trajectory of the rat in the virtual environment. Each red dot marks the location of the rat when the cell fired a spike. A, right: rate maps of the trajectory and spikes. B, left: trajectory and spikes according to the compensation of the ball; the black line represents the rotation of the ball during the trial (Xcomp, Ycomp). Each red dot marks the degree of rotation of the ball when the cell fired a spike. Right: Rate maps of the trajectory and spikes. C, left: trajectory and spikes according to the 50-cm diameter cylinder (Xcam, Ycam). The black line represents the trajectory of the rat according to the cylinder (Xcam, Ycam). Each red dot marks the locations of the rat when the cell fired a spike. C, right: rate maps of the trajectory and spikes. D: mMean spike shape: The mean spike shapes of each electrode in recording tetrode (red, green, blue, and black). E: interspike interval (ISI) histogram: Histogram of the ISI of the spike train. The red dashed line marks the 2-ms interval (refractory period). The x (time)-axis is in logarithmic scale.
Fig. A1.
Fig. A1.
Beacon-based navigation. The columns show data for training, test phase, and test with compensation. Top: cumulative correct decisions for all animals (different animals may have performed different numbers of trials). Dashed line shows level of random choice. Middle: time to reward for all animals (light gray lines) and average (black line). Data from single animals are gliding averages with a 50-trial window. Bottom: distance to reward. Dashed line shows the minimum distance.
Fig. A2.
Fig. A2.
Landmark-based navigation. The columns show data for training, test phase and test with compensation. Top: cumulative correct decisions for all animals (different animals may have performed different numbers of trials). The dashed line shows the level of random choice. Middle: time to reward for all animals (light gray lines) and average (black line). Data from single animals are gliding averages with a 50-trial width. Bottom: distance to reward. Dashed line shows the minimum distance.
Fig. A3.
Fig. A3.
Navigation with acoustic cues (pitch experiment). Gray lines are time to feeder (A) and distance (B) to feeder for n = 5 animals, and a corresponding mean (black line) and standard error (gray area). Behavior became more directed within the first 100 trials, leading to a reduction of total locomotion distance and time to reach a feeder. Data from single animals are gliding averages with a 50-trial window. Different animals completed different numbers of trials. C: performance in (cumulative decisions, coded with + or −1, respectively) shows positive learning behavior for 1 individual.

References

    1. Aghajan ZM, Acharya L, Moore JJ, Cushman JD, Vuong C, Mehta MR. Impaired spatial selectivity and intact phase precession in two-dimensional virtual reality. Nat Neurosci 18: 121–128, 2015. doi:10.1038/nn.3884. - DOI - PubMed
    1. Anikeeva P, Andalman AS, Witten I, Warden M, Goshen I, Grosenick L, Gunaydin LA, Frank LM, Deisseroth K. Optetrode: a multichannel readout for optogenetic control in freely moving mice. Nat Neurosci 15: 163–170, 2011. doi:10.1038/nn.2992. - DOI - PMC - PubMed
    1. Aronov D, Tank DW. Engagement of neural circuits underlying 2D spatial navigation in a rodent virtual reality system. Neuron 84: 442–456, 2014. doi:10.1016/j.neuron.2014.08.042. - DOI - PMC - PubMed
    1. Bohil CJ, Alicea B, Biocca FA. Virtual reality in neuroscience research and therapy. Nat Rev Neurosci 12: 752–762, 2011. doi:10.1038/nrn3122. - DOI - PubMed
    1. Boyden ES, Zhang F, Bamberg E, Nagel G, Deisseroth K. Millisecond-timescale, genetically targeted optical control of neural activity. Nat Neurosci 8: 1263–1268, 2005. doi:10.1038/nn1525. - DOI - PubMed

Publication types

LinkOut - more resources