. 2017 Feb 22;37(8):1997-2009.
doi: 10.1523/JNEUROSCI.3163-16.2017. Epub 2017 Jan 11.

Climbing Fibers Control Purkinje Cell Representations of Behavior

Affiliations

Climbing Fibers Control Purkinje Cell Representations of Behavior

Martha L Streng et al. J Neurosci. .

Abstract

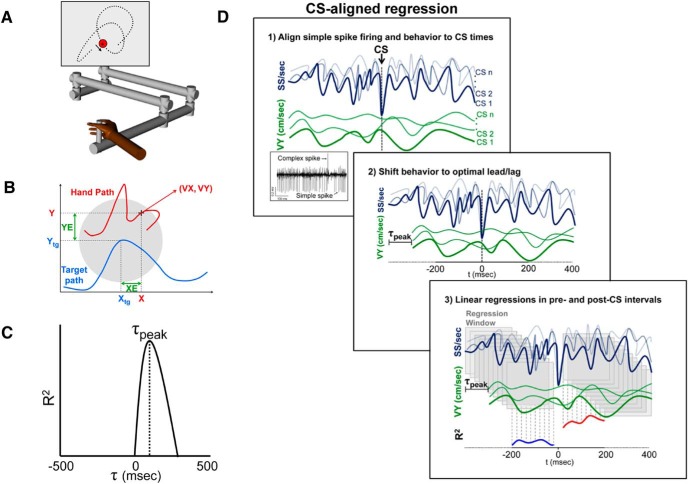
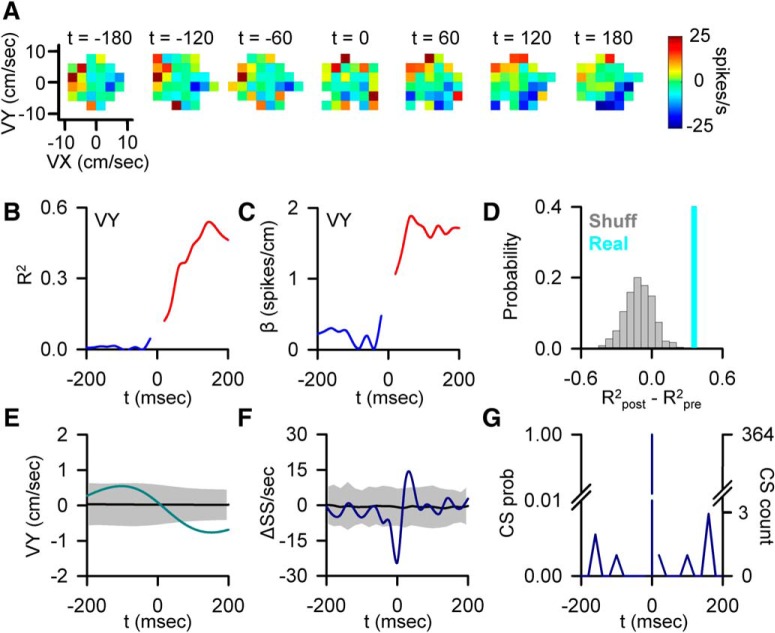
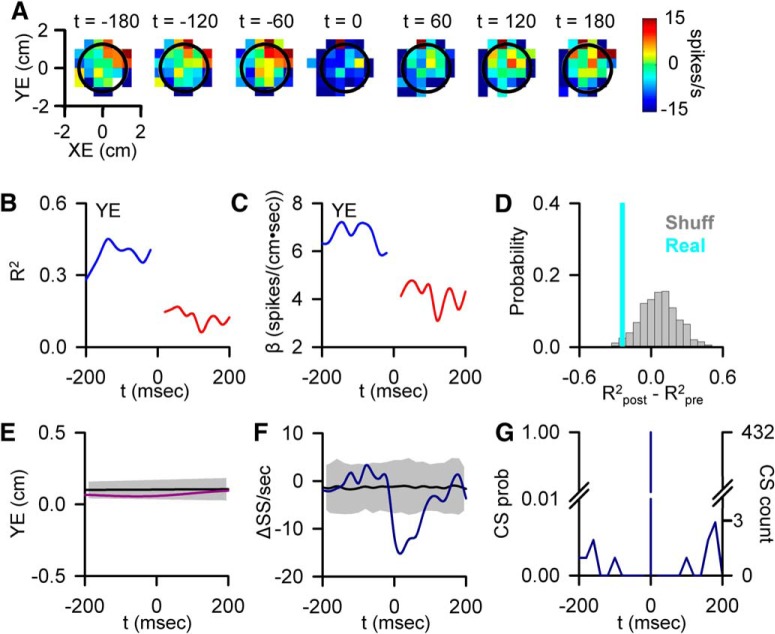
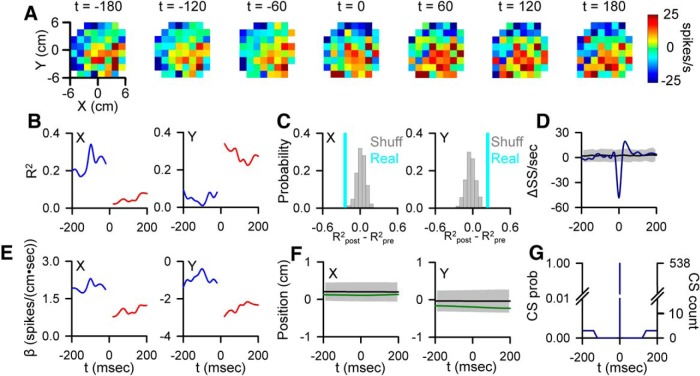
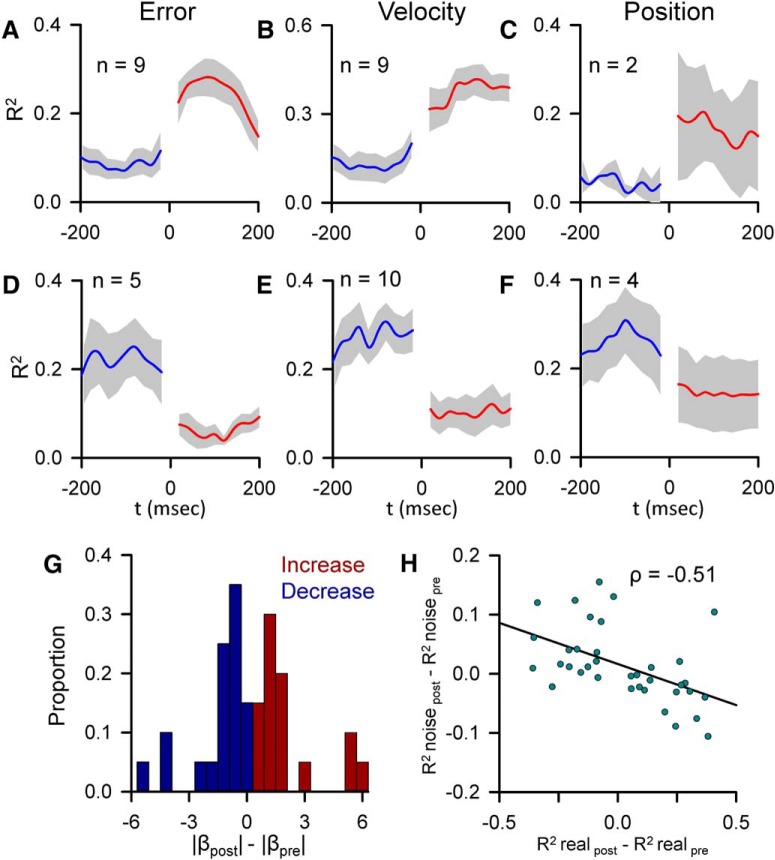
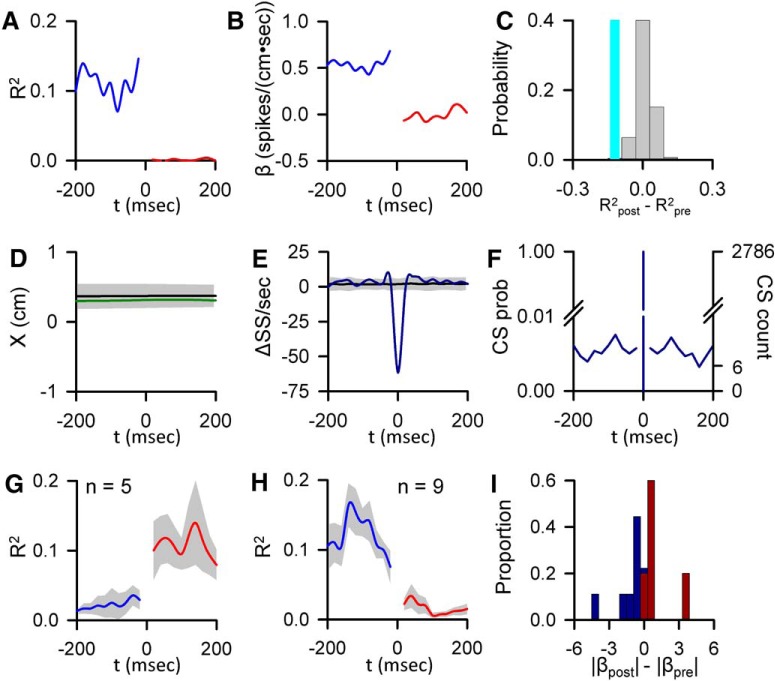
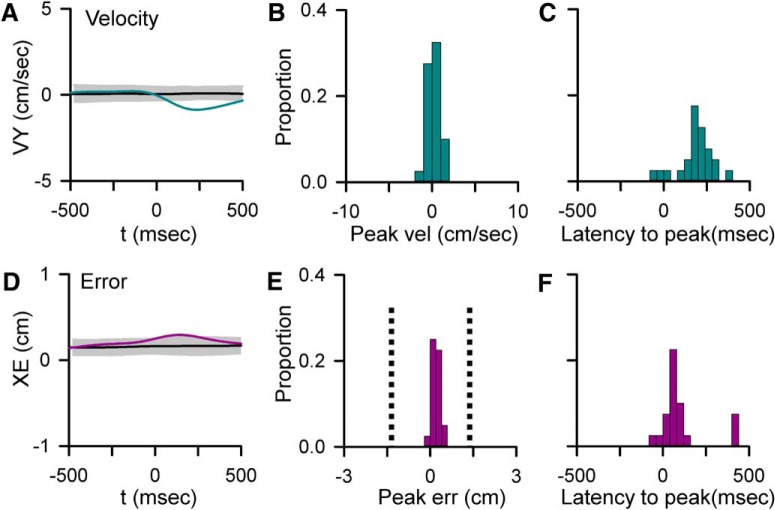
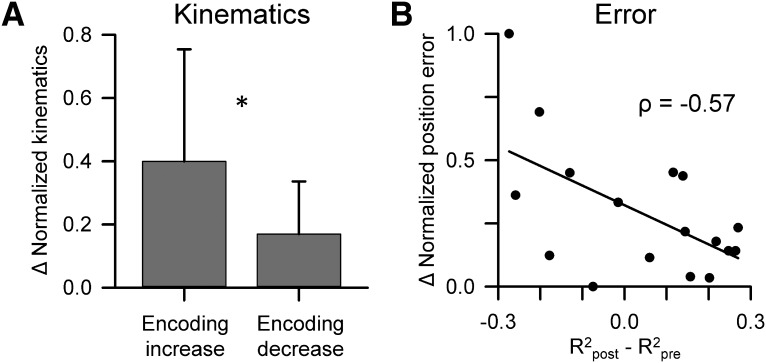
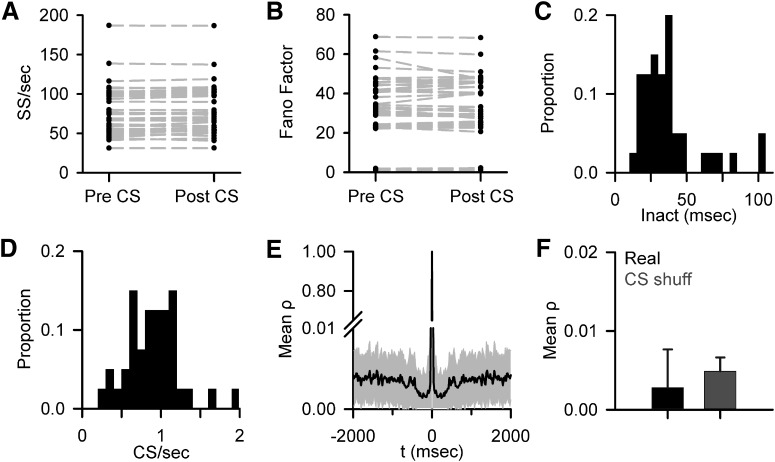
A crucial issue in understanding cerebellar function is the interaction between simple spike (SS) and complex spike (CS) discharge, the two fundamentally different activity modalities of Purkinje cells. Although several hypotheses have provided insights into the interaction, none fully explains or is completely consistent with the spectrum of experimental observations. Here, we show that during a pseudo-random manual tracking task in the monkey (Macaca mulatta), climbing fiber discharge dynamically controls the information present in the SS firing, triggering robust and rapid changes in the SS encoding of motor signals in 67% of Purkinje cells. The changes in encoding, tightly coupled to CS occurrences, consist of either increases or decreases in the SS sensitivity to kinematics or position errors and are not due to differences in SS firing rates or variability. Nor are the changes in sensitivity due to CS rhythmicity. In addition, the CS-coupled changes in encoding are not evoked by changes in kinematics or position errors. Instead, CS discharge most often leads alterations in behavior. Increases in SS encoding of a kinematic parameter are associated with larger changes in that parameter than are decreases in SS encoding. Increases in SS encoding of position error are followed by and scale with decreases in error. The results suggest a novel function of CSs, in which climbing fiber input dynamically controls the state of Purkinje cell SS encoding in advance of changes in behavior.SIGNIFICANCE STATEMENT Purkinje cells, the sole output of the cerebellar cortex, manifest two fundamentally different activity modalities, complex spike (CS) discharge and simple spike (SS) firing. Elucidating cerebellar function will require an understanding of the interactions, both short- and long-term, between CS and SS firing. This study shows that CSs dynamically control the information encoded in a Purkinje cell's SS activity by rapidly increasing or decreasing the SS sensitivity to kinematics and/or performance errors independent of firing rate. In many cases, the CS-coupled shift in SS encoding leads a change in behavior. These novel findings on the interaction between CS and SS firing provide for a new hypothesis in which climbing fiber input adjusts the encoding of SS information in advance of a change in behavior.

Keywords: Purkinje cell; cerebellar cortex; complex spike; motor control; simple spike.


Figures

Figure 1.
Figure 1.
Experimental paradigm and regression analysis. A, Rhesus macaques use a robotic manipulandum to control a cross-shaped cursor to track a circular target (2.5 cm diameter) on a computer screen (Paninski et al., 2004; Hewitt et al., 2011; Popa et al., 2012). B, Kinematic parameters (X, Y, VX, VY) are based on cursor motion (red trace). Position error (XE and YE) is the difference between cursor (X, Y) and target center position (Xtg, Ytg). C, Timing of SS signals encoding a parameter was based on the local maxima of the coefficient of determination (R2) profile determined using the temporal linear regression analysis described previously (Popa et al., 2012). D1, Effects of CS discharge on the SS encoding was assessed by aligning the SS firing (dark blue) and the parameter (green) to CS occurrences. D2, Behavior was then shifted by the peak lead or lag (τ-peak) obtained from the non–CS-aligned linear regression (C). D3, Linear regressions were performed 400 ms before and after CS discharge using a 20 ms step sliding window of 200 ms, generating pre (blue) and post (red) R2 profiles that quantify encoding strength.
Figure 2.
Figure 2.
CS-coupled increase in SS encoding. A, Firing maps illustrating an example of Purkinje cell SS modulation with velocity (VY) relative to CS discharge (t = 0). B, Encoding strength (R2) of VY both pre- (blue trace) and post-CS (red trace). C, Sensitivity (β) of the same Purkinje cell to VY both pre- (blue trace) and post-CS (red trace). D, Magnitude of the CS-coupled change in SS encoding strength as quantified by the difference between R2postR2pre in the ±200 ms window (indicated by the light blue line) relative to the distribution of changes in encoding strength aligned to randomized CS times selected outside the actual CS window (gray bars). Light blue line (in this and subsequent figures) indicates the magnitude of the change in encoding (position along the x-axis) and not a probability (y-axis). E, CS-triggered average of VY (light blue trace) relative to the VY variability from CS-shuffled ISIs (mean ± 3 SDs, gray region). F, CS-triggered average of SS firing (blue trace) relative to the SS variability from CS-shuffled ISIs (mean ± 3 SDs, gray region). Note the brief firing rate reduction (t = 0) due to CS inactivation of the SS discharge. G, Distribution of additional CSs in the −200 to 200 ms intervals centered on CS occurrence (left axis, CS probability; right axis, CS count).
Figure 3.
Figure 3.
CS-coupled decrease in SS encoding. A, Firing maps of another Purkinje cell with a change in SS modulation with position errors (YE) relative to CS occurrence (t = 0). Black circle represents target edge. B, Encoding strength (R2) of YE before (blue trace) and after (red trace) CS discharge. C, Sensitivity (β) of the cell to YE, before (blue trace) and after (red trace) CS discharge. D, Magnitude of the CS-coupled change in SS encoding strength in the ±200 ms window (indicated by the light blue line) relative to the distribution of profiles aligned to randomized CS times selected outside the actual CS window (gray bars). E, CS-triggered average of YE (purple trace) relative to the YE variability from CS-shuffled ISIs (mean ± 3 SDs, gray region). F, CS-triggered average SS firing (blue trace) relative to the SS variability from CS-shuffled ISIs (mean ± 3 SDs, gray region) showing SS inactivation following CSs. G, Distribution of additional CSs in the −200 to 200 ms intervals centered on CS occurrence (left axis, CS probability; right axis, CS count).
Figure 4.
Figure 4.
CS-coupled switch in SS encoding. A, Firing maps illustrating an example cell SS modulation with position relative to CS occurrence (t = 0). B, Pre- and post-CS encoding strength of X and Y (conventions as in Figs. 2, 3). C, Magnitude of the CS-coupled change in SS encoding of X (left) and Y (right) in the ±100 ms window (indicated by the light blue lines) relative to the distribution of profiles aligned to randomized CS times selected outside the actual CS window (gray bars). D, CS-triggered average of SS firing (blue trace) relative to the SS variability CS-shuffled ISIs (mean ± 3 SDs, gray region). E, Pre- and post-CS SS firing sensitivity for this cell to X (left) and Y (right) (conventions as in Figs. 2, 3). F, CS-triggered average of X (left, green trace) and Y (right) relative to the variability from CS-shuffled ISIs (mean ± 3 SDs, gray region). G, Occurrence of additional CSs in the ±200 ms window centered on CS discharge (left axis, CS probability; right axis, CS count).
Figure 5.
Figure 5.
Population summary of CS-coupled changes in encoding and sensitivity. A–F, Mean of the pre- and post-CS R2 profiles for each parameter with a significant CS-coupled encoding change (blue represents pre-CS; red represents post-CS) ± SEM (gray areas). Increases and decreases in encoding are grouped separately. n indicates the number of profiles. G, Population distribution of changes in SS sensitivity with significant CS-coupled changes in encoding (blue bars represent encoding decreases; red bars represent encoding increases). Proportions for increases and decreases were computed separately. H, Distribution of the magnitude of CS-coupled encoding changes versus mean magnitude of encoding changes not associated with CS firing for all significant CS-coupled encoding changes across the population (n = 40). The Pearson correlation coefficient is included. Line indicates the significant trend of the distribution (p = 0.003).
Figure 6.
Figure 6.
CS-coupled changes in encoding of parameters not initially determined to be significant. A, Encoding strength (R2) of X position before (blue trace) and after (red trace) CS occurrence for an example Purkinje cell. B, Sensitivity (β) of same cell to X, before (blue trace) and after (red trace) CS discharge. C, Magnitude of the CS-coupled change in SS encoding strength in the ±200 ms window (indicated by the light blue bar) relative to the distribution of profiles aligned to randomized CS times selected outside the real CS (gray bars). D, CS-triggered average of X (green trace) relative to the X variability from CS-shuffled ISIs (mean ± 3 SDs, gray region). E, CS-triggered average SS firing (blue trace) relative to the SS variability from CS-shuffled ISIs (mean ± 3 SDs, gray region). F, Distribution of additional CSs in the −200 to 200 ms intervals centered on CS occurrences (left axis, CS probability; right axis, CS count). G, H, Mean of R2 profiles showing significant CS-coupled increases (G) and decreases (H) in encoding (mean ± SEM) with the number of profiles denoted by n. I, Population distribution of changes in SS sensitivity to for these parameters with significant CS-coupled changes in encoding (blue bars represent encoding decreases; red bars represent encoding increases).
Figure 7.
Figure 7.
Relationships between CS firing and behavior. A, D, Examples of significant CS-coupled changes in VY (A, blue trace) and XE (D, purple trace) as determined by comparison with mean CS-shuffled control (black trace) ±3 SDs (gray region). B, E, Distributions of peak changes in velocity (B) and error (E) in the 22 Purkinje cells with significant CS-coupled changes in behavior. E, Vertical dashed line indicates the target edge. C, F, Timing of peak changes in velocity (C) and error (F) illustrating that behavioral changes lag CSs.
Figure 8.
Figure 8.
CS-coupled changes in SS encoding are associated with modulation of behavior. A, Mean ± SD normalized changes in the kinematic parameters (meanpost − meanpre) for significant CS-coupled increases and decreases in SS encoding. *p < 0.05 (unpaired Student's t test). B, Distribution of all normalized changes in the position error parameters (meanpost − meanpre) with the magnitude of significant CS-coupled changes in SS encoding. The Pearson correlation coefficient is included and the line depicts the significant trend of the distribution (p = 0.017).
Figure 9.
Figure 9.
No evidence for CS-associated changes in SS firing properties or CS rhythmicity. A, Mean SS firing before and after CS discharge based on the 200 ms pre-CS and 200 ms post-CS windows (mean ± SD of the inactivation period) for 39 of 40 recorded Purkinje cells. As described in Materials and Methods, one cell was excluded due to high SS variability following the CS; however, this cell did not have significant SS encoding changes. B, Mean Fano factor pre- and post-CS using the same window in A for 39 of 40 recorded Purkinje cells. C, Distribution of mean SS inactivation periods after CS discharge (Inact) for all 40 Purkinje cells. D, Histogram of mean CS firing rate for all 40 Purkinje cells. E, Population average of CS discharge autocorrelation (mean ± SD). Note the discontinuous y-axis. F, Average maximum autocorrelation in the 8–12 Hz range for CS firing (Real) and randomly shuffled control data (CS shuff). Error bars indicate SD.

References

    1. Albus JS. (1971) A theory of cerebellar function. Math Biosci 10:25–61. 10.1016/0025-5564(71)90051-4 - DOI
    1. Badura A, Schonewille M, Voges K, Galliano E, Renier N, Gao Z, Witter L, Hoebeek FE, Chédotal A, De Zeeuw CI (2013) Climbing fiber input shapes reciprocity of Purkinje cell firing. Neuron 78:700–713. 10.1016/j.neuron.2013.03.018 - DOI - PubMed
    1. Bazzigaluppi P, De Gruijl JR, van der Giessen RS, Khosrovani S, De Zeeuw CI, de Jeu MT (2012) Olivary subthreshold oscillations and burst activity revisited. Front Neural Circuits 6:91. 10.3389/fncir.2012.00091 - DOI - PMC - PubMed
    1. Bouvier G, Clopath C, Bimbard C, Nadal JP, Brunel N, Hakim V, Barbour B (2016) Cerebellar learning using perturbations. bioRxiv 10.1101/053785 - DOI - PMC - PubMed
    1. Brenowitz SD, Regehr WG (2003) Calcium dependence of retrograde inhibition by endocannabinoids at synapses onto Purkinje cells. J Neurosci 23:6373–6384. - PMC - PubMed

Publication types

LinkOut - more resources