

Folding of apomyoglobin: Analysis of transient intermediate structure during refolding using quick hydrogen deuterium exchange and NMR
- PMID: 28077807
- PMCID: PMC5406622
- DOI: 10.2183/pjab.93.002
Folding of apomyoglobin: Analysis of transient intermediate structure during refolding using quick hydrogen deuterium exchange and NMR
Abstract
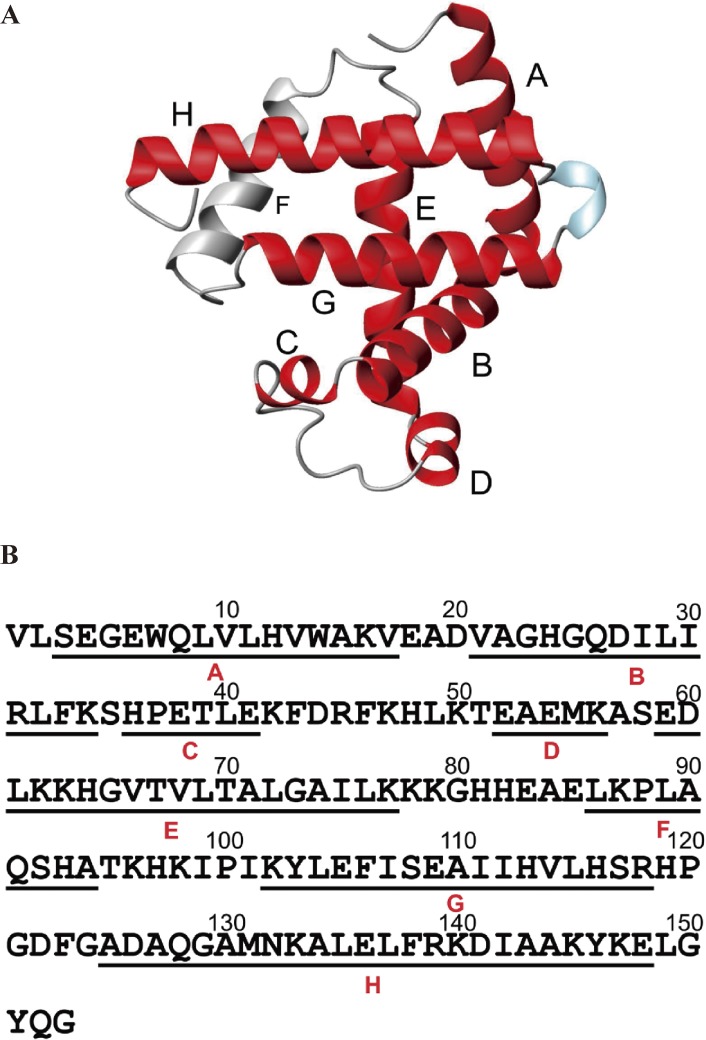
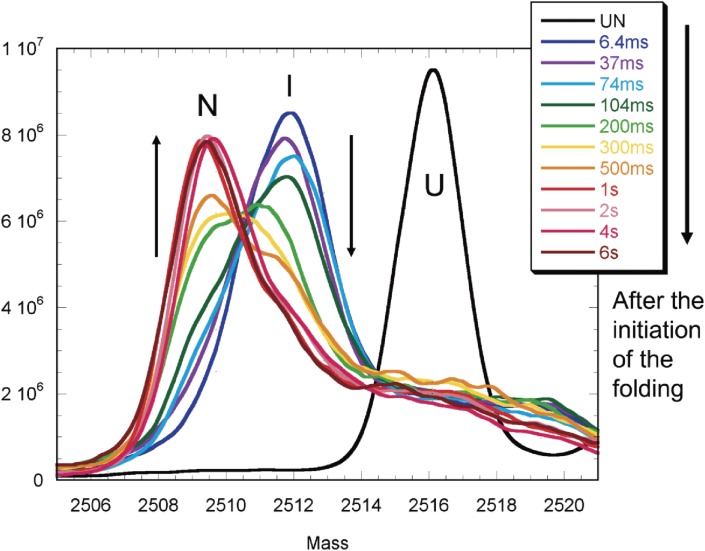
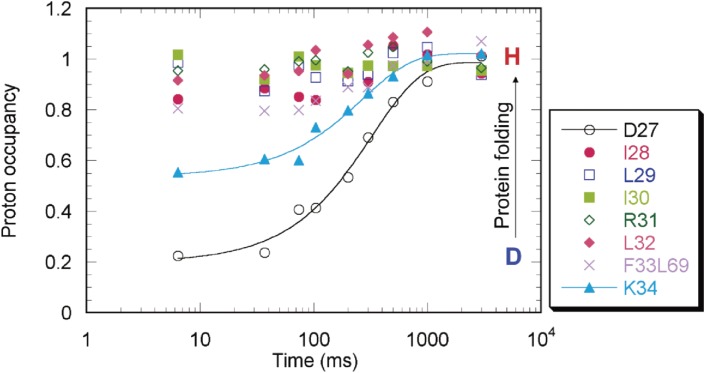
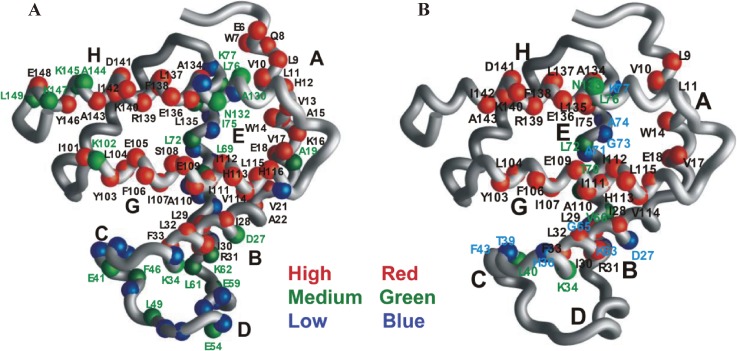
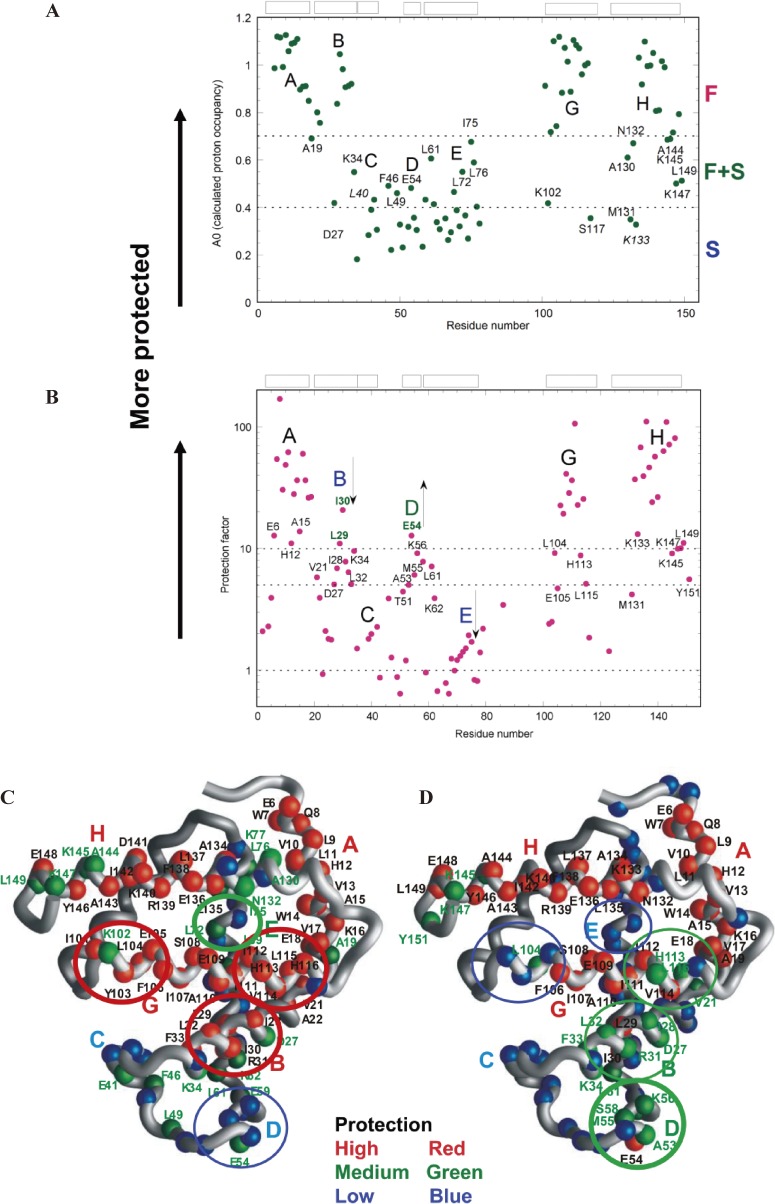
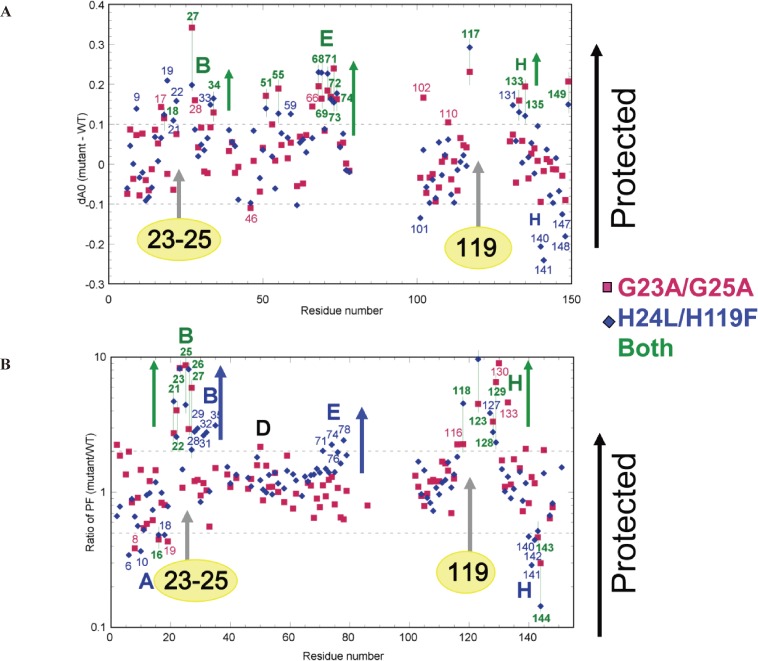
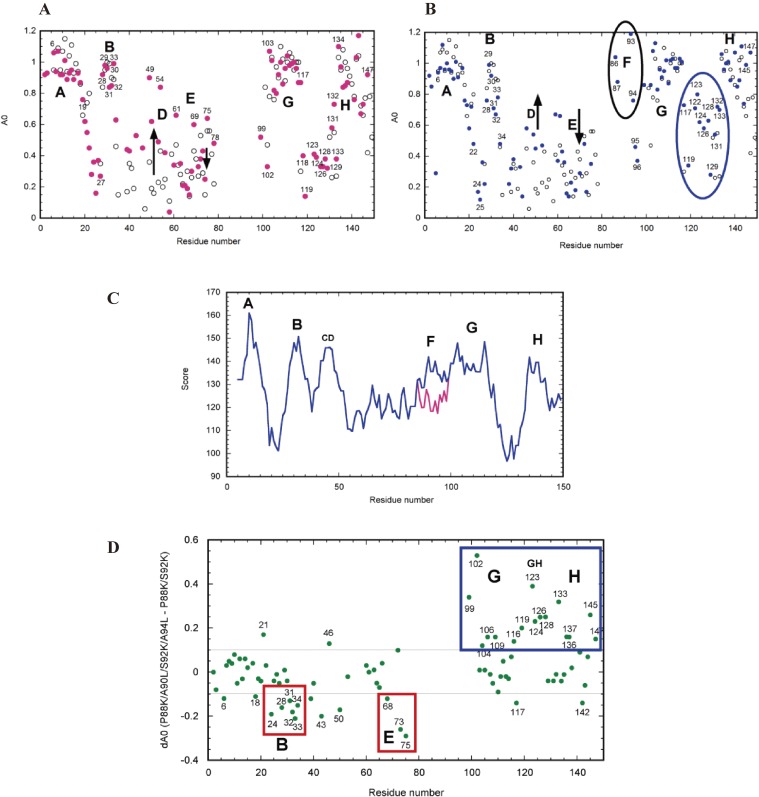
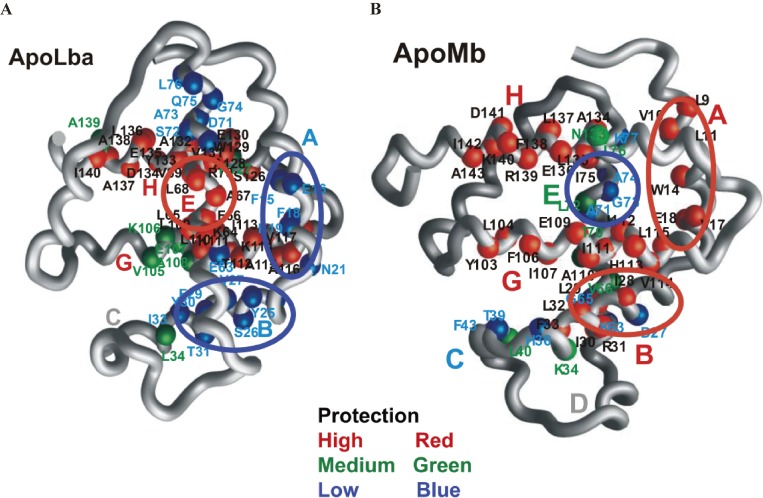
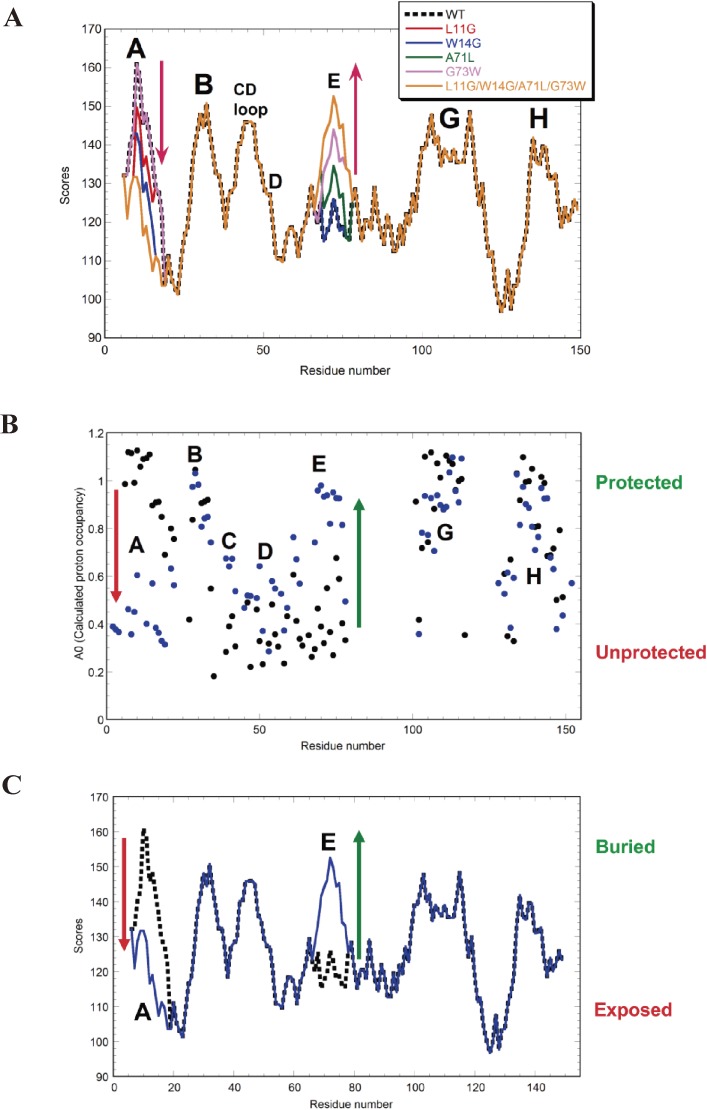
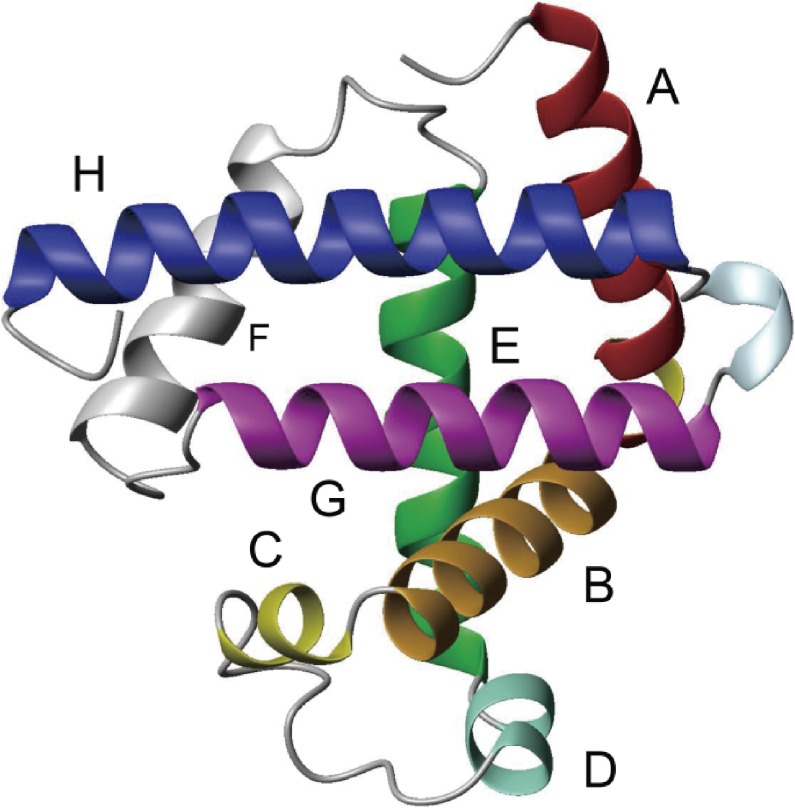
The structures of apomyoglobin folding intermediates have been widely analyzed using physical chemistry methods including fluorescence, circular dichroism, small angle X-ray scattering, NMR, mass spectrometry, and rapid mixing. So far, at least two intermediates (on sub-millisecond- and millisecond-scales) have been demonstrated for apomyoglobin folding. The combination of pH-pulse labeling and NMR is a useful tool for analyzing the kinetic intermediates at the atomic level. Its use has revealed that the latter-phase kinetic intermediate of apomyoglobin (6 ms) was composed of helices A, B, G and H, whereas the equilibrium intermediate, called the pH 4 molten-globule intermediate, was composed mainly of helices A, G and H. The improved strategy for the analysis of the kinetic intermediate was developed to include (1) the dimethyl sulfoxide method, (2) data processing with the various labeling times, and (3) a new in-house mixer. Particularly, the rapid mixing revealed that helices A and G were significantly more protected at the earlier stage (400 µs) of the intermediate (former-phase intermediate) than the other helices. Mutation studies, where each hydrophobic residue was replaced with an alanine in helices A, B, E, F, G and H, indicated that both non-native and native-like structures exist in the latter-phase folding intermediate. The N-terminal part of helix B is a weak point in the intermediate, and the docking of helix E residues to the core of the A, B, G and H helices was interrupted by a premature helix B, resulting in the accumulation of the intermediate composed of helices A, B, G and H. The prediction-based protein engineering produced important mutants: Helix F in a P88K/A90L/S92K/A94L mutant folded in the latter-phase intermediate, although helix F in the wild type does not fold even at the native state. Furthermore, in the L11G/W14G/A70L/G73W mutant, helix A did not fold but helix E did, which is similar to what was observed in the kinetic intermediate of apoleghemoglobin. Thus, this protein engineering resulted in a changed structure for the apomyoglobin folding intermediate.
Figures
Similar articles
-
Identification of native and non-native structure in kinetic folding intermediates of apomyoglobin.J Mol Biol. 2006 Jan 6;355(1):139-56. doi: 10.1016/j.jmb.2005.10.047. Epub 2005 Nov 8. J Mol Biol. 2006. PMID: 16300787
-
The kinetic and equilibrium molten globule intermediates of apoleghemoglobin differ in structure.J Mol Biol. 2008 May 2;378(3):715-25. doi: 10.1016/j.jmb.2008.03.025. Epub 2008 Mar 19. J Mol Biol. 2008. PMID: 18384808 Free PMC article.
-
Conformational and dynamic characterization of the molten globule state of an apomyoglobin mutant with an altered folding pathway.Biochemistry. 2001 Dec 4;40(48):14459-67. doi: 10.1021/bi011500n. Biochemistry. 2001. PMID: 11724558
-
The apomyoglobin folding pathway revisited: structural heterogeneity in the kinetic burst phase intermediate.J Mol Biol. 2002 Sep 20;322(3):483-9. doi: 10.1016/s0022-2836(02)00810-0. J Mol Biol. 2002. PMID: 12225742 Review.
-
Formation of the Native Topology of a Protein is due to the "Conserved but Non-Functional" Residues: A Case of Apomyoglobin Folding.Front Biosci (Landmark Ed). 2024 Nov 8;29(11):379. doi: 10.31083/j.fbl2911379. Front Biosci (Landmark Ed). 2024. PMID: 39614442 Review.
Cited by
-
Unified understanding of folding and binding mechanisms of globular and intrinsically disordered proteins.Biophys Rev. 2018 Apr;10(2):163-181. doi: 10.1007/s12551-017-0346-7. Epub 2018 Jan 6. Biophys Rev. 2018. PMID: 29307002 Free PMC article. Review.
-
Advances in Hydrogen/Deuterium Exchange Mass Spectrometry and the Pursuit of Challenging Biological Systems.Chem Rev. 2022 Apr 27;122(8):7562-7623. doi: 10.1021/acs.chemrev.1c00279. Epub 2021 Sep 7. Chem Rev. 2022. PMID: 34493042 Free PMC article. Review.
-
Non-Native Structures of Apomyoglobin and Apoleghemoglobin in Folding Intermediates Related to the Protein Misfolding.Molecules. 2023 May 8;28(9):3970. doi: 10.3390/molecules28093970. Molecules. 2023. PMID: 37175379 Free PMC article. Review.
-
Retrospective study for the universal applicability of the residue-based linear free energy relationship in the two-state exchange of protein molecules.Sci Rep. 2022 Oct 7;12(1):16843. doi: 10.1038/s41598-022-21226-z. Sci Rep. 2022. PMID: 36207470 Free PMC article.
-
DMSO-Quenched H/D-Exchange 2D NMR Spectroscopy and Its Applications in Protein Science.Molecules. 2022 Jun 10;27(12):3748. doi: 10.3390/molecules27123748. Molecules. 2022. PMID: 35744871 Free PMC article. Review.
References
-
- Anfinsen C.B. (1973) Principles that govern the folding of protein chains. Science 181, 223–230. - PubMed
-
- Ohgushi M., Wada A. (1983) ‘Molten-globule state’: a compact form of globular proteins with mobile side-chains. FEBS Lett. 164, 21–24. - PubMed
-
- Kuwajima K. (1989) The molten globule state as a clue for understanding the folding and cooperativity of globular-protein structure. Proteins 6, 87–103. - PubMed
-
- Udgaonkar J.B., Baldwin R.L. (1988) NMR evidence for an early framework intermediate on the folding pathway of ribonuclease A. Nature 335, 694–699. - PubMed
Publication types
MeSH terms
Substances
LinkOut - more resources
Full Text Sources
Other Literature Sources