. 2016 Jul 21;120(28):15415-15423.
doi: 10.1021/acs.jpcc.6b02753. Epub 2016 Jun 28.

Surface-Enhanced Hyper-Raman Spectra of Adenine, Guanine, Cytosine, Thymine, and Uracil

Affiliations

Surface-Enhanced Hyper-Raman Spectra of Adenine, Guanine, Cytosine, Thymine, and Uracil

Fani Madzharova et al. J Phys Chem C Nanomater Interfaces. .

Abstract

Using picosecond excitation at 1064 nm, surface-enhanced hyper-Raman scattering (SEHRS) spectra of the nucleobases adenine, guanine, cytosine, thymine, and uracil with two different types of silver nanoparticles were obtained. Comparing the SEHRS spectra with SERS data from the identical samples excited at 532 nm and with known infrared spectra, the major bands in the spectra are assigned. Due to the different selection rules for the one- and two-photon excited Raman scattering, we observe strong variation in relative signal strengths of many molecular vibrations obtained in SEHRS and SERS spectra. The two-photon excited spectra of the nucleobases are found to be very sensitive with respect to molecule-nanoparticle interactions. Using both the SEHRS and SERS data, a comprehensive vibrational characterization of the interaction of nucleobases with silver nanostructures can be achieved.


Conflict of interest statement

The authors declare no competing financial interest.

Figures

Figure 1
Figure 1
Structure and atom labeling for adenine, guanine, uracil, thymine, and cytosine.
Figure 2
Figure 2
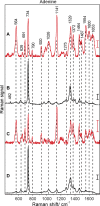
Surface-enhanced hyper-Raman (A, C) and surface-enhanced Raman (B, D) spectra of adenine obtained with citrate (A, B) and hydroxylamine (C, D) reduced silver nanoparticles: excitation, 1064 nm (A, C) and 532 nm (B, D); photon flux density, 5.1 × 1028 photons cm–2 s–1 (A, C) and 1.4 × 1027 photons cm–2 s–1 (B, D); acquisition time, 20 s (A), 60 s (C), and 1 s (B, D); scale bars, 5 cps (A), 1000 cps (B), 1 cps (C), and 1500 cps (D); adenine concentration, 5 × 10⁻⁵ M.
Figure 3
Figure 3
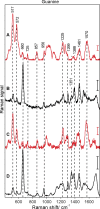
Surface-enhanced hyper-Raman (A, C) and surface-enhanced Raman (B, D) spectra of guanine obtained with citrate (A, B) and hydroxylamine (C, D) reduced silver nanoparticles: excitation, 1064 nm (A, C) and 532 nm (B, D); photon flux density, 5.1 × 1028 photons cm–2 s–1 (A, C) and 1.4 × 1027 photons cm–2 s–1 (B, D); acquisition time, 20 s (A), 60 s (C), and 1 s (B, D); scale bars, 5 cps (A), 500 cps (B), 1 cps (C), and 2500 cps (D); guanine concentration, 5 × 10⁻⁵ M.
Figure 4
Figure 4
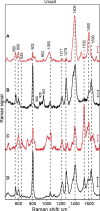
Surface-enhanced hyper-Raman (A, C) and surface-enhanced Raman (B, D) spectra of uracil obtained with citrate (A, B) and hydroxylamine (C, D) reduced silver nanoparticles: excitation, 1064 nm (A, C) and 532 nm (B, D); photon flux density, 1.7 × 1028 photons cm–2 s–1 (A, C) and 1.4 × 1027 photons cm–2 s–1 (B, D); acquisition time, 40 s (A), 100 s (C), and 1 s (B, D); scale bars, 5 cps (A), 300 cps (B), 1 cps (C), and 1500 cps (D); uracil concentration, 5 × 10⁻⁵ M. Spectra with hydroxylamine reduced silver nanoparticles were obtained at pH 10.
Figure 5
Figure 5
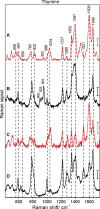
Surface-enhanced hyper-Raman (A, C) and surface-enhanced Raman (B, D) spectra of thymine obtained with citrate (A, B) and hydroxylamine (C, D) reduced silver nanoparticles: excitation, 1064 nm (A, C) and 532 nm (B, D); photon flux density, 1.7 × 1028 photons cm–2 s–1 (A, C) and 1.4 × 1027 photons cm–2 s–1 (B, D); acquisition time, 40 s (A), 100 s (C), and 1 s (B, D); scale bars, 5 cps (A), 300 cps (B), 1 cps (C), and 600 cps (D); thymine concentration, 5 × 10⁻⁵ M. Spectra with hydroxylamine reduced silver nanoparticles were obtained at pH 10.
Figure 6
Figure 6
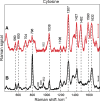
Surface-enhanced hyper-Raman (A) and surface-enhanced Raman (B) spectrum of cytosine obtained with citrate reduced silver nanoparticles: excitation, 1064 nm (A) and 532 nm (B); photon flux density, 4.7 × 1028 photons cm–2 s–1 (A) and 1.4 × 1027 photons cm–2 s–1 (B); acquisition time, 40 s (A) and 1 s (B); scale bars, 10 cps (A) and 500 cps (B); cytosine concentration, 5 × 10⁻⁵ M.

Similar articles

Cited by

References

    1. Erfurth S. C.; Peticolas W. L. Melting and Premelting Phenomenon in DNA by Laser Raman Scattering. Biopolymers 1975, 14, 247–264. 10.1002/bip.1975.360140202. - DOI - PubMed
    1. Fodor S. P. A.; Spiro T. G. Ultraviolet Resonance Raman Spectroscopy of DNA with 200–266-nm Laser Excitation. J. Am. Chem. Soc. 1986, 108, 3198–3205. 10.1021/ja00272a006. - DOI
    1. Nishimura Y.; Tsuboi M.; Kubasek W. L.; Bajdor K.; Peticolas W. L. Ultraviolet Resonance Raman Bands of Guanosine and Adenosine Residues Useful for the Determination of Nucleic Acid Conformation. J. Raman Spectrosc. 1987, 18, 221–227. 10.1002/jrs.1250180314. - DOI
    1. Benevides J. M.; Overman S. A.; Thomas G. J. Raman, Polarized Raman and Ultraviolet Resonance Raman Spectroscopy of Nucleic Acids and Their Complexes. J. Raman Spectrosc. 2005, 36, 279–299. 10.1002/jrs.1324. - DOI
    1. Fleischmann M.; Hendra P. J.; McQuillan A. J. Raman Spectra of Pyridine Adsorbed at a Silver Electrode. Chem. Phys. Lett. 1974, 26, 163–166. 10.1016/0009-2614(74)85388-1. - DOI