. 2017 Apr;38(4):577-584.
doi: 10.1097/MAO.0000000000001330.

Middle-Ear Sound Transmission Under Normal, Damaged, Repaired, and Reconstructed Conditions

Affiliations

Middle-Ear Sound Transmission Under Normal, Damaged, Repaired, and Reconstructed Conditions

Wei Dong et al. Otol Neurotol. 2017 Apr.

Abstract

Hypothesis: We hypothesize that current clinical treatment strategies for the disarticulated or eroded incus have the effect of combining the incus and stapes of the human middle ear (ME) into one rigid structure, which, while capable of adequately transmitting lower-frequency sounds, fails for higher frequencies.

Background: ME damage causes conductive hearing loss (CHL) and while great progress has been made in repairing or reconstructing damaged MEs, the outcomes are often far from ideal.

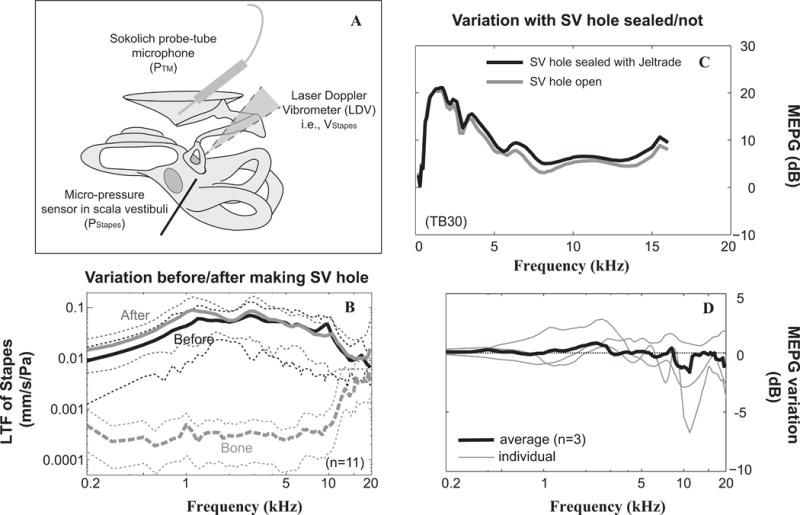
Methods: Temporal bones (TBs) from human cadavers, a laser Doppler vibrometer (LDV), and a fiber-optic based micro-pressure sensor were used to characterize ME transmission under various ME conditions: normal; with a disarticulated incus; repaired using medical glue; or reconstructed using a partial ossicular replacement prosthesis (PORP).

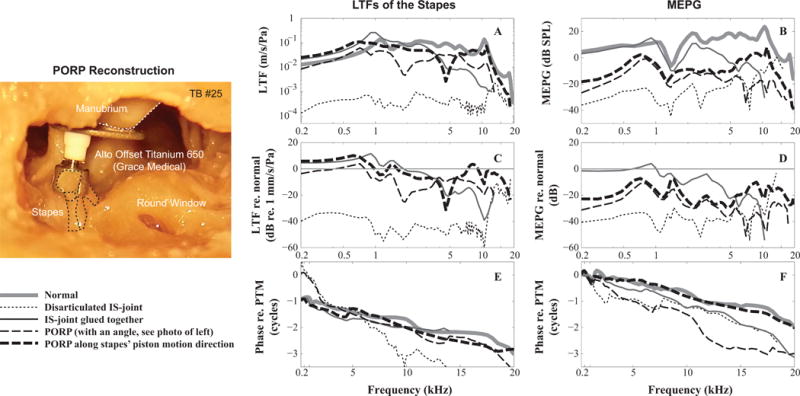
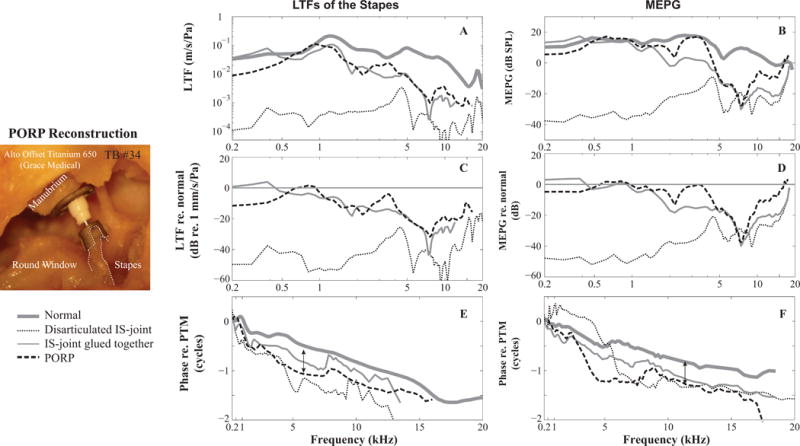
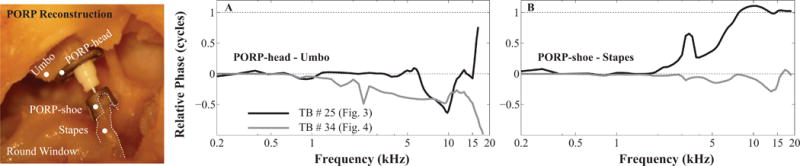
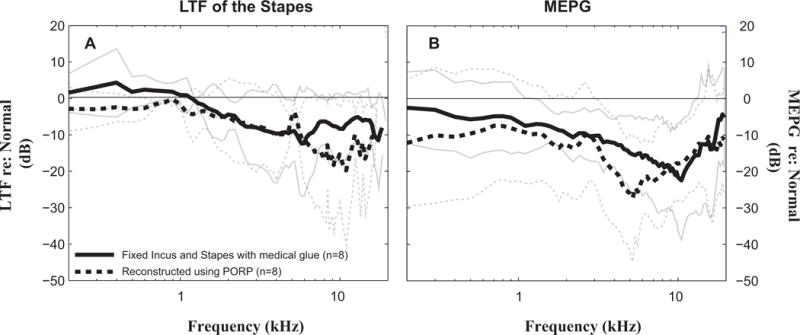
Results: Repairing the disarticulated incus using medical glue, or replacing the incus using a commercial PORP, provided similar restoration of ME function including almost perfect function at frequencies below 4 kHz, but with more than a 20-dB loss at higher frequencies. Associated phase responses under these conditions sometimes varied and seemed dependent on the degree of coupling of the PORP to the remaining ME structure. A new ME-prosthesis design may be required to allow the stapes to move in three-dimensional (3-D) space to correct this deficiency at higher frequencies.

Conclusions: Fixation of the incus to the stapes or ossicular reconstruction using a PORP limited the efficiency of sound transmission at high frequencies.


Figures

Figure 1
Figure 1. Experimental approach and control
A: Schematic of the experimental design for characterization of the ME system using a laser Doppler vibrometer, micro-pressure sensor and Sokolich probe-tube microphone. Velocity responses were measured along the ossicular chain, especially at the stapes while simultaneous pressure measurements were made at the tympanic membrane close to the umbo (PTM) and in scala vestibule next to the stapes (PStapes). B: Effects of the SV hole on stapes LTF. Black and gray solid lines stand for average stapes LTFs across 11 TBs under the condition of cochlea intact and after the SV hole was made. Corresponding thin-dotted lines represent ±1 standard diaviation. In addition, averaged velocity responses from sourrounding bone normalized to PTM together with ±1 standard diaviation were plotted as the gray dashed curve. C and D: effects of leaving SV hole unsealed on MEPG. C: Example from preparation of TB #30 demostrates MEPG under the condition of SV not sealed (solid gray line) or the SV fenestration sealed with Jeltrade (solid black line), respectively. D: MEPG variation upon slealing versus leaving the SV hole open. Thick line stands for average results across three individual TBs (thin lines). The maximum average variation of MEPG upon sealing the SV hole was ~2 dB. LTF: local transfer function; MEPG: middle ear pressure gain; PStapes: pressure in the SV next to the stapes; PTM: pressure at the TM close to the umbo; SV: scala vestibule; TM: tympanic membrane.
Figure 2
Figure 2. MEPG under normal control conditions
A: Amplitude of MEPG defined as PStapes/PTM plotted in dB; B: phase of MEPG equals to PStapes referenced to PTM. Black solid and dotted lines equal the average value across eight TBs ±1 standard deviation. Gray lines in both plots indicate published average results of six fresh TBs measured with 167 μm OD micro-pressure sensor, using similar surgical approaches with the SV hole sealed (Nakajima et al., 2008).
Figure 3
Figure 3. Stapes LTFs and MEPGs under normal and pathological conditions
A and B: amplitude of the stapes LTFs and MEPGs; (C and D) Variation of the stapes LTFs and MEPGs from normal condition; (E and F) phase of stapes LTFs and MEPGs. Figure legend at the bottom left. Micrograph panel at left side of figure shows the PORP placement at an angle, 20–30°, to the piston-like motion of the stapes (dotted lines). (TB #25)
Figure 4
Figure 4. Stapes LTFs and MEPGs under normal and pathological conditions
A and B: amplitude of the stapes LTFs and MEPGs; (C and D) Variation of the stapes LTFs and MEPGs from normal condition; (E and F) phase of stapes LTFs and MEPGs. Double headed arrows indicate 0.5-cycle phase shifts (see Figure 5). Figure legend at the bottom left. Micrograph panel at left side of figure shows the PORP placement along the piston-like motion direction of the stapes (dotted lines). (TB #34)
Fig. 5
Fig. 5. Evaluation of PORP motion relative to the connecting ME structures
A: phase differrence of the umbo and PORP-head; B: phase difference of the stapes and PORP-shoe. Black and gray lines stand for TB #25 and #34, respectively.
Figure 6
Figure 6. Outcomes of middle-ear repair or reconstruction
A: Mean differences ± 1 standard deviation of stapes LTFs from the normal-control condition. (averaged across eight temporal bones); B: Mean differences ± 1 standard deviation of MEPG from the normal-control condition. (averaged across eight temporal bones). Solid and dashed lines represent glued and PORP conditions, respectively.

References

    1. Rosowski JJ. In: Sensors and Sensing in Biology and Engineering. Barth FG, Humphrey JA, Secomb TW, editors. XII. Springer; 2003. pp. 59–69.
    1. Wever EG, Lawrence M. Physiological acoustics. Princeton University Press; 1954.
    1. Von Bekesy G. Experiments in hearing. McGraw-Hill; 1960.
    1. Rosowski JJ, et al. Computer-assisted time-averaged holograms of the motion of the surface of the mammalian tympanic membrane with sound stimuli of 0.4–25 kHz. Hear Res. 2009;253:83–96. doi: 10.1016/j.heares.2009.03.010. - DOI - PMC - PubMed
    1. Tonndorf J, Khanna SM. Tympanic-membrane vibrations in human cadaver ears studied by time-averaged holography. J Acoust Soc Am. 1972;52:1221–1233. - PubMed