. 2017 Jan 12;8(1):e2548.
doi: 10.1038/cddis.2016.480.

HIF-2α and Oct4 have synergistic effects on survival and myocardial repair of very small embryonic-like mesenchymal stem cells in infarcted hearts

Affiliations

HIF-2α and Oct4 have synergistic effects on survival and myocardial repair of very small embryonic-like mesenchymal stem cells in infarcted hearts

Shaoheng Zhang et al. Cell Death Dis. .

Abstract

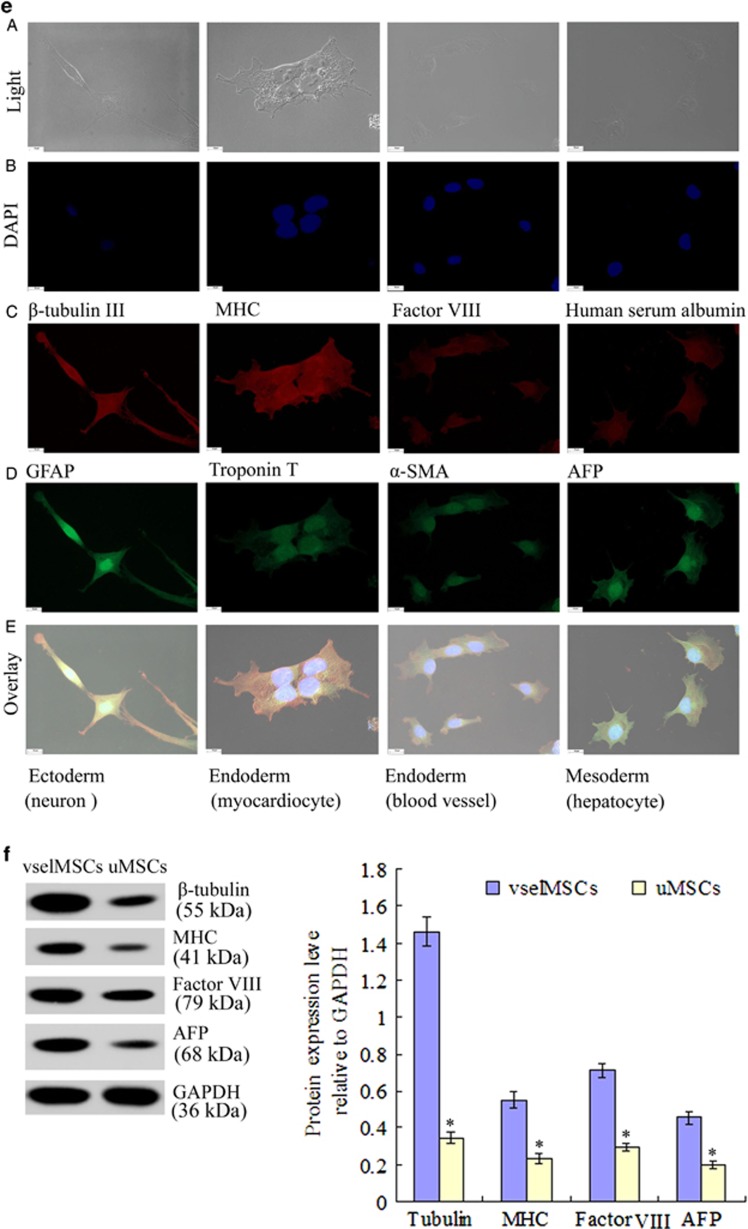
Poor cell survival and limited functional benefits have restricted mesenchymal stem cell (MSC) efficacy for treating myocardial infarction (MI), suggesting that a better understanding of stem cell biology is needed. The transcription factor HIF-2α is an essential regulator of the transcriptional response to hypoxia, which can interact with embryonic stem cells (ESCs) transcription factor Oct4 and modulate its signaling. Here, we obtained very small embryonic-like mesenchymal stem cells (vselMSCs) from MI patients, which possessed the very small embryonic-like stem cells' (VSELs) morphology as well as ESCs' pluripotency. Using microarray analysis, we compared HIF-2α-regulated gene profiles in vselMSCs with ESC profiles and determined that HIF-2α coexpressed Oct4 in vselMSCs similarly to ESCs. However, this coexpression was absent in unpurified MSCs (uMSCs). Under hypoxic condition, vselMSCs exhibited stronger survival, proliferation and differentiation than uMSCs. Transplantation of vselMSCs caused greater improvement in cardiac function and heart remodeling in the infarcted rats. We further demonstrated that HIF-2α and Oct4 jointly regulate their relative downstream gene expressions, including Bcl2 and Survivin; the important pluripotent markers Nanog, Klf4, and Sox2; and Ang-1, bFGF, and VEGF, promoting angiogenesis and engraftment. Importantly, these effects were generally magnified by upregulation of HIF-2α and Oct4 induced by HIF-2α or Oct4 overexpression, and the greatest improvements were elicited after co-overexpressing HIF-2α and Oct4; overexpressing one transcription factor while silencing the other canceled this increase, and HIF-2α or Oct4 silencing abolished these effects. Together, these findings demonstrated that HIF-2α in vselMSCs cooperated with Oct4 in survival and function. The identification of the cooperation between HIF-2α and Oct4 will lead to deeper characterization of the downstream targets of this interaction in vselMSCs and will have novel pathophysiological implications for the repair of infarcted myocardium.


Conflict of interest statement

The authors declare no conflict of interest.

Figures

Figure 1
Figure 1
VSEL properties. (a) Age-dependent frequency of VSEL cell subsets expressing CD133+LinCD45 into the PB. Two groups of patients with STEMI were designated according to age: Non-Older (20–60 years), Older (>60–75 years). The frequency of CD133+LinCD45 cell subsets was calculated per ml PB. *P<0.05 for comparison between the groups (n=10 per group). (b) Bar graphs showing the absolute numbers of circulating CD133+LinCD45 cells in the peripheral vein and stenotic coronary artery of patients with STEMI; there was peak mobilization early in the patients. *P<0.05 for comparison between the stenotic arterial blood and the peripheral vein blood (n=10 per group). (c) depicts cryptograms of the MNC population and gating strategy starting from Lineage versus side scatter (SSC). Cells were visualized by dot plot showing Lineage-PerCP-Cy5.5 versus SSC characteristics, which are related to Lineage negative (Lin) and granularity/complexity, respectively (left). Objects from gate R1 were further analyzed for CD133 and CD45 expression, and only CD133+CD45 events were selected. The population from gate R1 was subsequently sorted based on CD45 marker expression into Lin/CD133+/CD45 VSELs, which are visualized in the histogram (right). (d) qRT-PCR evaluation of Oct4, Nanog, Klf4, and Sox2 mRNA levels. *P<0.05 for comparison between SB and PB (n=10 per group). (e) Representative immunoblot electrophoresis showing Oct4, Nanog, Klf4, and Sox2 protein levels in VSELs from SB and PB. (f) Apoptotic cell death was assessed by annexin V-PI staining. *P<0.05 for comparison between SB and PB (n=10 per group)
Figure 2
Figure 2
Characterization of vselMSCs. MSCs were collected from the affected coronary artery and filtered to obtain a population of vselMSCs. (a) vselMSCs, ESCs, and uMSCs were cultured in ESC medium and MSC medium, and compared morphologically under a bright-field microscope (upper panels: 10 × magnification, bars=25 μm; lower panels: × 20 magnification, bars=10 μm). (b) mRNA levels of the pluripotency markers Nanog, Klf4, Sox2, and Oct4 evaluated in vselMSCs, ESCs and uMSCs via qRT-PCR and normalized to GAPDH mRNA levels. *P<0.05 versus vselMSCs, P<0.05 versus ESCs (n=10 per group). (c) Oct4, Nanog, Klf4, and Sox2, protein levels in vselMSCs, ESCs and uMSCs compared via western blotting; GAPDH levels were used as the protein loading control. (d) The proportions of vselMSCs that expressed MSC (SH2 and SH3), ESC (SSEA), and VSEL (CD133 and CXCR4) markers, the matrix receptor CD44, and the endothelial marker CD147 were determined via flow cytometry (AE). (F) FACS analysis of CD44, CXCR4, SSEA, CD147, SH2, SH3, and CD133 expression levels between vselMSCs and uMSCs. *P<0.05 versus vselMSCs (n=10 per group). (e) vselMSCs were induced to differentiate into cells from all three developmental germ layers (ectoderm: column 1; endoderm: columns 2–3; and mesoderm: column 4). The differentiated cells were examined morphologically (A) and via immunofluorescence (BE) for the expression of ectodermal cell markers (i.e., the neuron-specific proteins β-tubulin III and glial fibrillary acidic protein [GFAP]), endodermal cell markers (i.e., the cardiomyocyte-specific markers troponin T and myosin heavy chain [MHC], and the vascular-cell specific proteins factor VIII and α-sarcomeric actin [α −SMA]), and mesodermal cell markers (i.e. the hepatic-cell markers serum albumin and alpha-fetoprotein [AFP]). The nuclei were stained with DAPI (blue), and the cytoplasm was stained red with anti-β-tubulin III, MHC anti-factor VIII, or serum albumin, and green with GFAP, troponin T, α-SMA, or AFP, respectively. Bars=10 μm. (f) Representative immunoblot electrophoresis and subsequent quantification showing β-tubulin III, MHC, factor VIII, and AFP protein levels. *P<0.05 versus vselMSCs (n=10 per group)
Figure 2
Figure 2
Characterization of vselMSCs. MSCs were collected from the affected coronary artery and filtered to obtain a population of vselMSCs. (a) vselMSCs, ESCs, and uMSCs were cultured in ESC medium and MSC medium, and compared morphologically under a bright-field microscope (upper panels: 10 × magnification, bars=25 μm; lower panels: × 20 magnification, bars=10 μm). (b) mRNA levels of the pluripotency markers Nanog, Klf4, Sox2, and Oct4 evaluated in vselMSCs, ESCs and uMSCs via qRT-PCR and normalized to GAPDH mRNA levels. *P<0.05 versus vselMSCs, P<0.05 versus ESCs (n=10 per group). (c) Oct4, Nanog, Klf4, and Sox2, protein levels in vselMSCs, ESCs and uMSCs compared via western blotting; GAPDH levels were used as the protein loading control. (d) The proportions of vselMSCs that expressed MSC (SH2 and SH3), ESC (SSEA), and VSEL (CD133 and CXCR4) markers, the matrix receptor CD44, and the endothelial marker CD147 were determined via flow cytometry (AE). (F) FACS analysis of CD44, CXCR4, SSEA, CD147, SH2, SH3, and CD133 expression levels between vselMSCs and uMSCs. *P<0.05 versus vselMSCs (n=10 per group). (e) vselMSCs were induced to differentiate into cells from all three developmental germ layers (ectoderm: column 1; endoderm: columns 2–3; and mesoderm: column 4). The differentiated cells were examined morphologically (A) and via immunofluorescence (BE) for the expression of ectodermal cell markers (i.e., the neuron-specific proteins β-tubulin III and glial fibrillary acidic protein [GFAP]), endodermal cell markers (i.e., the cardiomyocyte-specific markers troponin T and myosin heavy chain [MHC], and the vascular-cell specific proteins factor VIII and α-sarcomeric actin [α −SMA]), and mesodermal cell markers (i.e. the hepatic-cell markers serum albumin and alpha-fetoprotein [AFP]). The nuclei were stained with DAPI (blue), and the cytoplasm was stained red with anti-β-tubulin III, MHC anti-factor VIII, or serum albumin, and green with GFAP, troponin T, α-SMA, or AFP, respectively. Bars=10 μm. (f) Representative immunoblot electrophoresis and subsequent quantification showing β-tubulin III, MHC, factor VIII, and AFP protein levels. *P<0.05 versus vselMSCs (n=10 per group)
Figure 3
Figure 3
Identification of HIF-2α interacting proteins in vselMSCs. (a) Patterns of anti-apoptotic gene expression evaluated via gene expression array analysis in vselMSCs and ESCs cultured under normoxic conditions. (b) mRNA (qRT-PCR) and (c) protein levels (western blotting) of HIF-1 and HIF-2, and of four genes that are regulated by HIF (survivin, Bcl2, bFGF, and VEGF), evaluated in normoxia-cultured vselMSCs, ESCs and uMSCs. *P<0.05 versus vselMSCs, P<0.05 versus ESCs (n=10 per group). (d) Apoptosis (annexin V) and cell death (propidium iodide (PI)) were evaluated in normoxia-cultured vselMSCs, ESCs, and uMSCs via flow cytometry
Figure 4
Figure 4
HIF-2α and Oct4 promote vselMSC growth. vselMSCs were transfected with vectors encoding HIF-2α, HIF-2α siRNA (siHIF-2α), Oct4, or Oct4 siRNA (siOct4) and cultured under hypoxic conditions. (a) qRT-PCR (A) and western blot (B) analysis of HIF-2α and Oct4 mRNA and protein expression, respectively, revealing that the two genes were significantly increased in vselMSCs overexpressing HIF-2α or Oct4 as compared with control vselMSCs and that expression was highest in cells co-overexpressing HIF-2α and Oct4. Silencing HIF-2α or Oct4 significantly reduced expression of the corresponding mRNA and protein. Overexpressing one transcription factor while silencing the other significantly increased the former and decreased the latter. *P<0.05 versus vehicle, P<0.05 versus HIF-2α or Oct4 overexpression, P<0.05 versus HIF-2α or Oct4 silencing, §P<0.05 versus HIF-2α and Oct4 co-overexpression, ||P<0.05 versus HIF-2α overexpression and Oct4 silencing (n=10 per group). (C) HIF-2α and Oct4 expression in cells determined by immunofluorescence with anti-Oct4 (green) and anti-HIF-2α (red) antibodies, respectively. Also shown are DAPI staining (nuclei; blue) and merged images. Bars=10 μm. HIF-2α and Oct4 were mainly localized in the nucleus. HIF-2α or Oct4 overexpression markedly increased the staining intensity of HIF-2α and Oct4, while HIF-2α or Oct4 silencing markedly suppressed it. The increase was further improved in the cells co-overexpressing both HIF-2α and Oct4, and an inhibitory effect was observed when one transcription factor was overexpressed and the other was silenced. These data all indicate the physical co-binding of HIF-2α and Oct4. (b) Proliferation was evaluated by Ki67-positive cells under immunofluorescence microscopy; (c) cell death was evaluated via flow cytometry analysis of annexin V-stained cells; (d) HIF-2α, Oct4, bFGF, VEGF, Bcl2, survivin, and caspase-3 mRNA and protein levels were evaluated with qRT-PCR (A) and western blotting (B), respectively. *P<0.05 versus vehicle, P<0.05 versus HIF-2α or Oct4 overexpression, P<0.05 versus HIF-2α or Oct4 silencing, §P<0.05 versus HIF-2α and Oct4 co-overexpression, ||P<0.05 versus HIF-2α overexpression and Oct4 silencing (n=10 per group)
Figure 5
Figure 5
Effects of HIF-2α and Oct4 on induced differentiation in vselMSCs. Under hypoxic conditions, vselMSCs with enhanced, deficient, or WT levels of HIF-2α or Oct4 activity were examined for differences in (a) mRNA (qRT-PCR) and (b) protein levels (western blotting) of the pluripotency factors Nanog, Klf4, and Sox2, the cardiomyocyte markers MHC and troponin T (TnT), and the endothelial marker factor VIII. *P<0.05 versus vehicle, P<0.05 versus HIF-2α or Oct4 overexpression, P<0.05 versus HIF-2α or Oct4 silencing, §P<0.05 versus HIF-2α and Oct4 co-overexpression (n=10 per group). (c) Cell differentiation was induced by growth factor treatment. MHC and factor VIII expression was visualized in treated cells by immunofluorescence (bars=50 μm). The nuclei were stained with DAPI (blue), and the cytoplasm of the myocardiocytes or blood endothelial cells was stained red with anti-MHC or anti-factor VIII, respectively
Figure 6
Figure 6
Collaboration of HIF-2α and Oct4 increases the functional and structural benefits of vselMSC transplantation in hearts with ischemic injury. MI was surgically induced in rats, and then saline (PBS), uMSCs, or vselMSCs with enhanced, deficient, or WT levels of HIF-2α or Oct4 activity were injected into the infarcted regions. Echocardiographic assessments of (a) left-ventricular (LV) ejection fraction (LVEF), (b) fractional shortening (LVFS), (c) diastolic area (LVDa), (d) diastolic diameter (LVEDd), and infarct size determined by echocardiography (e) and histology (f) were performed 30 days later. *P<0.05 versus SHAM, P<0.05 versus PBS, P<0.05 versus WTuM, §P<0.05 versus vehicle vselMSCs, ||P<0.05 versus vselMSCs overexpressing HIF-2α or Oct4, #P<0.05 versus vselMSCs with HIF-2α or Oct4 silencing, **P<0.05 versus HIF-2α and Oct4 co-overexpression (SHAM, n=10; PBS, n=12; WTuM, n=12; WTvselMSCs, n=13; HIF-2α+vselMSCs, n=14; siHIF-2α+vselMSCs, n=11; Oct4+vselMSCs, n=14; siOct4+vselMSCs, n=12; HIF-2+αOct4+vselMSCs, n=15; HIF-2+αsiOct4+vselMSCs, n=12; Oct4+siHIF-2α+vselMSCs, n=13). (c) Cell differentiation was induced by growth factor treatment. MHC and factor VIII expression was visualized in treated cells by immunofluorescence (bars=50 μm). (g) TTC-stained and cut into transverse sections to assess infarct size (percentage of the area of the entire LV). None of the infarcted myocardium was stained red by TTC; the pale region is the infarcted myocardium
Figure 7
Figure 7
Identification of target genes coregulated by HIF-2α and Oct4 on angiogenesis of transplanted vselMSCs. mRNA (qRT-PCR) of HIF-2α (a) and Oct4 (b) and of the proangiogenic proteins angiopoietin 1 (Ang-1, c), bFGF (d), and VEGF (e) in sections from the SHAM rat hearts, and the peri-infarct regions of rats treated with saline (PBS), uMSC and with vselMSCs with enhanced, deficient, or WT levels of HIF-2α or Oct4 activity. (f) Representative western blots of HIF-2α, Oct4, Ang-1, bFGF, and VEGF levels in rat hearts 1 month post-operation. (g) show the quantitative analysis of vessel density by staining with factor VIII. *P<0.05 versus SHAM, P<0.05 versus PBS, P<0.05 versus WTuM, §P<0.05 versus vehicle vselMSCs, ||P<0.05 versus vselMSCs overexpressing HIF-2α or Oct4, #P<0.05 versus vselMSCs with HIF-2α or Oct4 silencing, **P<0.05 versus HIF-2α and Oct4 co-overexpression (SHAM, n=5; PBS, n=7; WTuM, n=7; WTvselMSCs, n=8; HIF-2α+vselMSCs, n=9; siHIF-2α+vselMSCs, n=6; Oct4+vselMSCs, n=9; siOct4+vselMSCs, n=7; HIF-2α+Oct4+vselMSCs, n=10; HIF-2α+siOct4+vselMSCs, n=7; Oct4+siHIF-2α+vselMSCs, n=8). (h) Immunofluorescence of expression of the proangiogenic factors Ang-1, bFGF, and VEGF in peri-infarct regions via the corresponding antibodies (red), the nuclei were stained blue with DAPI (bars=50 μm). Ang-1, bFGF and VEGF were mainly expressed by the blood vessels and cardiomyocytes in the vselMSCs-treated animals, especially in those receiving HIF-2αvselMSCs or Oct4vselMSCs transplantation, and more obviously in the animals that had received vselMSCs combined with HIF-2α and Oct4 transfection. (i) Evaluation of vascularity in the peri-infarct regions via immunostaining for factor VIII expression (brown); quantification was performed by counting positively stained vascular structures (bars=50 μm)
Figure 7
Figure 7
Identification of target genes coregulated by HIF-2α and Oct4 on angiogenesis of transplanted vselMSCs. mRNA (qRT-PCR) of HIF-2α (a) and Oct4 (b) and of the proangiogenic proteins angiopoietin 1 (Ang-1, c), bFGF (d), and VEGF (e) in sections from the SHAM rat hearts, and the peri-infarct regions of rats treated with saline (PBS), uMSC and with vselMSCs with enhanced, deficient, or WT levels of HIF-2α or Oct4 activity. (f) Representative western blots of HIF-2α, Oct4, Ang-1, bFGF, and VEGF levels in rat hearts 1 month post-operation. (g) show the quantitative analysis of vessel density by staining with factor VIII. *P<0.05 versus SHAM, P<0.05 versus PBS, P<0.05 versus WTuM, §P<0.05 versus vehicle vselMSCs, ||P<0.05 versus vselMSCs overexpressing HIF-2α or Oct4, #P<0.05 versus vselMSCs with HIF-2α or Oct4 silencing, **P<0.05 versus HIF-2α and Oct4 co-overexpression (SHAM, n=5; PBS, n=7; WTuM, n=7; WTvselMSCs, n=8; HIF-2α+vselMSCs, n=9; siHIF-2α+vselMSCs, n=6; Oct4+vselMSCs, n=9; siOct4+vselMSCs, n=7; HIF-2α+Oct4+vselMSCs, n=10; HIF-2α+siOct4+vselMSCs, n=7; Oct4+siHIF-2α+vselMSCs, n=8). (h) Immunofluorescence of expression of the proangiogenic factors Ang-1, bFGF, and VEGF in peri-infarct regions via the corresponding antibodies (red), the nuclei were stained blue with DAPI (bars=50 μm). Ang-1, bFGF and VEGF were mainly expressed by the blood vessels and cardiomyocytes in the vselMSCs-treated animals, especially in those receiving HIF-2αvselMSCs or Oct4vselMSCs transplantation, and more obviously in the animals that had received vselMSCs combined with HIF-2α and Oct4 transfection. (i) Evaluation of vascularity in the peri-infarct regions via immunostaining for factor VIII expression (brown); quantification was performed by counting positively stained vascular structures (bars=50 μm)
Figure 8
Figure 8
HIF-2α and Oct4 regulate the expression of anti-apoptotic genes. mRNA expression levels of the anti-apoptotic proteins Bcl-2 (a) and survivin (b) and the pro-apoptotic protein caspase 3 (c) evaluated in sections from the peri-infarct regions of rats treated with sham operation (SHAM), saline (PBS), with vselMSCs with enhanced, deficient, or WT levels of HIF-2α or Oct4 activity. *P<0.05 versus SHAM, P<0.05 versus PBS, P<0.05 versus WTuM, §P<0.05 versus vehicle vselMSCs, ||P<0.05 versus vselMSCs overexpressing HIF-2α or Oct4, #P<0.05 versus vselMSCs with HIF-2α or Oct4 silencing, **P<0.05 versus HIF-2α and Oct4 co-overexpression (SHAM, n=5; PBS, n=7; WTuM, n=7; WTvselMSCs, n=8; HIF-2α+vselMSCs, n=9; siHIF-2α+vselMSCs, n=6; Oct4+vselMSCs, n=9; siOct4+vselMSCs, n=7; HIF-2α+Oct4+vselMSCs, n=10; HIF-2α+siOct4+vselMSCs, n=7; Oct4+siHIF-2α+vselMSCs, n=8). (d) Western blotting of Bcl-2, survivin, and caspase-3 expression levels. Protein expression correlated with mRNA expression. (e) Bcl2, survivin, and caspase 3 protein expression visualized in the peri-infarct regions from the WTvsel, HIF-2α+, +HIF-2α+Oct4+, and siHIF-2α+ via immunofluorescence staining with the corresponding antibodies (red) (bars=50 μm)
Figure 9
Figure 9
HIF-2α and Oct4 increase the proliferation and engraftment of transplanted vselMSCs. (ad) Statistical analysis of the mean percentage of EGFP-positive cells (EGFP+) relative to the whole ventricular cell population (a), Ki67 and EGFP double-positive cells (Ki67+EGFP+) relative to the whole EGFP+ population (b), MHC and EGFP double-positive cells (MHC+EGFP+) relative to the whole EGFP+ population (c), and factor VIII and EGFP double-positive cells (factor VIII+EGFP+) relative to the whole EGFP+ population (d) as assessed by FACS. *P<0.05 versus WTuM, P<0.05 versus vehicle vselMSCs, P<0.05 versus HIF-2α or Oct4 overexpression, §P<0.05 versus vselMSCs with HIF-2α or Oct4 silencing, ||P<0.05 versus HIF-2α and Oct4 co-overexpression (n=5 per group). (eh) Representative phenotype of gated EGFP+ (e), Ki67+EGFP+ (f), MHC+EGFP+ (g), and factor VIII+EGFP+ cells (h) evaluated by FACS in WTuM, vehicle vselMSCs, HIF-2α- or Oct4-overexpressing vselMSCs, and HIF-2α- or Oct4-silenced vselMSCs. (i and j) Immunofluorescence staining showing that transplanted cells expressed MHC (i) and factor VIII (j). The transplanted cells were pre-labeled with EGFP (green); the nuclei were stained with DAPI (blue), and the cytoplasm of the myocardiocytes or blood endothelial cells was stained red with anti-MHC or anti-factor VIII, respectively. Engrafted EGFP-pre-labeled cells expressing MHC or factor VIII were the most numerous in the HIF-2α+siOct4+vselMSCs, followed by that in cells overexpressing HIF-2α or Oct4, and were lowest in HIF-2α- or Oct4-silenced vselMSCs (arrows)
Figure 9
Figure 9
HIF-2α and Oct4 increase the proliferation and engraftment of transplanted vselMSCs. (ad) Statistical analysis of the mean percentage of EGFP-positive cells (EGFP+) relative to the whole ventricular cell population (a), Ki67 and EGFP double-positive cells (Ki67+EGFP+) relative to the whole EGFP+ population (b), MHC and EGFP double-positive cells (MHC+EGFP+) relative to the whole EGFP+ population (c), and factor VIII and EGFP double-positive cells (factor VIII+EGFP+) relative to the whole EGFP+ population (d) as assessed by FACS. *P<0.05 versus WTuM, P<0.05 versus vehicle vselMSCs, P<0.05 versus HIF-2α or Oct4 overexpression, §P<0.05 versus vselMSCs with HIF-2α or Oct4 silencing, ||P<0.05 versus HIF-2α and Oct4 co-overexpression (n=5 per group). (eh) Representative phenotype of gated EGFP+ (e), Ki67+EGFP+ (f), MHC+EGFP+ (g), and factor VIII+EGFP+ cells (h) evaluated by FACS in WTuM, vehicle vselMSCs, HIF-2α- or Oct4-overexpressing vselMSCs, and HIF-2α- or Oct4-silenced vselMSCs. (i and j) Immunofluorescence staining showing that transplanted cells expressed MHC (i) and factor VIII (j). The transplanted cells were pre-labeled with EGFP (green); the nuclei were stained with DAPI (blue), and the cytoplasm of the myocardiocytes or blood endothelial cells was stained red with anti-MHC or anti-factor VIII, respectively. Engrafted EGFP-pre-labeled cells expressing MHC or factor VIII were the most numerous in the HIF-2α+siOct4+vselMSCs, followed by that in cells overexpressing HIF-2α or Oct4, and were lowest in HIF-2α- or Oct4-silenced vselMSCs (arrows)

Similar articles

Cited by

References

    1. Perin EC, Borow KM, Silva GV, DeMaria AN, Marroquin OC, Huang PP et al. A phase II dose-escalation study of allogeneic mesenchymal precursor cells in patients with ischemic or nonischemic heart failure. Circ Res 2015; 117: 576–584. - PubMed
    1. Dixit P, Katare R. Challenges in identifying the best source of stem cells for cardiac regeneration therapy. Stem Cell Res Ther 2015; 6: 26. - PMC - PubMed
    1. Williams AR, Hare JM. Mesenchymal stem cells: biology, pathophysiology, translational findings, and therapeutic implications for cardiac disease. Circ Res 2011; 109: 923–940. - PMC - PubMed
    1. Tran N, Li Y, Maskali F, Antunes L, Maureira P, Laurens MH et al. Short-term heart retention and distribution of intramyocardial delivered mesenchymal cells within necrotic or intact myocardium. Cell Transplant 2006; 15: 351–358. - PubMed
    1. Chen YB, Lan YW, Chen LG, Huang TT, Choo KB, Cheng WT et al. Mesenchymal stem cell-based HSP70 promoter-driven VEGFA induction by resveratrol alleviates elastase-induced emphysema in a mouse model. Cell Stress Chaperones 2015; 20: 979–989. - PMC - PubMed

MeSH terms

Substances