

Modelling coffee leaf rust risk in Colombia with climate reanalysis data
- PMID: 28080984
- PMCID: PMC5095537
- DOI: 10.1098/rstb.2015.0458
Modelling coffee leaf rust risk in Colombia with climate reanalysis data
Abstract
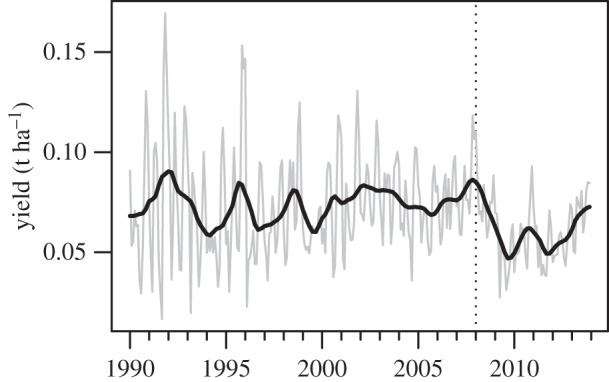
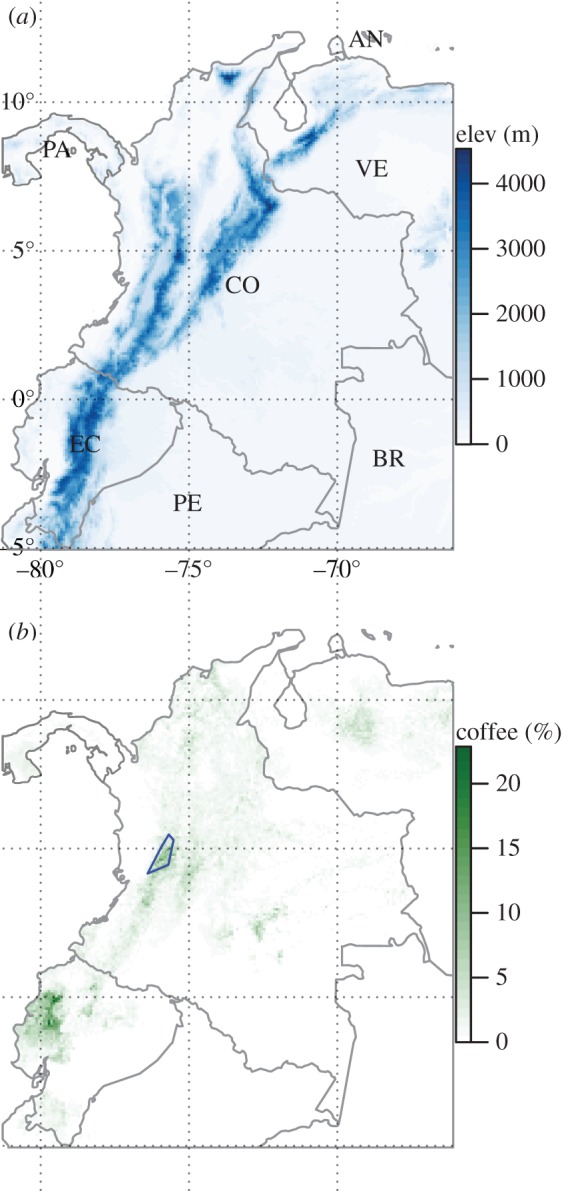
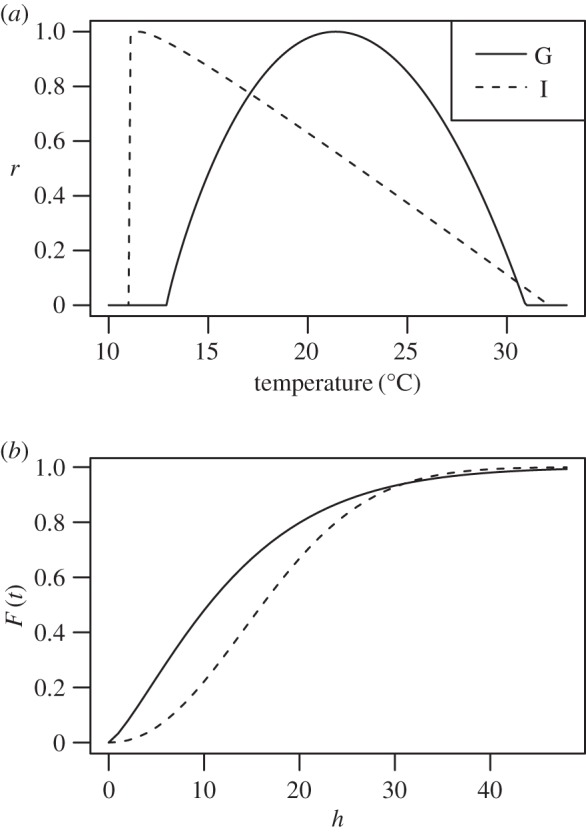
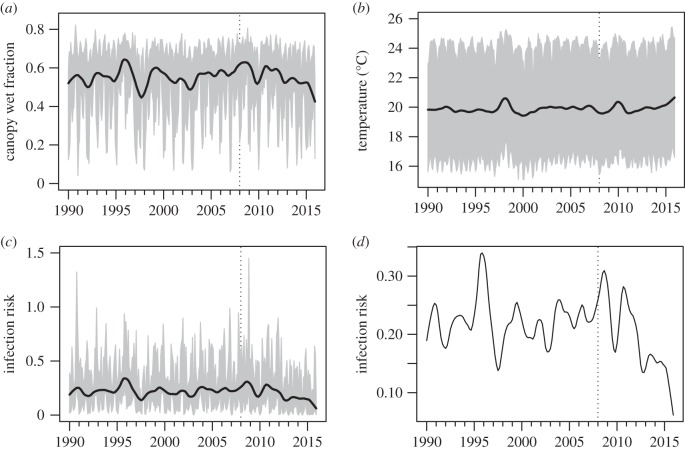
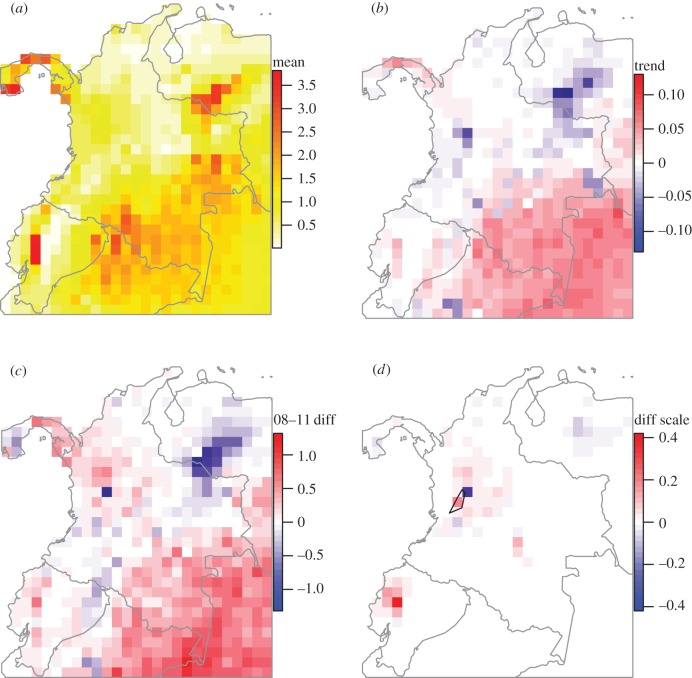
Many fungal plant diseases are strongly controlled by weather, and global climate change is thus likely to have affected fungal pathogen distributions and impacts. Modelling the response of plant diseases to climate change is hampered by the difficulty of estimating pathogen-relevant microclimatic variables from standard meteorological data. The availability of increasingly sophisticated high-resolution climate reanalyses may help overcome this challenge. We illustrate the use of climate reanalyses by testing the hypothesis that climate change increased the likelihood of the 2008-2011 outbreak of Coffee Leaf Rust (CLR, Hemileia vastatrix) in Colombia. We develop a model of germination and infection risk, and drive this model using estimates of leaf wetness duration and canopy temperature from the Japanese 55-Year Reanalysis (JRA-55). We model germination and infection as Weibull functions with different temperature optima, based upon existing experimental data. We find no evidence for an overall trend in disease risk in coffee-growing regions of Colombia from 1990 to 2015, therefore, we reject the climate change hypothesis. There was a significant elevation in predicted CLR infection risk from 2008 to 2011 compared with other years. JRA-55 data suggest a decrease in canopy surface water after 2008, which may have helped terminate the outbreak. The spatial resolution and accuracy of climate reanalyses are continually improving, increasing their utility for biological modelling. Confronting disease models with data requires not only accurate climate data, but also disease observations at high spatio-temporal resolution. Investment in monitoring, storage and accessibility of plant disease observation data are needed to match the quality of the climate data now available.This article is part of the themed issue 'Tackling emerging fungal threats to animal health, food security and ecosystem resilience'.
Keywords: climate change; climate reanalysis; coffee leaf rust; epidemiology; food security; plant pathology.
© 2016 The Authors.
Figures
References
-
- Bebber DP, Holmes T, Gurr SJ. 2014. The global spread of crop pests and pathogens. Glob. Ecol. Biogeogr. 23, 1398–1407. ( 10.1111/geb.12214) - DOI
-
- Patpour M, et al. 2015. First report of the Ug99 race group of wheat stem rust, Puccinia graminis f. sp. tritici, in Egypt in 2014. Plant Dis. 100, 863 ( 10.1094/PDIS-08-15-0938-PDN) - DOI
-
- Funes C, et al. 2015. First report of orange rust of sugarcane caused by Puccinia kuehnii in Argentina. Plant Dis. 100, 861 ( 10.1094/PDIS-09-15-1099-PDN) - DOI
Publication types
MeSH terms
LinkOut - more resources
Full Text Sources
Other Literature Sources
Medical