Leading Causes of Death in Nonmetropolitan and Metropolitan Areas- United States, 1999-2014
- PMID: 28081058
- PMCID: PMC5829895
- DOI: 10.15585/mmwr.ss6601a1
Leading Causes of Death in Nonmetropolitan and Metropolitan Areas- United States, 1999-2014
Erratum in
-
Errrata: Vol. 66, Nos. SS-1 and SS-2.MMWR Morb Mortal Wkly Rep. 2017 Jan 27;66(3):93. doi: 10.15585/mmwr.mm6603a11. MMWR Morb Mortal Wkly Rep. 2017. PMID: 28125571 Free PMC article.
Abstract
Problem/condition: Higher rates of death in nonmetropolitan areas (often referred to as rural areas) compared with metropolitan areas have been described but not systematically assessed.
Period covered: 1999-2014 DESCRIPTION OF SYSTEM: Mortality data for U.S. residents from the National Vital Statistics System were used to calculate age-adjusted death rates and potentially excess deaths for nonmetropolitan and metropolitan areas for the five leading causes of death. Age-adjusted death rates included all ages and were adjusted to the 2000 U.S. standard population by the direct method. Potentially excess deaths are defined as deaths among persons aged <80 years that exceed the numbers that would be expected if the death rates of states with the lowest rates (i.e., benchmark states) occurred across all states. (Benchmark states were the three states with the lowest rates for each cause during 2008-2010.) Potentially excess deaths were calculated separately for nonmetropolitan and metropolitan areas. Data are presented for the United States and the 10 U.S. Department of Health and Human Services public health regions.
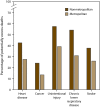
Results: Across the United States, nonmetropolitan areas experienced higher age-adjusted death rates than metropolitan areas. The percentages of potentially excess deaths among persons aged <80 years from the five leading causes were higher in nonmetropolitan areas than in metropolitan areas. For example, approximately half of deaths from unintentional injury and chronic lower respiratory disease in nonmetropolitan areas were potentially excess deaths, compared with 39.2% and 30.9%, respectively, in metropolitan areas. Potentially excess deaths also differed among and within public health regions; within regions, nonmetropolitan areas tended to have higher percentages of potentially excess deaths than metropolitan areas.
Interpretation: Compared with metropolitan areas, nonmetropolitan areas have higher age-adjusted death rates and greater percentages of potentially excess deaths from the five leading causes of death, nationally and across public health regions.
Public health action: Routine tracking of potentially excess deaths in nonmetropolitan areas might help public health departments identify emerging health problems, monitor known problems, and focus interventions to reduce preventable deaths in these areas.
Figures


References
-
- Kusmin L. Rural America at a glance, 2015 edition. Economic Information Bulletin No. (EIB-145). Washington, DC: US Department of Agriculture; 2015.
-
- Eberhardt MS, Ingram DD, Makuc DM, et al. Urban and rural health chartbook. Health, United States, 2001. Hyattsville, MD: National Center for Health Statistics, CDC; 2001.
-
- Meit M, Knudson A, Gilbert T, et al. The 2014 update of the rural-urban chartbook. Grand Forks, ND: Rural Health Reform Policy Research Center; 2014.
-
- Agency for Healthcare Research and Quality. 2014 national healthcare quality and disparities report chartbook on rural health care. AHRQ Pub. No. 15–0007–9-EF. Rockville, MD: Agency for Healthcare Research and Quality; 2015.
MeSH terms
LinkOut - more resources
Full Text Sources
Other Literature Sources
Medical
Research Materials
