. 2017 Jan 12;12(1):e0169753.
doi: 10.1371/journal.pone.0169753. eCollection 2017.

Bacterial Communities Associated with Houseflies (Musca domestica L.) Sampled within and between Farms

Affiliations

Bacterial Communities Associated with Houseflies (Musca domestica L.) Sampled within and between Farms

Simon Bahrndorff et al. PLoS One. .

Abstract

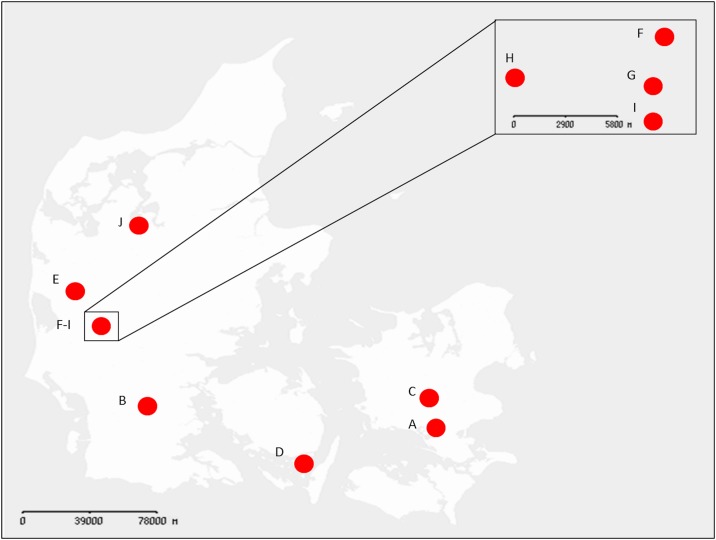
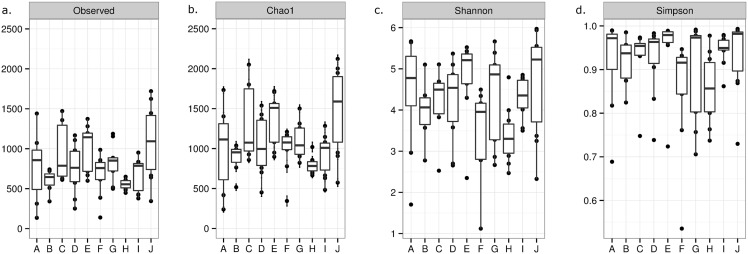
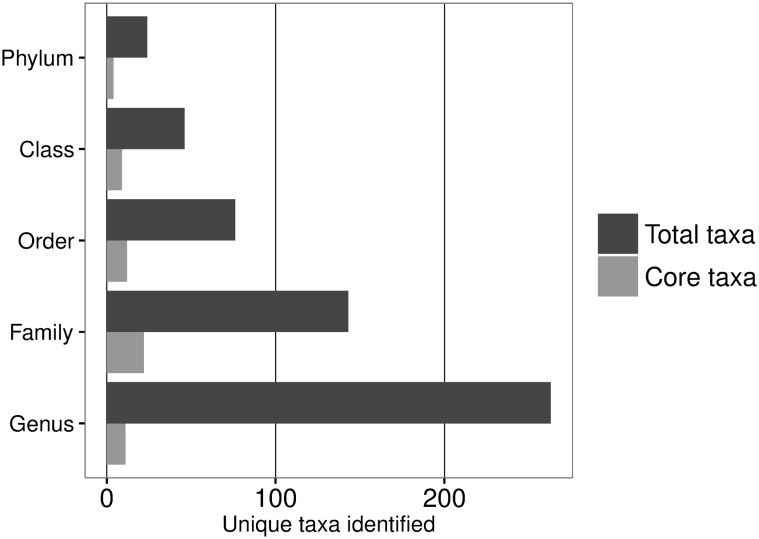
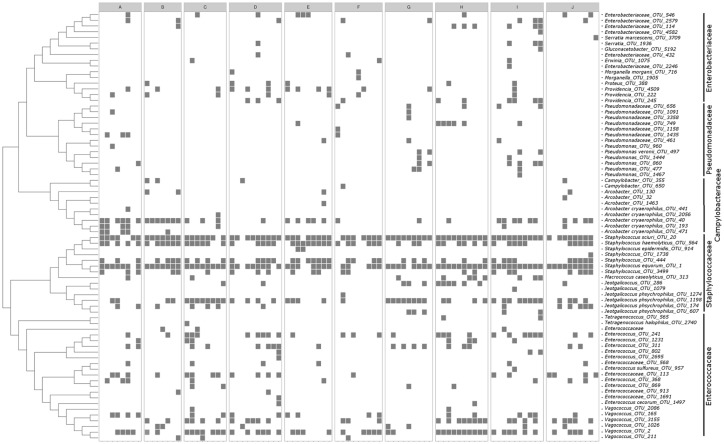
The housefly feeds and reproduces in animal manure and decaying organic substances and thus lives in intimate association with various microorganisms including human pathogens. In order to understand the variation and association between bacteria and the housefly, we used 16S rRNA gene amplicon sequencing to describe bacterial communities of 90 individual houseflies collected within and between ten dairy farms in Denmark. Analysis of gene sequences showed that the most abundant classes of bacteria found across all sites included Bacilli, Clostridia, Actinobacteria, Flavobacteria, and all classes of Proteobacteria and at the genus level the most abundant genera included Corynebacterium, Lactobacillus, Staphylococcus, Vagococcus, Weissella, Lactococcus, and Aerococcus. Comparison of the microbiota of houseflies revealed a highly diverse microbiota compared to other insect species and with most variation in species richness and diversity found between individuals, but not locations. Our study is the first in-depth amplicon sequencing study of the housefly microbiota, and collectively shows that the microbiota of single houseflies is highly diverse and differs between individuals likely to reflect the lifestyle of the housefly. We suggest that these results should be taken into account when addressing the transmission of pathogens by the housefly and assessing the vector competence variation under natural conditions.


Conflict of interest statement

The authors have declared that no competing interests exist.

Figures

Fig 1
Fig 1. Map of locations from where flies were collected.
From each location (red circles) the microbiota of 7–10 male flies were established (A = 8; B = 7; C = 8; D = 10; E = 9; F = 9; G = 9; H = 10; I = 10; J = 10). Locations are designated with a letter (A-J). DNA was extracted from whole flies. In total 10 locations (dairy farms) were sampled throughout Denmark, where 4 locations (F-I) were in close proximity of each other (< 10 km). A GeoDanmark Basis map was downloaded from the Danish “Geodatastyrelsen”, October 2016, Styrelsen for Dataforsyning og Effektivisering. The figure is similar, but not identical to the original image, and is therefore for illustrative purposes only.
Fig 2
Fig 2. Diversity measurements of the bacterial communities of houseflies sampled across location.
Boxplot displaying the observed number of OTUs (a), richness (b; Chao1), evenness (c; Shannon’s index) and biodiversity (d; Simpson’s index) per location (A-J) of sampling (n = 7–10). The boxplot bounds the interquartile range (IQR) divided by the median, the whiskers extend to 1.5x IQR beyond the box.
Fig 3
Fig 3. Principal coordinate analysis (PCoA) of the housefly microbiota.
PCoA of unweighted UniFrac distances between samples. Samples are colored by location and designated as A-J. OTUs with an abundant (>0.1% of total reads in at least 1 sample) presence were included in the analysis.
Fig 4
Fig 4. Composition and abundance of the housefly microbiota.
Heatmap (mean ± SD) representing the 20 bacterial classes (sorted by phylum) with the highest relative abundance. Samples are sorted by location.
Fig 5
Fig 5. Barplot displaying number of abundant and core taxa of the housefly microbiota per taxonomic level.
The total number of abundant taxa was defined as >0.1% abundance in at least 1 sample (dark grey) and core taxa as occurring and abundant in 80% of all samples (grey). OTUs with an abundant (>0.1% of total reads in at least 1 sample) presence were included in the analysis.
Fig 6
Fig 6. Phylogenetic tree and heatmap of selected families.
Heatmap displaying the abundant occurrence (present/non present) of the OTUs identified from each family, Enterobacteriaceae, Pseudomonadaceae, Campylobacteraceae, Staphylococcaceae, and Enterococcaceae. Samples are ordered via a UPGMA based phylogenetic tree based on their 16S rRNA gene consensus sequences. Some OTUs were only identified to family (f = family). OTUs with an abundant (>0.1% of total reads in at least 1 sample) presence were included in the analysis.

References

    1. Bahrndorff S, Alemu T, Alemneh T, Nielsen JL. The microbiome of animals: Implications for conservation biology. Int J Genomics. 2016; 1–7. - PMC - PubMed
    1. Cerf-Bensussan N, Gaboriau-Routhiau V. The immune system and the gut microbiota: Friends or foes? Nat Rev Immunol. 2010;10: 735–744. 10.1038/nri2850 - DOI - PubMed
    1. Meister S, Kanzok SM, Zheng X, Luna C, Li T, Hoa NT, et al. Immune signaling pathways regulating bacterial and malaria parasite infection of the mosquito Anopheles gambiae. Proc Natl Acad Sci. 2005;102: 11420–11425. 10.1073/pnas.0504950102 - DOI - PMC - PubMed
    1. Bahrndorff S, Gill C, Lowenberger C, Skovgård H, Hald B. The effects of temperature and innate immunity on transmission of Campylobacter jejuni (Campylobacterales: Campylobacteraceae) between life stages of Musca domestica (Diptera: Muscidae). J Med Entomol. 2014;51: 670–677. - PubMed
    1. Bosio CF, Beaty BJ, Black WC IV. Quantitative genetics of vector competence for dengue-2 virus in Aedes aegypti. Am J Trop Med Hyg. 1998;59: 965–970. - PubMed

Substances

LinkOut - more resources