. 2017 Mar 1;312(3):G283-G299.
doi: 10.1152/ajpgi.00205.2016. Epub 2017 Jan 12.

Hepatocyte-specific PPARA expression exclusively promotes agonist-induced cell proliferation without influence from nonparenchymal cells

Affiliations

Hepatocyte-specific PPARA expression exclusively promotes agonist-induced cell proliferation without influence from nonparenchymal cells

Chad N Brocker et al. Am J Physiol Gastrointest Liver Physiol. .

Abstract

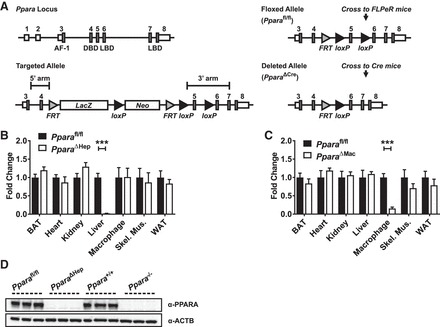
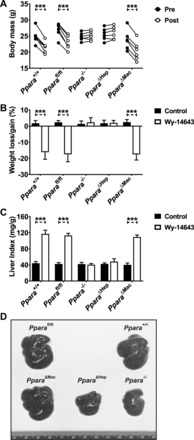
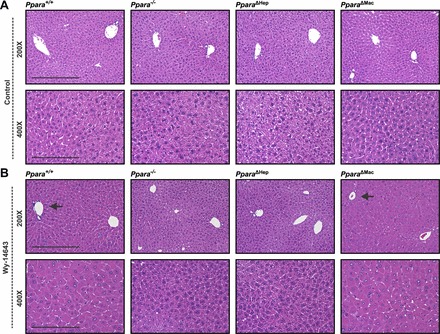
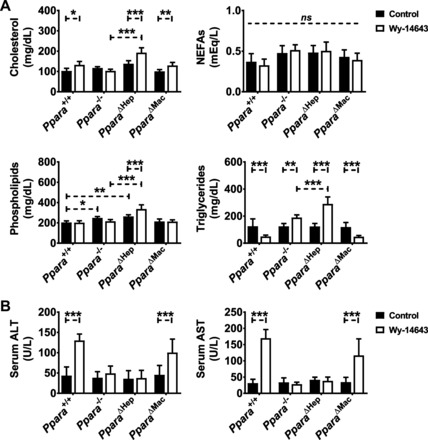
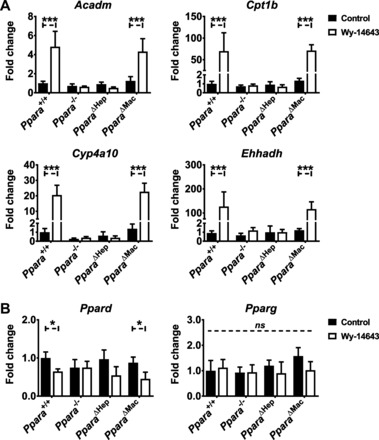
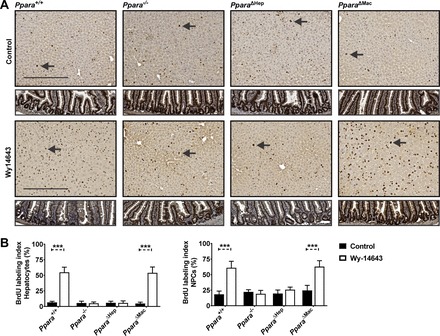
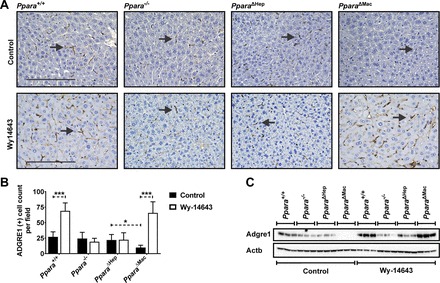
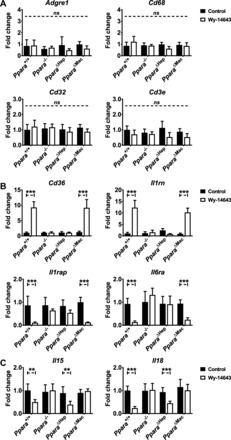
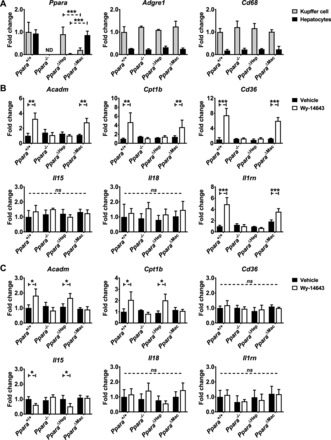
Peroxisome proliferator-activated receptor-α (PPARA) is a nuclear transcription factor and key mediator of systemic lipid metabolism. Prolonged activation in rodents causes hepatocyte proliferation and hepatocellular carcinoma. Little is known about the contribution of nonparenchymal cells (NPCs) to PPARA-mediated cell proliferation. NPC contribution to PPARA agonist-induced hepatomegaly was assessed in hepatocyte (Ppara△Hep)- and macrophage (Ppara△Mac)-specific Ppara null mice. Mice were treated with the agonist Wy-14643 for 14 days, and response of conditional null mice was compared with conventional knockout mice (Ppara-/- ). Wy-14643 treatment caused weight loss and severe hepatomegaly in wild-type and Ppara△Mac mice, and histological analysis revealed characteristic hepatocyte swelling; Ppara△Hep and Ppara-/- mice were protected from these effects. Ppara△Mac serum chemistries, as well as aspartate aminotransferase and alanine aminotransferase levels, matched wild-type mice. Agonist-treated Ppara△Hep mice had elevated serum cholesterol, phospholipids, and triglycerides when compared with Ppara-/- mice, indicating a possible role for extrahepatic PPARA in regulating circulating lipid levels. BrdU labeling confirmed increased cell proliferation only in wild-type and Ppara△Mac mice. Macrophage PPARA disruption did not impact agonist-induced upregulation of lipid metabolism, cell proliferation, or DNA damage and repair-related gene expression, whereas gene expression was repressed in Ppara△Hep mice. Interestingly, downregulation of inflammatory cytokines IL-15 and IL-18 was dependent on macrophage PPARA. Cell type-specific regulation of target genes was confirmed in primary hepatocytes and Kupffer cells. These studies conclusively show that cell proliferation is mediated exclusively by PPARA activation in hepatocytes and that Kupffer cell PPARA has an important role in mediating the anti-inflammatory effects of PPARA agonists.

Keywords: Kupffer cell; Wy-14643; fibrate; peroxisome proliferator-activated receptor-α; proliferation.


Figures

Fig. 1.
Fig. 1.
Characterization of tissue-specific peroxisome proliferator-activated receptor-α (Ppara) knockout mice. Gene targeting strategy for generation of floxed Ppara locus (A). Albumin (AlbCre)- and lysozyme 2 (LysMCre)-regulated Cre lines were used to generate hepatocyte-specific (Ppara△Hep) or macrophage-specific (Ppara△Mac) knockout mice, respectively. Tissues were isolated from mice, and qRT-PCR was used to confirm loss of tissue-specific Ppara mRNA expression in Ppara△Hep (B) and Ppara△Mac (C) mice. Values were normalized to Actb mRNA levels and expressed as fold control, Ppara wild-type (Ppara+/+), or Ppara floxed (Pparafl/fl), as indicated. Hepatocyte nuclei were isolated from Ppara+/+, Pparafl/fl, conventional Ppara-null (Ppara−/−), and Ppara△Hep mouse livers. Lysate (50 µg) was separated by SDS-PAGE, and Western blotting was performed to determine PPARA protein expression (D). Blots were reprobed for ACTB as loading control. Experiments were performed on at least 5 animals/group for qRT-PCR experiments. Each data point represents the mean ± SD (***P < 0.001). AF-1, activation function 1 domain; DBD, DNA-binding domain; LBD, ligand-binding domain.
Fig. 2.
Fig. 2.
Hepatocyte-specific disruption of Ppara protects against agonist-induced weight loss and hepatomegaly. Ppara+/+, Pparafl/fl, and Ppara△Mac mice exhibited analogous body mass loss after 14 days Wy-14643 treatment (A). Weight loss (%) between these groups was not significantly different (B). Wy-14643-treated Ppara−/− and Ppara△Hep mice did not lose body mass and experienced slight weight gains similar to controls. Wy-14643-treated Ppara+/+, Pparafl/fl, and Ppara△Mac mouse liver indexes (mg liver/g body mass) support hepatomegaly in these groups (C). Severity of hepatomegaly is evident by gross liver examination (D). Ppara−/− and Ppara△Hep mice are completely protected from these effects. Experiments were performed on at least 5 animals/group. Each data point represents the mean ± SD (***P < 0.001).
Fig. 3.
Fig. 3.
Wy-14643-induced hepatocyte hypertrophy is dependent on hepatocyte-specific Ppara expression. Histological analysis by hematoxylin and eosin (H&E) staining of formalin-fixed paraffin-embedded tissues revealed no obvious structural differences between various genotypes on control diet (A). Fourteen-day treatment with Wy-14643 caused pronounced and predominantly centrilobular hepatocellular hypertrophy (arrows) in livers of Ppara+/+ and Ppara△Mac mice (B). Ppara−/− and Ppara△Hep mice were protected from Wy-14643-induced hepatocyte swelling. Representative images are shown. At least 4 mice were analyzed/genotype and treatment group.
Fig. 4.
Fig. 4.
Macrophage PPARA expression does not influence physiological response to Wy-14643. Serum was collected from mice treated with either control diet or diet containing 0.1% Wy-14643 for 14 days. Circulating total cholesterol, triglycerides, phospholipids, and nonesterified free fatty acids (NEFA) were analyzed (A). Ppara△Mac mouse response paralleled wild-type animals. Cholesterol levels (A) were slightly elevated in these groups, and triglyceride levels were significantly reduced after Wy-14643 treatment. NEFA and phospholipids remained unchanged. Interestingly, cholesterol, phospholipid, and triglyceride levels were elevated in hepatocyte-specific knockout mice after Wy-14643. Serum alanine aminotransferase (ALT) and aspartate aminotransferase (AST) levels (B) were significantly elevated in Wy-14643-treated Ppara+/+ and Ppara△Mac mice, indicating liver damage. Ppara−/− or Ppara△Hep mice were protected from these effects. Experiments were performed on at least 5 mice/group. Each data point represents the mean ± SD (*P < 0.05, **P < 0.01, and ***P < 0.001). ns, No significant differences.
Fig. 5.
Fig. 5.
Hepatocyte PPARA activation exclusively controls lipid metabolism-related pathways. Mice were treated with Wy-14643 for 14 days, and liver RNA was isolated for qRT-PCR analysis. PPARA target genes involved in lipid metabolism were assayed, and values were normalized to Actb expression and then expressed as fold change from wild-type control groups. β-Oxidation-related genes Acadm, carnitine palmitoyltransferase 1 (Cpt1b), cytochrome P-450 4a10 (Cyp4a10), and enoyl-CoA hydratase/3-hydroxyacyl CoA dehydrogenase (Ehhadh) were upregulated significantly in Ppara+/+ and Ppara△Mac mice treated with Wy-14643 (A). Ppara−/− or Ppara△Hep mice did not exhibit altered mRNA levels in response to treatment. Compensatory upregulation of the Ppara homologs peroxisome proliferator-activated receptor-γ (Pparg) and peroxisome proliferator-activated receptor-β/δ (Ppard) was not observed in any genotype or treatment group (B). Experiments were performed on at least 5 mice/group. Each data point represents the mean ± SD (*P < 0.05 and ***P < 0.001).
Fig. 6.
Fig. 6.
BrdU staining indicates proliferation is dependent on hepatocyte-specific PPARA activation. BrdU pumps were implanted sc following 7 days of Wy-14643 treatment. Mice were treated for an additional 7 days after implantation (14 days total). Sections were stained for BrdU incorporation (dark brown foci) and counterstained with hematoxylin for visualization of nuclei (light purple) (A). Examples of hepatocyte nuclei BrdU staining are indicated by arrows. Representative images are shown for each genotype and treatment group. Intestinal epithelium was included (bottom) as a positive control for BrdU staining of proliferating cells. BrdU labeling indexes were calculated for hepatocyte and nonparenchymal cell (NPC) nuclei (B). Increases in staining for both hepatocytes and NPCs were dependent on hepatocyte-specific PPARA activation. Ten microscope fields (×200)/mouse were analyzed for BrdU-positive nuclei. Proliferation index is represented as the average number of BrdU-positive cells (%)/field of view. Experiments were performed on at least 5 animals/group. Each data point represents the mean ± SD (***P < 0.001).
Fig. 7.
Fig. 7.
Markers for cell proliferation and DNA damage/repair are not affected by NPC PPARA activation. Mice were treated with Wy-14643 for 14 days, and liver RNA was isolated for qRT-PCR analysis. Markers for cell proliferation [cyclin B1 (Cnnb1), cyclin-dependent kinase 1 (Cdk1), cyclin D1 (Cnnd1), cyclin G2 (Cnng2), Mki67, Jun proto-oncogene (Jun)] (A) and DNA damage/repair [checkpoint kinase 1 homolog (Chek1), minichromosome maintenance complex component-deficient 2 mitotin 6 (Mcm6), and RAD51 recombinase (Rad51)] (B) were induced significantly in Ppara+/+ and Ppara△Mac mice treated with Wy-14643. Treatment had no effect on gene expression in either Ppara−/− and Ppara△Hep mice, indicating that the proliferative effects are dependent on hepatocyte PPARA activation. mRNA levels were normalized to Actb mRNA and expressed as fold control. Experiments were performed on at least 5 mice/group. Each data point represents the mean ± SD (**P < 0.01 and ***P < 0.001).
Fig. 8.
Fig. 8.
Hepatic ADGRE1-positive macrophages increase in response to prolonged PPARA activation. Immunohistochemistry (IHC) was performed for the general macrophage marker ADGRE1 on liver sections from mice treated with Wy-14643. Nuclei were counterstained with hematoxylin. IHC revealed a pronounced increase in ADGRE1-positive macrophages in livers from wild-type and Ppara△Mac mice treated with Wy-14643 (A). Ten microscope fields (×200)/mouse were analyzed for ADGRE1-positive cells and averaged (B). Liver lysate (50 µg) was separated by SDS-PAGE, and Western blotting was performed to assess ADGRE1 protein levels (C). Blots were reprobed for ACTB as loading control. Experiments were performed on at least 4 mice/group. Each data point represents the mean ± SD (*P < 0.05 and ***P < 0.001).
Fig. 9.
Fig. 9.
Hepatocyte- and macrophage-specific PPARA activation differentially influences inflammation-related gene expression. Mice were treated with Wy-14643 for 14 days, and liver RNA was isolated for qRT-PCR analysis. Inflammation-related genes were assayed, and values were normalized to Actb and then expressed as fold change compared with wild-type controls. Expression of immune cell markers Adgre1, Cd32, Cd68, and Cd3e mRNAs was unaffected by genotype or treatment (A). Hepatocyte-specific PPARA activation controls Cd36 and interleukin-1 receptor antagonist (Il1rn) mRNA induction in response to Wy-14643 treatment and also downregulation of interleukin-1 receptor accessory protein (Il1rap) and interleukin-6 receptor-α (Il6ra, B). Expression levels were unaffected in Wy-14643-treated Ppara−/− or Ppara△Hep groups. Macrophage-specific PPARA activation drives interleukin-15 (Il15) and -18 (Il18) suppression in response to Wy-14643 (C). Downregulation was observed in Wy-14643-treated Ppara+/+ and PparaΔHep mice and unchanged in Ppara−/− and Ppara△Mac mice, supporting a role for macrophage PPARA activation in regulating inflammatory pathways. Experiments were performed on at least 5 animals/group. Basal expression levels for all genes were similar in control groups. Each data point represents the mean ± SD (**P < 0.01 and ***P < 0.001).
Fig. 10.
Fig. 10.
Primary hepatocyte and Kupffer cell cultures confirm differential regulation of Ppara-target gene expression. Primary hepatocyte and Kupffer cell populations were isolated from Ppara+/+, Ppara−/−, Ppara△Hep, and Ppara△Mac mouse livers. Cells were cultured ex vivo and treated with 100 µM Wy-14643 for 16 h. RNA was isolated, and gene expression analysis was performed to elucidate the cell type-specific impact of PPARA activation. Ppara disruption was confirmed in purified hepatocytes from Ppara△Hep mice and Kupffer cells from Ppara△Mac mice (A). Macrophage markers Adgre1 and Cd68 were expressed at similar levels in Kupffer cells from all genotypes. Primary hepatocyte gene expression was assessed after Wy-14643 treatment (B). PPARA target gene mRNAs, including Acadm, Cpt1b, and Cd36, were upregulated. Anti-inflammatory cytokine Il1rn mRNA expression was also upregulated in a hepatocyte-specific Ppara-dependent manner. Kupffer cell cultures revealed slight but significant upregulation of Ppara target gene Acadm and Cpt1b mRNAs and suppression of Il15 mRNA, providing further support for in vivo observations indicating a relationship between macrophage-specific PPARA activation and inflammation (C). Each data point represents the mean ± SD (*P < 0.05, **P < 0.01, and ***P < 0.001). ND, not detectable.

References

    1. Ann SJ, Chung JH, Park BH, Kim SH, Jang J, Park S, Kang SM, Lee SH. PPARα agonists inhibit inflammatory activation of macrophages through upregulation of β-defensin 1. Atherosclerosis 240: 389–397, 2015. doi:10.1016/j.atherosclerosis.2015.04.005. - DOI - PubMed
    1. Bonzo JA, Brocker C, Jiang C, Wang RH, Deng CX, Gonzalez FJ. Hepatic sirtuin 1 is dispensable for fibrate-induced peroxisome proliferator-activated receptor-α function in vivo. Am J Physiol Endocrinol Metab 306: E824–E837, 2014. doi:10.1152/ajpendo.00175.2013. - DOI - PMC - PubMed
    1. Bustin SA, Benes V, Garson JA, Hellemans J, Huggett J, Kubista M, Mueller R, Nolan T, Pfaffl MW, Shipley GL, Vandesompele J, Wittwer CT. The MIQE guidelines: minimum information for publication of quantitative real-time PCR experiments. Clin Chem 55: 611–622, 2009. doi:10.1373/clinchem.2008.112797. - DOI - PubMed
    1. Clausen BE, Burkhardt C, Reith W, Renkawitz R, Förster I. Conditional gene targeting in macrophages and granulocytes using LysMcre mice. Transgenic Res 8: 265–277, 1999. doi:10.1023/A:1008942828960. - DOI - PubMed
    1. Desvergne B, Wahli W. Peroxisome proliferator-activated receptors: nuclear control of metabolism. Endocr Rev 20: 649–688, 1999. - PubMed

LinkOut - more resources