

A CMC1-knockout reveals translation-independent control of human mitochondrial complex IV biogenesis
- PMID: 28082314
- PMCID: PMC5331208
- DOI: 10.15252/embr.201643103
A CMC1-knockout reveals translation-independent control of human mitochondrial complex IV biogenesis
Abstract
Defects in mitochondrial respiratory chain complex IV (CIV) frequently cause encephalocardiomyopathies. Human CIV assembly involves 14 subunits of dual genetic origin and multiple nucleus-encoded ancillary factors. Biogenesis of the mitochondrion-encoded copper/heme-containing COX1 subunit initiates the CIV assembly process. Here, we show that the intermembrane space twin CX9C protein CMC1 forms an early CIV assembly intermediate with COX1 and two assembly factors, the cardiomyopathy proteins COA3 and COX14. A TALEN-mediated CMC1 knockout HEK293T cell line displayed normal COX1 synthesis but decreased CIV activity owing to the instability of newly synthetized COX1. We demonstrate that CMC1 stabilizes a COX1-COA3-COX14 complex before the incorporation of COX4 and COX5a subunits. Additionally, we show that CMC1 acts independently of CIV assembly factors relevant to COX1 metallation (COX10, COX11, and SURF1) or late stability (MITRAC7). Furthermore, whereas human COX14 and COA3 have been proposed to affect COX1 mRNA translation, our data indicate that CMC1 regulates turnover of newly synthesized COX1 prior to and during COX1 maturation, without affecting the rate of COX1 synthesis.
Keywords: CMC1; COX1; complex IV; cytochrome c oxidase; mitochondrial respiratory chain.
© 2017 The Authors.
Figures
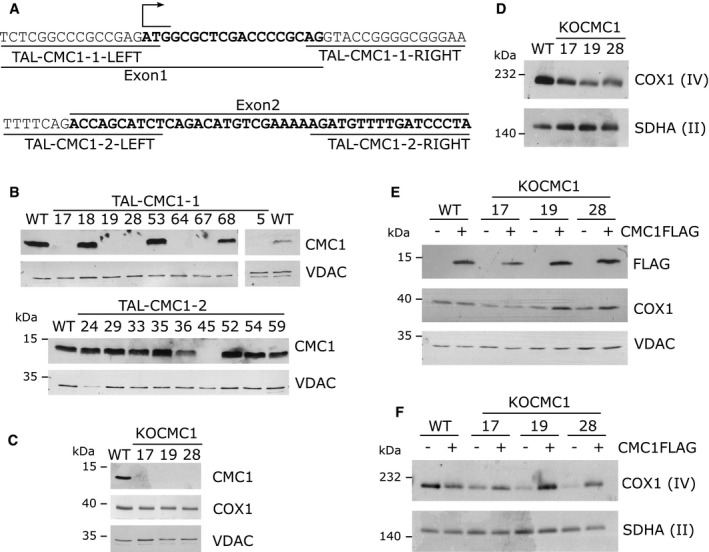
- A
Schematic representation of the first and second exons of the CMC1 locus and the sequences recognition sites of the two TALEN pairs.
- B, C
Immunoblot analysis of the steady‐state levels of (B) CMC1 in HEK293T (WT) and TALEN‐transfected HEK293T cell lines, or (C) COX1 and CMC1 in three KO‐CMC1 clones. VDAC was used as a loading control.
- D
Steady‐state levels of CIV extracted with lauryl maltoside in three KO‐CMC1 clones analyzed by BN–PAGE and detected by immunoblotting with an anti‐COX1 antibody. Complex II (SDHA) serves as a loading control.
- E
Immunoblot analysis in whole‐cell extracts of COX1 and CMC1‐FLAG steady‐state levels in KO‐CMC1 cells carrying an empty plasmid or stably expressing CMC1‐FLAG compared with the parental line (WT).
- F
Steady‐state levels of CIV in three KO‐CMC1 clones carrying an empty plasmid or stably expressing CMC1‐FLAG analyzed as in panel (D).
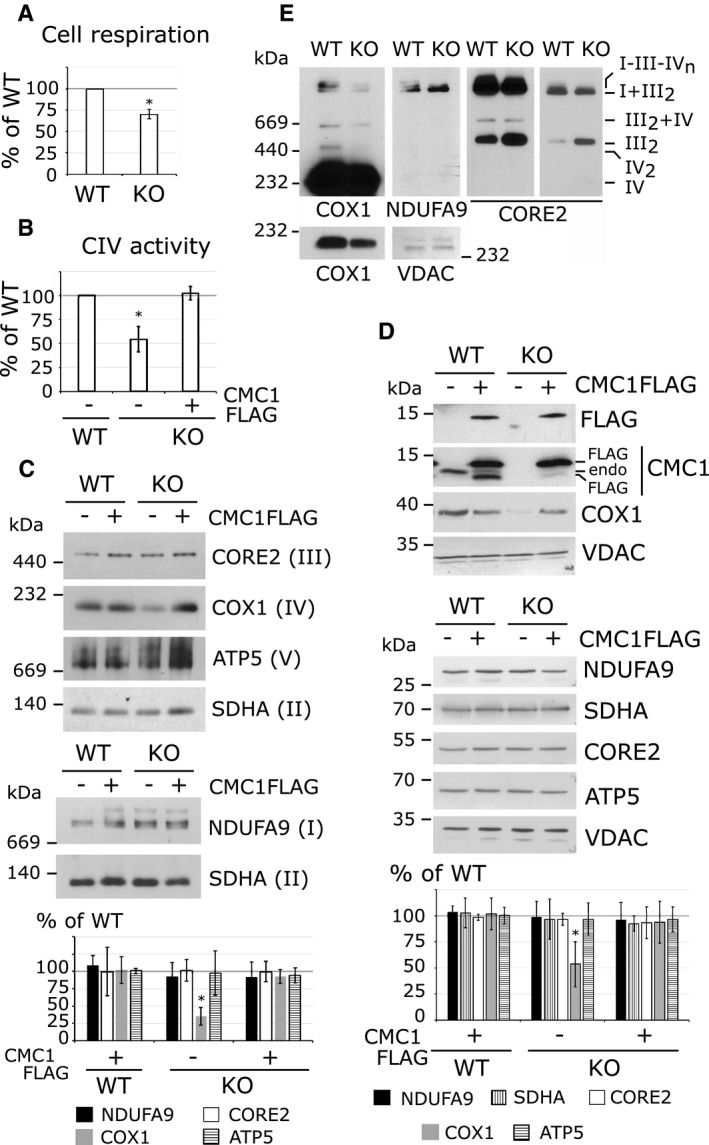
Endogenous cell respiration rate expressed as percentage of the HEK293T control cell line. The bars represent average ± SD. n = 3; t‐test: *P = 0.00066.
Cytochrome c oxidase activity in HEK293T (WT) and KO‐CMC1 cell lines carrying an empty plasmid or stably expressing CMC1‐FLAG. The values are expressed as percentage of the control and normalized by citrate synthase activity. The bars represent average ± SD. n = 3, t‐test: *P = 0.004 for KO, P = 0.6 for KO + CMC1‐FLAG.
Steady‐state levels of OXPHOS complexes extracted with lauryl maltoside in HEK293T and KO‐CMC1 cell lines carrying an empty plasmid or stably expressing CMC1‐FLAG, analyzed by BN–PAGE and detected by immunoblotting with the indicated antibodies. The digitalized signal was quantified using ImageJ program, normalized by SDHA and expressed as percentage of the HEK293T control. The bars represent average ± SD. n = 3 – 10, t‐test: *P = 5 × 10⁻¹¹ for CIV in KO‐CMC1.
Immunoblot analysis of CMC1 and OXPHOS complex subunits in HEK293T and KO‐CMC1 cell lines carrying an empty plasmid or stably expressing CMC1‐FLAG. NDUFA9 is a subunit of complex I, SDHA of CII, CORE2 or CIII and ATP5 of the F1Fo‐ATP synthase. Endo: endogenous. The signal was normalized by VDAC and expressed as percentage of the control. The bars represent average ± SD. n = 4, t‐test: *P = 0.0004 for COX1 in KO‐CMC1.
Steady‐state levels of respiratory chain complexes and supercomplexes extracted with digitonin from HEK293T and KO‐CMC1 cell lines, and analyzed by BN–PAGE. The panels show immunoblots probed with the indicated antibodies. Two different exposure times are presented for COX1 and CORE2. VDAC serves as a loading control.
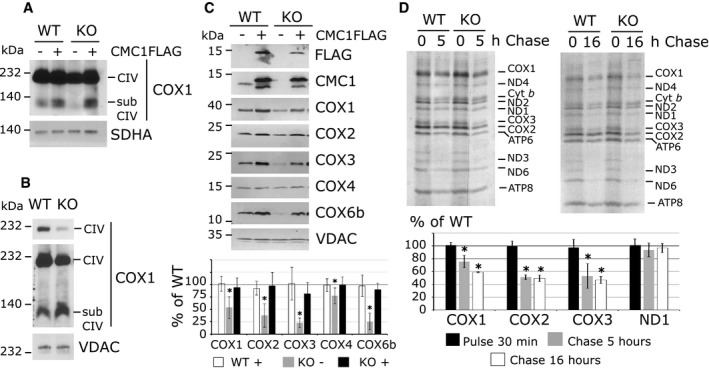
- A, B
Analysis of COX1‐containing complexes in cell lines depleted for CMC1 and expressing CMC1‐FLAG or an empty plasmid. Cells were extracted by lauryl maltoside (A) or digitonin (B), separated by BN–PAGE and analyzed by immunoblotting. subCIV: subcomplexes IV. In (B), two different expositions of COX1 are represented.
- C
Immunoblot analysis of the steady‐state levels of CIV subunits in mitochondria isolated from HEK293T and KO‐CMC1 cells carrying an empty plasmid or stably expressing CMC1‐FLAG. In the graph, the digitalized signal was normalized by VDAC signal and expressed as percentage of the control. The bars represent average ± SD. n = 4–6, t‐test: P is statistically different in KO‐CMC1 cells for COX1 *P = 0.0004, COX2 *P = 0.002, COX3 *P = 5 × 10⁻⁶, COX4 *P = 0.007 and COX6b *P = 0.0001.
- D
Mitochondrial translation products were pulse‐labeled in HEK293T and KO‐CMC1 cells with [35S]‐methionine for 30 min in the presence of emetine to inhibit cytosolic translation. In pulse experiments, the cells were then washed and incubated with fresh complete culture media for 5 or 16 h. The radiolabeled mitochondrial proteins were separated by SDS–PAGE and visualized by autoradiography. In the graph, the radiolabeled signals were quantified as explained in Fig 2C, normalized by Cyt b and expressed as % of wild type (WT). The bars represent average ± SD. n = 2 – 4; t‐test: in reading order for 5‐h chase and 16‐h chase P = 0.0005, 2 × 10⁻⁵, 1 × 10⁻⁵, 0.0004, 0.001, 0.001, 0.3, 0.6.
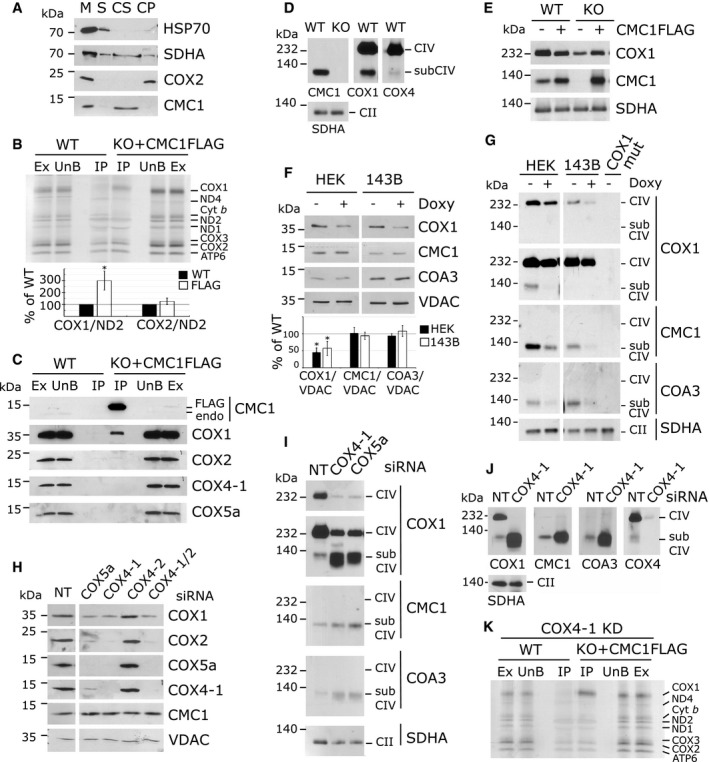
- A
Test of CMC1 solubility by mild sonication and alkaline carbonate extraction. Mitochondria (M) isolated from HEK293T cells were sonicated, and the soluble (S) and membrane‐bound fractions were separated by centrifugation. The pellet was subsequently extracted with alkaline sodium carbonate and fractionated into supernatant (CS) and pellet (CP). The different fractions were analyzed by immunoblotting using antibodies that recognized CMC1 and the controls COX2 (membrane protein), SDHA (loosely bound to the inner membrane), and HSP70 (soluble protein).
- B
Mitochondrial translation products were pulse‐labeled in HEK293T (WT) and KO‐CMC1 + CMC1‐FLAG cells for 30 min. CMC1‐FLAG was immunoprecipitated using anti‐FLAG beads. IP is 15× enriched. Ex: extract/input; UnB: unbound/flow through; IP: immunoprecipitation. In the graph, COX1 and COX2 were quantified, normalized by ND2 and expressed relatively to the control. The bars represent average ± SD. n = 3; t‐test: *P = 0.008 for COX1, P = 0.17 for COX2.
- C
Immunoprecipitation of CMC1‐FLAG from a KO‐CMC1 + CMC1‐FLAG stable cell line using anti‐FLAG‐conjugated beads. Samples were separated by SDS–PAGE and immunoblotted with antibodies. HEK293T (WT) extracts were used as a negative control. IP is 40× enriched. Endo: endogenous.
- D, E
BN–PAGE analysis of HEK293T (WT), KO‐CMC1, and KO‐CMC1 + CMC1‐FLAG cells extracted with lauryl maltoside. The blots were probed with CMC1, COX1, COX4‐1, and SDHA antibodies.
- F
SDS–PAGE and immunoblot analysis of HEK293T and 143B cells treated 24 h with doxycycline. COX1, CMC1, and COA3 were quantified, normalized by VDAC and expressed relatively to the untreated sample. The bars represent average ± SD. n = 4 or 5, t‐test: from left to right: P = 0.00001; 0.006; 0.8; 0.3; 0.08; and 0.3.
- G
BN–PAGE analysis of cell extracts prepared as in (D and E) from HEK293T, 143B, or 143B‐COX1 mutant cells, following 24‐h inhibition of mitochondrial protein synthesis with doxycycline or left untreated. Two different exposure times are presented for COX1.
- H
SDS–PAGE and immunoblot analysis in HEK293T cells transfected for 3 days with non‐targeting (NT), COX4‐1, COX4‐2, COX4‐1 and COX4‐2 together or COX5a siRNAs.
- I, J
BN–PAGE and immunoblot analysis of CIV subassemblies (subCIV) in cellular extracts from HEK293T cells transfected with non‐targeting (NT), COX4‐1 or COX5a siRNAs for 3 (I) or 6 days (J). Two different exposure times are presented for COX1 (I).
- K
As (B) but after 24 h of COX4‐1 knockdown by siRNA.
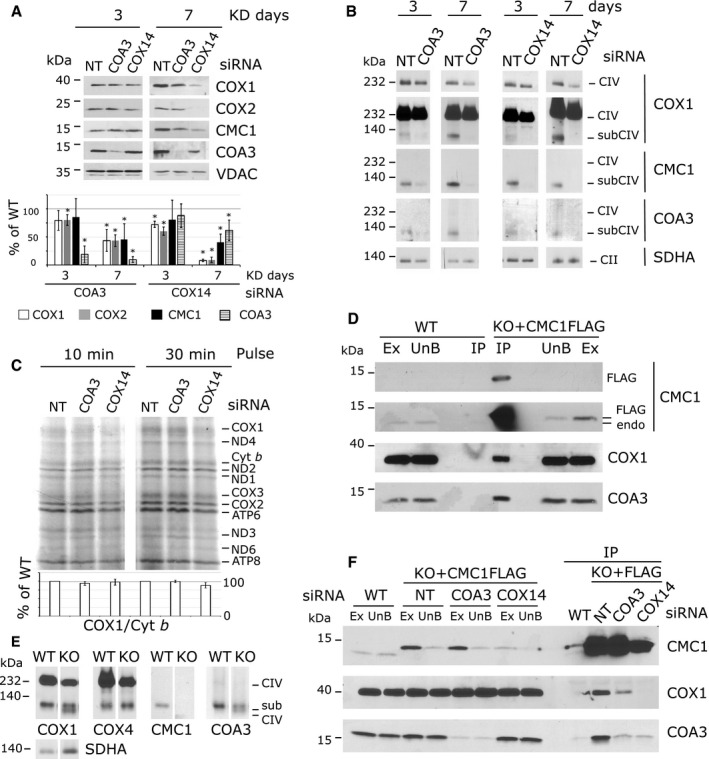
SDS–PAGE and immunoblot analysis in HEK293T cells after 3 and 7 days of transfection with by non‐targeting (NT), COX14, or COA3 siRNA to knock down their expression. The signal was normalized by VDAC and expressed as percentage of the non‐targeted control. The bars represent average ± SD. n = 3 – 6, t‐test: in reading order P = 0.06; 0.007; 0.9; 4 × 10⁻⁵; 0.008; 0.0007; 0.03; 7 × 10⁻⁶; 2 × 10⁻⁷; 4 × 10⁻⁷; 0.2; 0.2; 2 × 10⁻⁷; 5 × 10⁻⁶; 0.002; 0.02.
BN–PAGE and immunoblot analysis of CMC1, COA3, and COX1 in the same samples as (A). Two different expositions are presented for COX1.
Mitochondrial protein synthesis after a 10‐ or 30‐min pulse with [35S]‐methionine in cells knocked down for 3 days. In the lower panel, the radiolabeled signal was quantified as in Fig 3 and expressed as percentage of the control. The bars represent average ± SD. n = 3, t‐test: P = 0.15; 0.7; 0.8; 0.07 in reading order.
Immunoprecipitation of CMC1‐FLAG in extracts prepared from KO‐CMC1 + CMC1‐FLAG and HEK293T cells using anti‐FLAG‐conjugated agarose beads. Samples were separated by SDS–PAGE and immunoblotted with anti‐FLAG, CMC1, COX1, and COA3 antibodies. Ex: extract; UnB: unbound; IP: immunoprecipitation; endo: endogenous. IP is 40× enriched.
BN–PAGE and immunoblot analysis of CMC1, COX4, COA3, and COX1 complexes in HEK293T (WT) and KO‐CMC1 cells.
Immunoprecipitation of CMC1‐FLAG with FLAG‐conjugated beads from a KO‐CMC1 + CMC1‐FLAG stable cell line after 5 days of transfection with non‐targeting (NT), COX14 or COA3 siRNA to knock down their expression. Samples were separated by SDS–PAGE and immunoblotted with antibodies against CMC1, COX1, and COA3. IP is 40× enriched.
- A
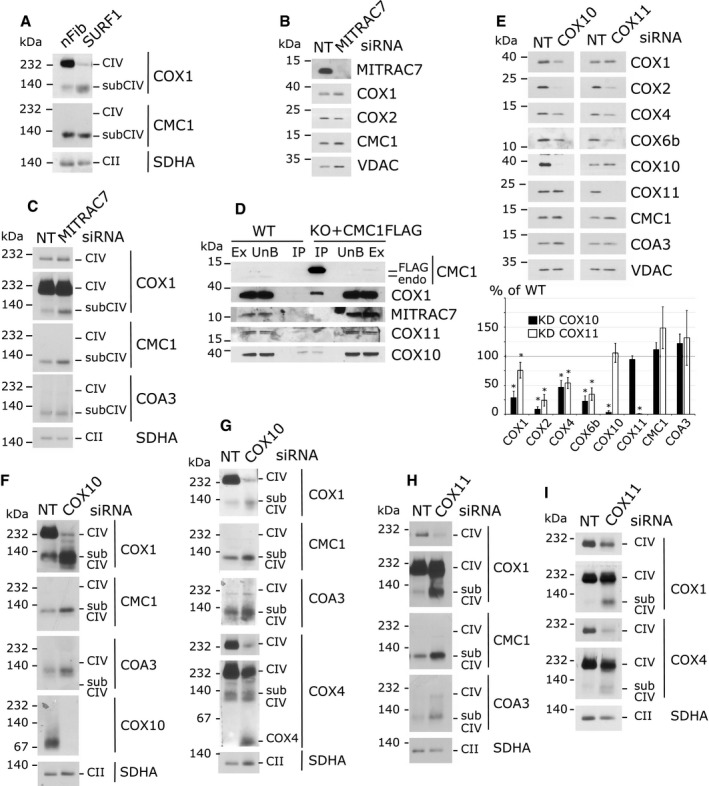
BN‐PAGE and immunoblot analysis of CMC1 and COX1 complexes in control human neonatal fibroblasts (nFib) and SURF1 mutant fibroblast cell extracts.
- B, C
SDS–PAGE (B) or BN–PAGE (C) and immunoblot analysis of the steady‐state levels of the indicated proteins (B) or protein complexes (C) in HEK293T cells transfected for 7 days with non‐targeting (NT) or MITRAC7 siRNAs. Two different exposure times are presented for COX1(C).
- D
Immunoprecipitation of CMC1‐FLAG from a KO‐CMC1 + CMC1‐FLAG stable cell line using anti‐FLAG‐conjugated beads. Samples were separated by SDS–PAGE and immunoblotted with antibodies against CMC1, COX1, MITRAC7, COX10, and COX11. HEK293T (WT) mitochondrial extracts were used as a negative control. Ex: extract; UnB: unbound; IP: immunoprecipitation; endo: endogenous. IP is 40× enriched.
- E
SDS–PAGE and immunoblot analysis of the steady‐state levels of the indicated proteins in HEK293T cells transfected for 7 days with non‐targeting (NT), COX10 or COX11 siRNAs. In the lower panel, the signal was normalized by VDAC and expressed as percentage of the control. The bars represent average ± SD. n = 3 or 4; t‐test: in reading order P = 0.0003, 0.03, 2 × 10⁻⁶, 0.0002, 0.002, 0.001, 0.0002, 0.0005, 2 × 10⁻⁷, 0.6, 0.2, 5 × 10⁻¹⁰, 0.06, 0.07, 0.06, 0.3.
- F–I
BN–PAGE and immunoblot analysis of the steady‐state levels of the indicated complexes in HEK293T cells transfected for 5 (F), 8 (G), or 7 days (H, I) with non‐targeting (NT), COX10 or COX11 siRNAs. Two different exposure times are presented for COX4 (G, I) and COX1 (H, I).
- A, B
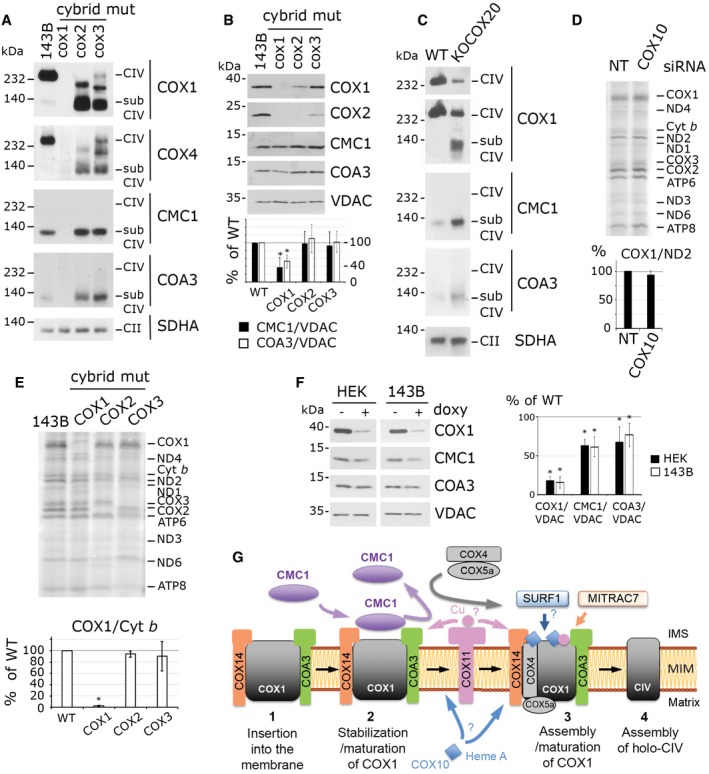
BN–PAGE (A) and SDS–PAGE (B) and immunoblot analysis of CMC1, COA3, COX1, and COX4 complexes and proteins, respectively, in COX1, COX2, and COX3 homoplasmic mutant cells and the parental 143B cell line. CMC1 and COA3 signals were normalized by VDAC and expressed as percentage of the control cell line. CMC1 and COA3 amounts are statistically different from the wild type in COX1 cybrids. The bars represent average ± SD. n = 7; t‐test: *P = 0.000005 for CMC1 and *P = 0.00002 for COA3.
- C
BN–PAGE and immunoblot analysis of CMC1, COA3, and COX1 complexes in KO‐COX20 mutant cells and the parental HEK293T cell line. The two upper panels are two different levels of exposure.
- D
Mitochondrial protein synthesis after a 30‐min pulse with [35S]‐methionine in COX10‐depleted cells. Quantification of COX1, normalized by ND2, is expressed as percentage of the non‐targeted siRNA‐transfected HEK293T cells. The bars represent average ± SD. n = 3, t‐test: P = 0.19.
- E
Mitochondrial protein synthesis after a 20‐min pulse with [35S]‐methionine in the same cell lines as in panel (A). Quantification of COX1 was normalized by Cyt b and expressed as percentage of the control 143B line. The bars represent average ± SD. n = 2; t‐test: *P = 0.00001 in COX1, P = 0.26 in COX2 and P = 0.65 in COX3 cybrids.
- F
SDS–PAGE and immunoblot analysis of CMC1, COA3, and COX1 in 143B or HEK293T doxycycline‐treated cells for 6 days. Quantification was measured, normalized by VDAC and expressed as percentage of untreated cells. The bars represent average ± SD. n = 4 or 5; t‐test: in order in the graph, *P = 7 × 10⁻⁶, 6 × 10⁻⁹, 0.0001, 0.0001, 0.015, 0.008.
- G
Model depicting the role of CMC1 in controlling post‐translational events in COX1 biogenesis. According to our model, newly synthesized COX1 would first bind COX14 and COA3, followed by CMC1. CMC1 would promote COX1 stability during or before COX1 maturation and would be released from the growing COX1 complex before the incorporation of COX4‐1 and COX5a.
References
-
- Ghezzi D, Zeviani M (2012) Assembly factors of human mitochondrial respiratory chain complexes: physiology and pathophysiology. Adv Exp Med Biol 748: 65–106 - PubMed
-
- Fornuskova D, Stiburek L, Wenchich L, Vinsova K, Hansikova H, Zeman J (2010) Novel insights into the assembly and function of human nuclear‐encoded cytochrome c oxidase subunits 4, 5a, 6a, 7a and 7b. Biochem J 428: 363–374 - PubMed
-
- Nijtmans LG, Taanman JW, Muijsers AO, Speijer D, Van den Bogert C (1998) Assembly of cytochrome‐c oxidase in cultured human cells. Eur J Biochem 254: 389–394 - PubMed
Publication types
MeSH terms
Substances
Grants and funding
LinkOut - more resources
Full Text Sources
Other Literature Sources
Molecular Biology Databases
