. 2017 Feb;214(2):401-422.
doi: 10.1084/jem.20160791. Epub 2017 Jan 12.

Defective ATG16L1-mediated removal of IRE1α drives Crohn's disease-like ileitis

Affiliations
Free PMC article

Defective ATG16L1-mediated removal of IRE1α drives Crohn's disease-like ileitis

Markus Tschurtschenthaler et al. J Exp Med. 2017 Feb.
Free PMC article

Abstract

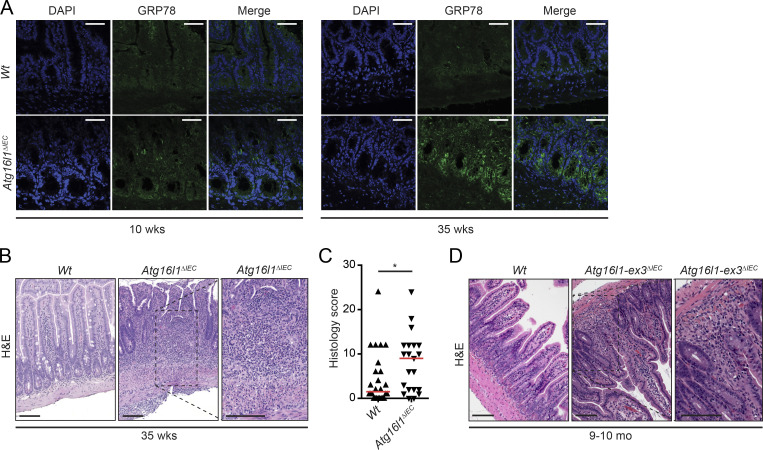
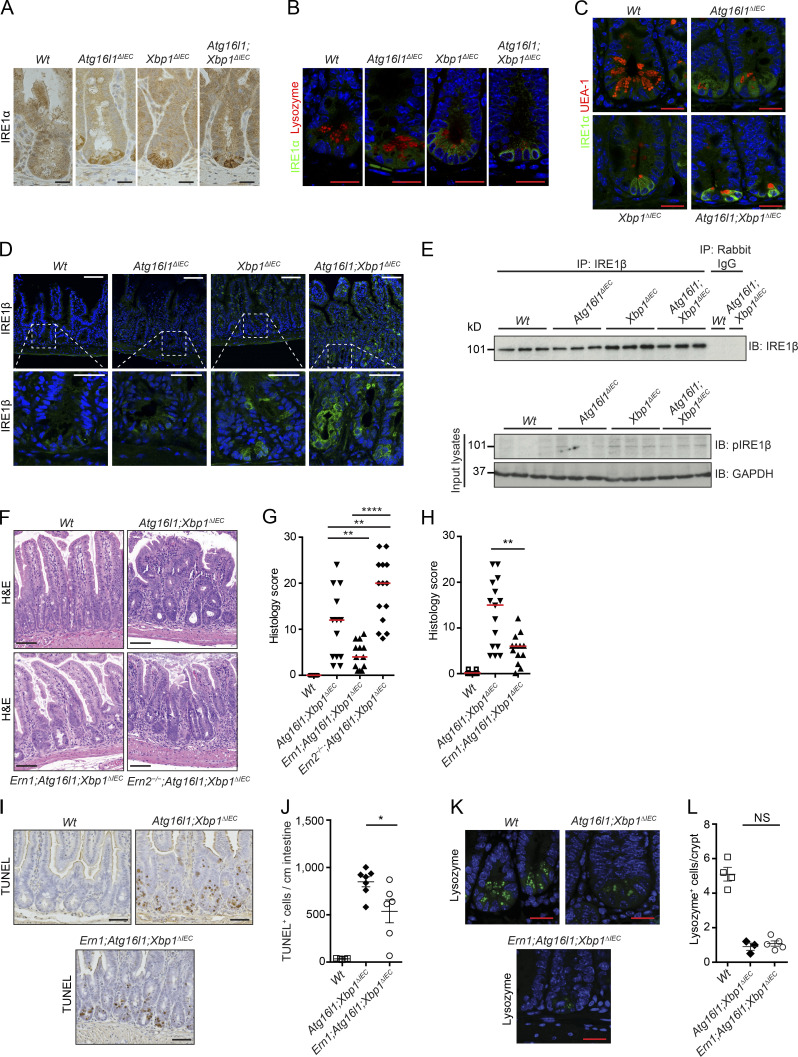
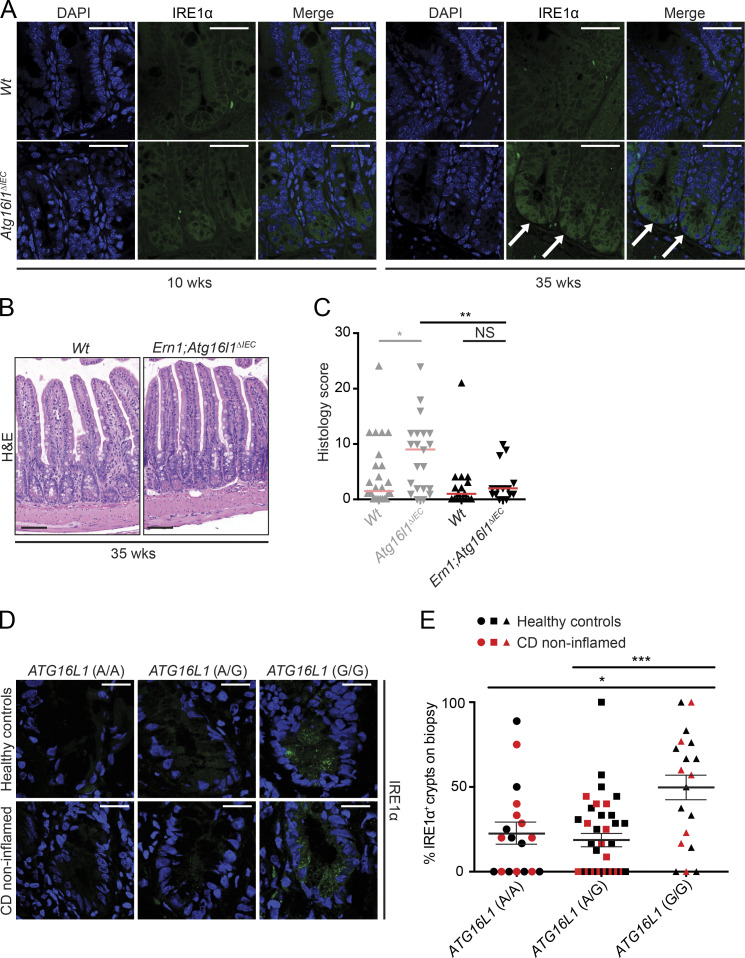
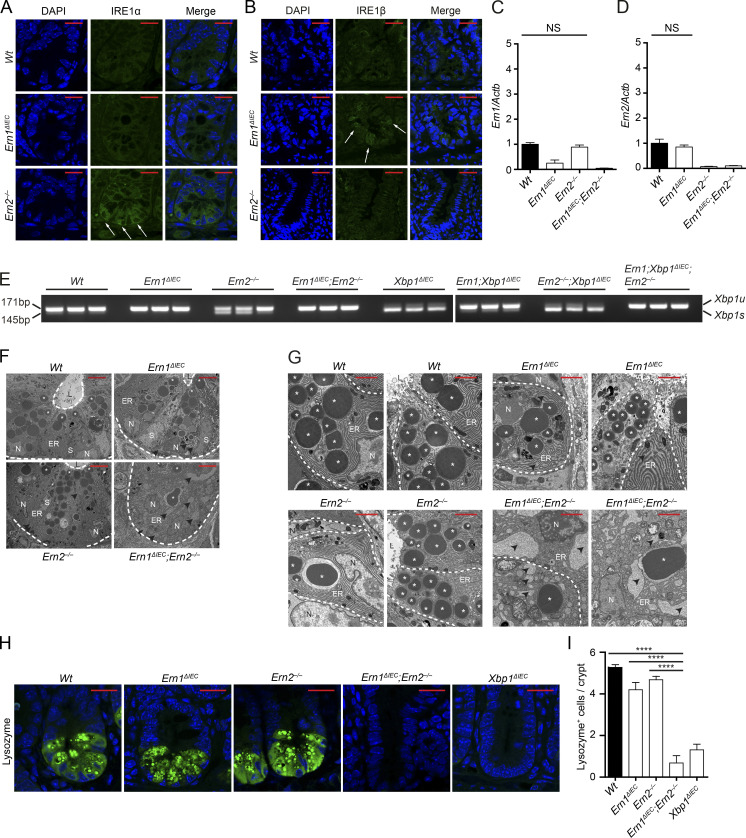
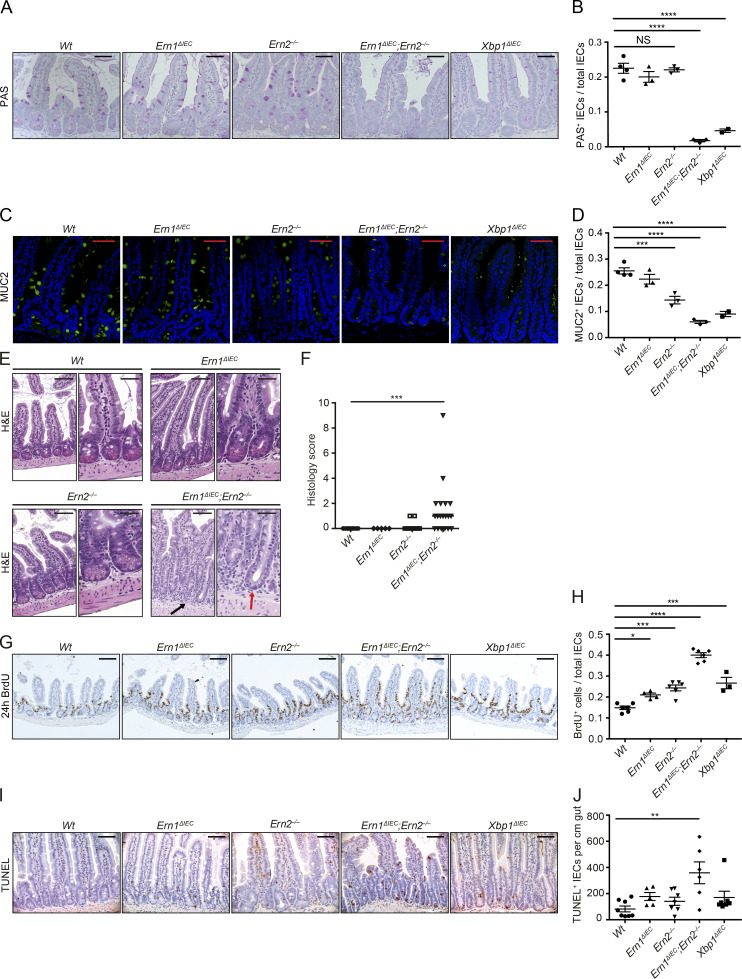
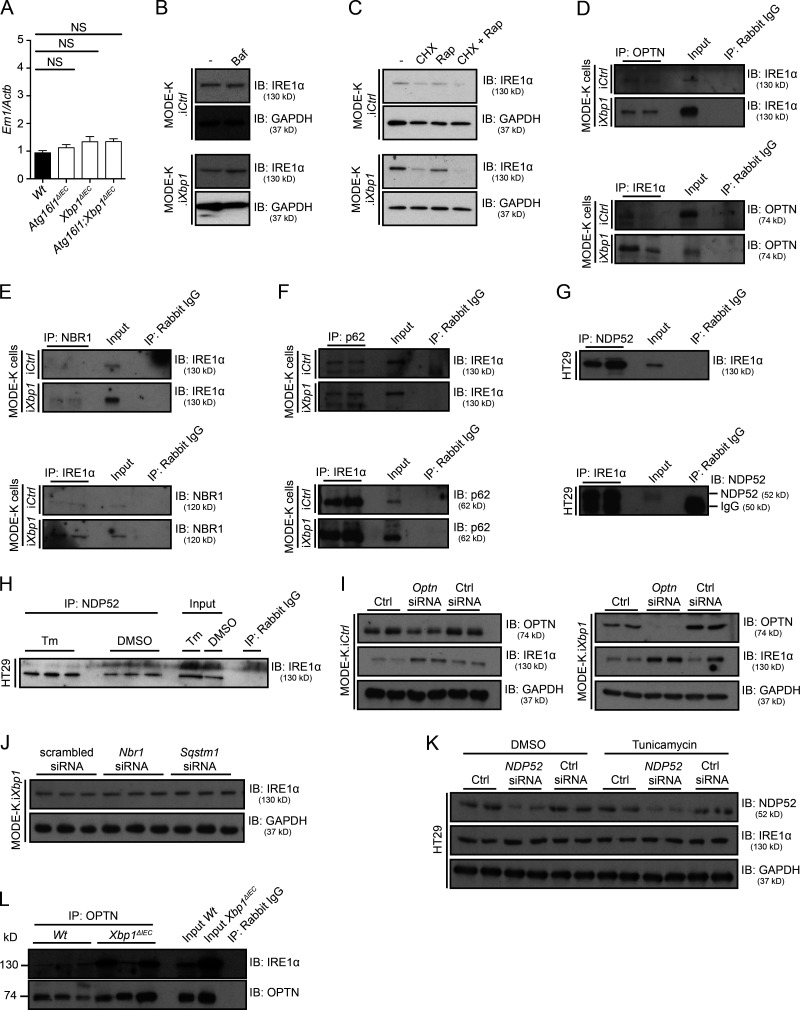
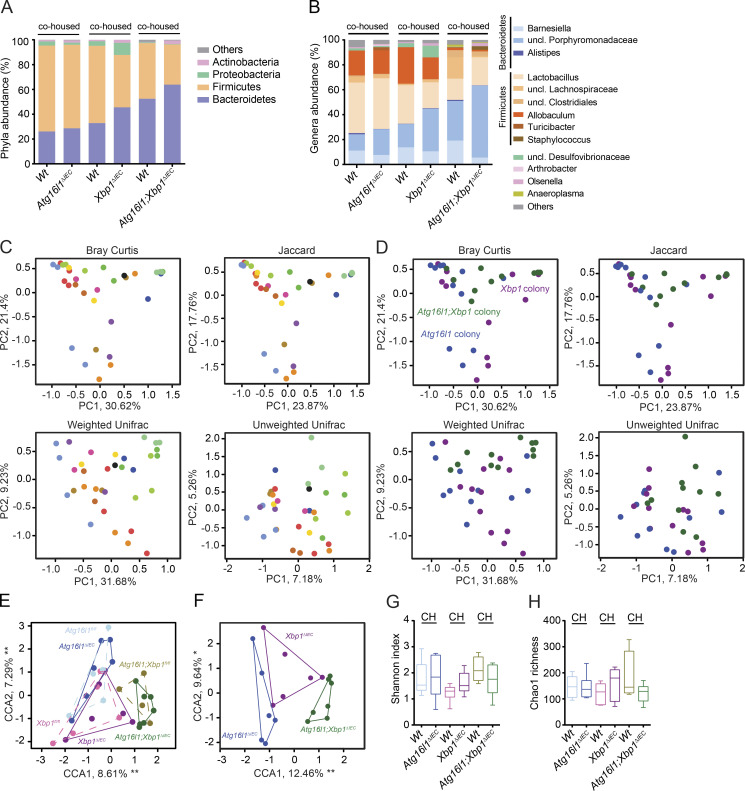
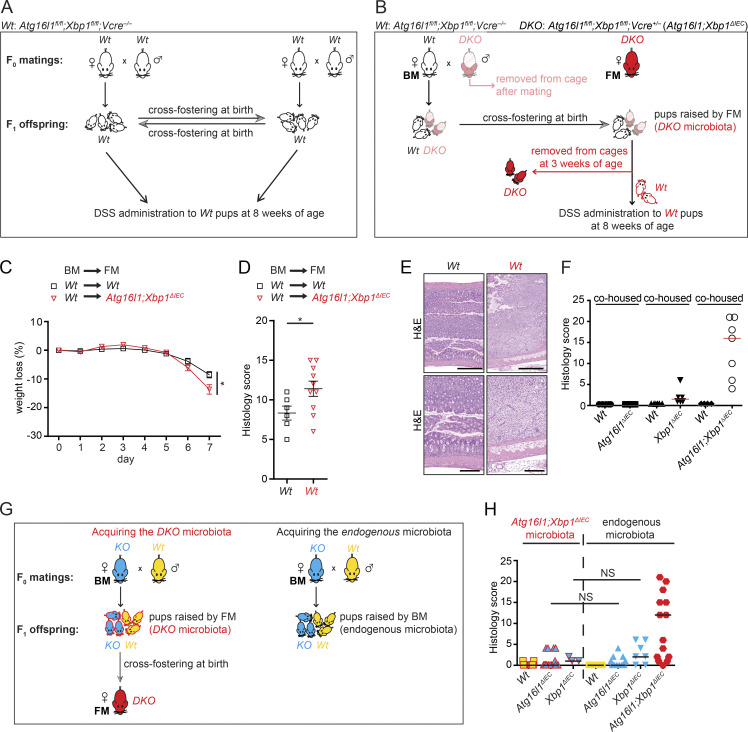
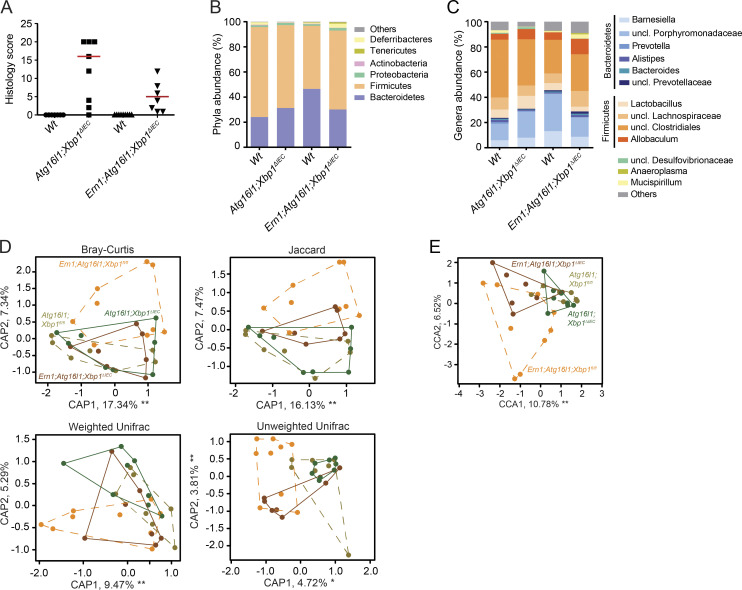
ATG16L1T300A, a major risk polymorphism in Crohn's disease (CD), causes impaired autophagy, but it has remained unclear how this predisposes to CD. In this study, we report that mice with Atg16l1 deletion in intestinal epithelial cells (IECs) spontaneously develop transmural ileitis phenocopying ileal CD in an age-dependent manner, driven by the endoplasmic reticulum (ER) stress sensor IRE1α. IRE1α accumulates in Paneth cells of Atg16l1ΔIEC mice, and humans homozygous for ATG16L1T300A exhibit a corresponding increase of IRE1α in intestinal epithelial crypts. In contrast to a protective role of the IRE1β isoform, hyperactivated IRE1α also drives a similar ileitis developing earlier in life in Atg16l1;Xbp1ΔIEC mice, in which ER stress is induced by deletion of the unfolded protein response transcription factor XBP1. The selective autophagy receptor optineurin interacts with IRE1α, and optineurin deficiency amplifies IRE1α levels during ER stress. Furthermore, although dysbiosis of the ileal microbiota is present in Atg16l1;Xbp1ΔIEC mice as predicted from impaired Paneth cell antimicrobial function, such structural alteration of the microbiota does not trigger ileitis but, rather, aggravates dextran sodium sulfate-induced colitis. Hence, we conclude that defective autophagy in IECs may predispose to CD ileitis via impaired clearance of IRE1α aggregates during ER stress at this site.


Figures

Figure 1.
Figure 1.
35-wk-old Atg16l1ΔIEC mice exhibit increased ER stress and transmural CD-like ileitis. (A) Representative images of GRP78 (green) immunoreactivity in 10- and 35-wk-old Atg16l1ΔIEC mice. n = 3. DAPI is shown in blue. Bars, 50 µm. (B and C) Representative H&E images (B) and enteritis histology score of 35-wk-old Atg16l1ΔIEC mice maintained in a mouse norovirus–free facility (Cambridge; C). n = 25/21. The median is shown. *, P < 0.05, Mann–Whitney U test. Note the transmural character of inflammation in Atg16l1ΔIEC mice compared with Wt mice. Bars, 100 µm. (D) Representative H&E images of 9–10-mo-old Atg16l1-ex3ΔIEC mice generated and housed at Cedars-Sinai SPF mouse facility in Los Angeles. The inset shows the transmural character of the inflammation seen in Atg16l1-ex3ΔIEC mice. n = 10. Bars, 100 µm.
Figure 2.
Figure 2.
IRE1α controls CD-like inflammation. (A) Representative images of IRE1α immunohistochemistry (brown) on ileal sections of 10-wk-old Atg16l1ΔIEC, Xbp1ΔIEC, and Atg16l1;Xbp1ΔIEC mice. n = 3. Hematoxylin is in blue. Bars, 20 µm. (B) Representative confocal images of IRE1α immunofluorescence (green) and Paneth cell–derived lysozyme (red) on ileal sections from the indicated genotypes at 10 wk of age. Note the perinuclear cytoplasmic IRE1α immunoreactivity of Paneth cells from Atg16l1ΔIEC mice that are lysozyme positive on the luminally oriented apex. n = 3. DAPI is in blue. Bars, 20 µm. (C) Representative confocal images of IRE1α immunofluorescence (green) and the Paneth and goblet cell–type–specific lectin UEA-1 (red) on ileal sections from the indicated genotypes at 10 wk of age. n = 3. DAPI is in blue. Bars, 20 µm. (D) Representative confocal images of IRE1β immunofluorescence (green) of the indicated genotypes at 10 wk of age. Note the specific IRE1β immunoreactivity of crypts (insets, bottom) and villus IECs from Atg16l1;Xbp1ΔIEC and Xbp1ΔIEC mice. DAPI is in blue. n = 3. Bars: (top) 50 µm; (bottom) 20 µm. (E) IRE1β immunoprecipitation (IP) and immunoblot (IB) as well as pIRE1β immunoblot in crypt lysates. n = 3. GAPDH was used as the loading control. (F and G) Representative H&E images (F) and their histological score (G) of 10-wk-old mice. n = 28/13/13/9. The median is shown. One-way ANOVA with Bonferroni’s correction was used. Bars, 100 µm. (H) Enteritis histology score of the indicated genotypes housed at the mouse norovirus–positive SPF animal facility (ZVTA) of the Medical University of Innsbruck. n = 12/15/13. The median is shown. Unpaired two-tailed Student’s t test was used. (I and J) Representative images of TUNEL-labeled IECs (brown; I) and quantification (J). n = 5/7/6. The mean ± SEM is shown. Mann–Whitney U test was used. Hematoxylin is in blue. Bars, 50 µm. (K and L) Representative confocal images of lysozyme immunofluorescence in crypt IECs (green; K) and quantification (L). n = 4/3/5. The mean ± SEM is shown. A Mann–Whitney U test was used. DAPI is in blue. Bars, 20 µm. *, P < 0.05; **, P < 0.01; ****, P < 0.0001.
Figure 3.
Figure 3.
IRE1α expression is increased in 35-wk-old Atg16l1ΔIEC mice and ATG16L1T300A patients and drives CD-like ileitis. (A) Representative confocal images of IRE1α immunoreactivity (green; white arrows) in 10- and 35-wk-old Atg16l1ΔIEC mice. n = 3. DAPI is in blue. Bars, 50 µm. (B) Representative H&E images of 35-wk-old Ern1;Atg16l1ΔIEC and Wt mice. Bars, 100 µm. (C) Enteritis histology scores of 35-wk-old Atg16l1ΔIEC mice (the identical scores are depicted in Fig. 1 C) compared with 35-wk-old Ern1;Atg16l1ΔIEC mice and their respective Wt controls. n = 25/21/19/15. The median is shown. A Mann–Whitney U test was used. (D) Representative IRE1α immunoreactivity (green) stratified by the ATG16L1 risk allele (AA/AG/GG; A, healthy allele; G risk allele) in healthy controls (n = 9/22/12) and noninflamed mucosa (n = 9/15/7) of CD patients. DAPI is in blue. Bars, 20 µm. (E) Quantification of IRE1α+ crypts shown in D in healthy controls (n = 9/22/12) and CD patients (n = 9/15/7) according to their ATG16L1 genotype (n = 18/37/19). Mean ± SEM is shown. One-way ANOVA with Bonferroni’s correction was used. *, P < 0.05; **, P < 0.01; ***, P < 0.001.
Figure 4.
Figure 4.
Cross-compensatory up-regulation of IRE1α and IRE1β maintains Paneth cell homeostasis. (A and B) Representative confocal images of IRE1α (A) or IRE1β (B) immunofluorescence (green) of the indicated genotypes at 10 wk of age. Note the cross-compensatory up-regulation of IRE1β and IRE1α in crypts of Ern1ΔIEC and Ern2−/− mice, respectively (white arrows). n = 3. DAPI is in blue. Bars, 20 µm. (C and D) Ern1 (C) and Ern2 (D) mRNA expression measured by qRT-PCR in ileal scrapings of the indicated genotypes normalized to Actb expression. n = 20/10/16/15. The mean ± SEM is shown. One-way ANOVA with Bonferroni’s correction was used. Note that IRE1α and IRE1β (encoded by Ern1 and Ern2) in Ern2−/− and Ern1ΔIEC mice, respectively, are not transcriptionally regulated. (E) Xbp1 splicing in crypt IECs from the indicated genotypes indicative of upstream activation of IRE1α/IRE1β. Note increased Xbp1 splicing in Ern2−/− crypts indicative of upstream activation of IRE1α (also see A), whereas IRE1β appears to have a minor function for Xbp1 splicing in Ern1;Xbp1ΔIEC mice which is absent in Ern1;Xbp1ΔIEC;Ern2−/−. n = 3. (F) High magnification transmission electron microscopy micrographs of ileal crypts depicting Paneth cells from the indicated genotypes. n = 2. Bars, 5 µm. Dashed lines denote crypt unit. (G) High magnification transmission electron microscopy micrographs of ileal crypts depicting Paneth cells from the indicated genotypes. n = 2. Bars, 2 µm. Dashed lines denote single Paneth cells. (F and G) L, lumen; N, nucleus; S, stem cell. White asterisks label Paneth cell granules. Note the absence of intact Paneth cell granules and the dilated ER lumen (black arrowheads). (H and I) Representative confocal images of lysozyme immunoreactivity (green; H) and quantification of lysozyme+ cells per crypt (I) on ileal sections of the indicated genotypes. n = 4/3/4/3/4. The mean ± SEM is shown. One-way ANOVA with Bonferroni’s correction was used. ****, P < 0.0001. DAPI is in blue. Bars, 20 µm.
Figure 5.
Figure 5.
Cross-compensation of IRE1α and IRE1β maintains intestinal homeostasis. (A and B) Representative PAS staining on ileal sections from the indicated genotypes at 10 wk of age (A) with quantification of PAS-labeled IECs per total IECs along the crypt villus axis (B). Note the absence of PAS+ goblet cells in Ern1ΔIEC;Ern2−/− mice. n = 4/3/3/3/2. The mean ± SEM is shown. One-way ANOVA with Bonferroni’s correction was used. Hematoxylin counterstaining is in light blue. Bars, 50 µm. (C and D) Representative confocal images of MUC2 immunoreactivity (green) on ileal sections from the indicated genotypes at 10 wk of age (C) with quantification of MUC2+ goblet cells per total IECs along the crypt villus axis (D). Note the absence of MUC2+ goblet cells in Ern1ΔIEC;Ern2−/− mice. n = 4/3/3/3/2. The mean ± SEM is shown. One-way ANOVA with Bonferroni’s correction was used. DAPI is in blue. Bars, 50 µm. (E and F) Representative H&E images (E) of the indicated genotypes at 10 wk of age and their histological score (F). n = 10/5/17/19. The median is shown. A Mann–Whitney U test was used. Note the absence of eosinophilic Paneth cell granule (red arrow) and the surrounding basal infiltration of mononuclear cells in Ern1ΔIEC;Ern2−/− mice (black arrow). Bars: (left) 100 µm; (right) 50 µm. (G and H) Representative images of BrdU-labeled IECs (brown; G) from the indicated genotypes at 10 wk of age after 24 h of BrdU incorporation with quantification of BrdU+ IECs per total IECs along the crypt villus axis (H). n = 6/3/4/6/6. The mean ± SEM is shown. One-way ANOVA with Bonferroni’s correction was used. Hematoxylin counterstaining is in blue. Bars, 100 µm. (I and J) Representative images of TUNEL labeling (brown; I) and quantification of TUNEL+ cells per cm gut on ileal sections (J) of the indicated genotypes at 10 wk of age. n = 8/7/5/7/6. The mean ± SEM is shown. One-way ANOVA with Bonferroni’s correction was used. Hematoxylin counterstaining is in blue. Bars, 50 µm. *, P < 0.05; **, P < 0.01; ***, P < 0.001; ****, P < 0.0001.
Figure 6.
Figure 6.
Selective autophagy receptors target IRE1α for degradation. (A) Ern1 mRNA expression measured by qRT-PCR in ileal scrapings from the indicated genotypes and normalized to Actb expression. n = 15/11/10/11. The mean ± SEM is shown. One-way ANOVA with Bonferroni’s correction was used. (B) IRE1α immunoblot (IB) of Xbp1-sufficient (MODE-K.iCtrl) and Xbp1-deficient (MODE-K.iXbp1) MODE-K cells co-cultured for 24 h with bafilomycin (Baf), an inhibitor of vacuolar H+ ATPase that prevents cargo degregation in autophagolysosomes. Data are representative of three independent experiments. (C) IRE1α immunoblot after addition of protein synthesis inhibitor cycloheximide (CHX) and the autophagy inducer rapamycin (Rap) to MODE-K.iCtrl and MODE-K.iXbp1 cells for 24 h. Data are representative of two independent experiments. (D–F) Coimmunoprecipitation (IP) of IRE1α with selective autophagy receptors OPTN (D), NBR1 (neighbor of BRCA1 gene 1 protein; E), and p62 (F) in MODE-K.iCtrl and MODE-K.iXbp1 cells with converse pull-downs also demonstrated. n = 2. Data are representative of three independent experiments. (G) Coimmunoprecipitation of IRE1α with the selective autophagy receptor NDP52 in the human colorectal adenocarcinoma cell line HT29. n = 2. Data are representative of three independent experiments. (H) Coimmunoprecipitation and immunoblot of IRE1α with the selective autophagy receptor NDP52 in HT29 cells at basal conditions (DMSO) and after pharmacological ER stress induction with tunicamycin (Tm). n = 3. Data are representative of two independent experiments. (I) IRE1α and OPTN immunoblots after siRNA silencing of Optn in MODE-K.iCtrl and MODE-K.iXbp1 cells. n = 2. Data are representative of two independent experiments. Ctrl, control. (J) IRE1α immunoblot upon siRNA silencing of Nbr1 or Sqstm1 (p62) in MODE-K.iXbp1 cells. n = 3. Data are representative of two independent experiments. (K) IRE1α and NDP52 immunoblots upon siRNA silencing of NDP52 in HT29 cells with and without tunicamycin treatment for 4 h. n = 2. Data are representative of two independent experiments. (L) Coimmunoprecipitation of OPTN with IRE1α in ileal crypts of Wt and Xbp1ΔIEC mice. n = 3. Data are representative of two independent experiments.
Figure 7.
Figure 7.
Atg16l1;Xbp1ΔIEC mice harbor a dysbiotic and transmissible microbiota. (A and B) Relative abundance of microbial taxa at phylum level (≥1%; A) and genus level (≥1%; B) representing ileal mucosa–adherent microbiota of 18-wk-old cohoused mutant (V-cre+) and Wt littermates (V-cre). n = 5/6/6/6/4/7. uncl., unclassified. (C and D) Ordination analysis of the constraining factors of the cage effect (each dot represents one mouse; cages are indicated as different colors; C) and genotype effect (each dot represents one mouse; colonies are indicated as different colors; D) in the microbiota analysis of cohoused mice based on principal coordinates analysis (Bray Curtis and Jaccard dissimilarity) and Unifrac (weighted and unweighted). Atg16l1 colony, n = 11; Xbp1 colony, n = 12; Atg16l1;Xbp1 colony, n = 11. (E) CCA plot showing a significant genotype effect (F = 2.2270; P = 0.001) and gender effect (F = 2.2639; P = 0.004) in the indicated groups (n = 5/6/6/6/4/7). Significant genotype effect is shown in D. Cage and litter effects were partialled out in this analysis and are shown in C. (F) CCA plot of knockouts only (n = 6/6/7) constrained for mutation and gender effect (cage and litter effect were partialled out). (G and H) α diversity estimates Shannon’s index analyzing species evenness (G), and Chao 1 determining species richness (H) is shown (n = 5/6/6/6/4/7). Statistical analysis was performed using nonparametric Kolmogorov-Smirnov test. CH, cohoused.
Figure 8.
Figure 8.
Microbiota of Atg16l1;Xbp1ΔIEC mice predisposes to colitis but not ileitis. (A) Cross-fostering of Wt (V-cre Atg16l1fl/fl;Xbp1fl/fl) offspring derived from a Wt (V-cre Atg16l1fl/fl;Xbp1fl/fl) breeding pair to a Wt (V-cre Atg16l1fl/fl;Xbp1fl/fl) foster dam and vice versa. Male breeders of the F0 generation were removed from the cage before F1 offspring were born. Cross-fostered offspring were subjected to 3% DSS-induced colitis for 7 d at 8 wk of age (this group of mice is displayed in black in panels C–E), performed in a mouse norovirus–free SPF animal facility (Cambridge). (B) Cross-fostering of Wt (V-cre Atg16l1fl/fl;Xbp1fl/fl; displayed in black) and Atg16l1;Xbp1ΔIEC (DKO; V-cre+ Atg16l1fl/fl;Xbp1fl/fl; displayed in shaded red) offspring derived from a hemizygous breeding pair (V-cre Atg16l1fl/fl;Xbp1fl/fl [Wt] × V-cre+ Atg16l1fl/fl;Xbp1fl/fl [DKO]) from a Wt (V-cre Atg16l1fl/fl;Xbp1fl/fl) dam (biological mother; BM) to a Atg16l1;Xbp1ΔIEC (DKO; V-cre+ Atg16l1fl/fl;Xbp1fl/fl) foster mother (FM; displayed in red). Male breeders of the F0 generation were removed from the cage before F1 offspring was born (displayed in shaded red). Before weaning of cross-fostered offspring, pups were genotyped, and Atg16l1;Xbp1ΔIEC (DKO) littermates were removed from the cage. Remaining Wt offspring that acquired Atg16l1;Xbp1ΔIEC microbiota (framed in red) were subjected to 3% DSS colitis for 7 d at 8 wk of age (this group of mice is displayed in red in panels C–E). (C) Relative weight loss after 3% DSS application for 7 d to 8-wk-old mice after cross-fostering Wt littermates either between Wt dams (displayed in black) or from a Wt dam to an Atg16l1;Xbp1ΔIEC dam after birth (displayed in red). Experimental design is shown in A and B. n = 6/10. The mean ± SEM is shown. Linear mixed-effects model fitted using R (lme package) was used. *, P < 0.05. (D and E) DSS colitis score (D) after 7 d of experiment performed in C with representative H&E images (E). n = 6/10. The mean ± SEM is shown. Unpaired two-tailed Student’s t test was used. *, P < 0.05. Bars: (top) 500 µm; (bottom) 200 µm. (F) Histological score of cohoused mice of the indicated genotypes used for 16S rDNA ribotyping of ileal mucosa–adherent microbiota in Fig. 7 at 18 wk of age. n = 5/6/6/6/4/7. The median is shown. (G, left) Cross-fostering of either Atg16l1ΔIEC offspring (KO; displayed in blue) and their Wt littermates (displayed in yellow) or Xbp1ΔIEC offspring (KO; displayed in blue) and their Wt littermates (displayed in yellow) to an Atg16l1;Xbp1ΔIEC (DKO; displayed in red) foster dam allowing them to acquire the Atg16l1;Xbp1ΔIEC microbiota (framed in red). (Right) Concurrently, non–cross-fostered Atg16l1ΔIEC and Xbp1ΔIEC offspring were raised by their respective biological dams, which allowed them to acquire endogenous microbiota. (H) Enteritis histology score of cross-fostered and Atg16l1;Xbp1ΔIEC microbiota-acquired offspring compared with non–cross-fostered and endogenous microbiota acquired offspring at 8 wk of age. n = 21/18/3/12/13/7/16. The median is shown. Kruskal–Wallis with posthoc Holm’s-corrected Mann–Whitney U test was used.
Figure 9.
Figure 9.
Similar microbiota composition despite amelioration of disease in Ern1;Atg16l1;Xbp1ΔIEC mice. (A) Histological score of mice used for 16S rDNA ribotyping of ileal mucosa–adherent microbiota in B–E at 10 wk of age. n = 7/8/9/7. The median is shown. (B and C) Relative abundance of microbial taxa at phylum level (≥1%; B) and genus level (≥1%; C) representing ileal mucosa–adherent microbiota of 10-wk-old Ern1;Atg16l1;Xbp1ΔIEC mice and their Wt littermates compared with Atg16l1;Xbp1ΔIEC mice. n = 7/8/9/7. uncl., unclassified. (D) Ordination analysis including all constraining factors (genotype, mutation, gender, litter, and cage) based on Bray-Curtis dissimilarity (genotype: R2 = 0.16566, P = 0.1219; gender: R2 = 0.01154, P = 0.9121; litter: R2 = 0.08843, P = 0.8472; and cage: R2 = 0.17390, P = 0.4535), Jaccard index (genotype: R2 = 0.14477, P = 0.1129; gender: R2 = 0.01465, P = 0.9700; litter: R2 = 0.10618, P = 0.8252; and cage: R2 = 0.16193, P = 0.5614), weighted Unifrac distances (genotype: F = 1.0380, P = 0.372; gender: F = 1.1375, P = 0.247; litter: F = 0.9034, P = 0.634; and cage: F = 1.0281, P = 0.411) and unweighted Unifrac distances (genotype: F = 1.0604, P = 0.172; gender: F = 1.0816, P = 0.217; litter: F = 1.0265, P = 0.276; and cage: F = 1.0270, P = 0.304). n = 7/8/9/7. (E) Constrained CCA plot partialled out for cage and litter effect showed a marginal significance for genotype (F = 1.7166 and P = 0.045). n = 7/8/9/7.

References

    1. Adolph, T.E., Tomczak M.F., Niederreiter L., Ko H.J., Böck J., Martinez-Naves E., Glickman J.N., Tschurtschenthaler M., Hartwig J., Hosomi S., et al. 2013. Paneth cells as a site of origin for intestinal inflammation. Nature. 503:272–276. - PMC - PubMed
    1. Amthor, H., Otto A., Vulin A., Rochat A., Dumonceaux J., Garcia L., Mouisel E., Hourdé C., Macharia R., Friedrichs M., et al. 2009. Muscle hypertrophy driven by myostatin blockade does not require stem/precursor-cell activity. Proc. Natl. Acad. Sci. USA. 106:7479–7484. 10.1073/pnas.0811129106 - DOI - PMC - PubMed
    1. Anderson, M.J. 2001. A new method for non-parametric multivariate analysis of variance. Austral Ecol. 26:32–46.
    1. Baxt, L.A., and Xavier R.J.. 2015. Role of autophagy in the maintenance of intestinal homeostasis. Gastroenterology. 149:553–562. 10.1053/j.gastro.2015.06.046 - DOI - PMC - PubMed
    1. Bertolotti, A., Wang X., Novoa I., Jungreis R., Schlessinger K., Cho J.H., West A.B., and Ron D.. 2001. Increased sensitivity to dextran sodium sulfate colitis in IRE1β-deficient mice. J. Clin. Invest. 107:585–593. 10.1172/JCI11476 - DOI - PMC - PubMed