. 2017 Feb;214(2):327-338.
doi: 10.1084/jem.20160620. Epub 2017 Jan 12.

Strong adhesion by regulatory T cells induces dendritic cell cytoskeletal polarization and contact-dependent lethargy

Affiliations
Free PMC article

Strong adhesion by regulatory T cells induces dendritic cell cytoskeletal polarization and contact-dependent lethargy

Jiahuan Chen et al. J Exp Med. 2017 Feb.
Free PMC article

Abstract

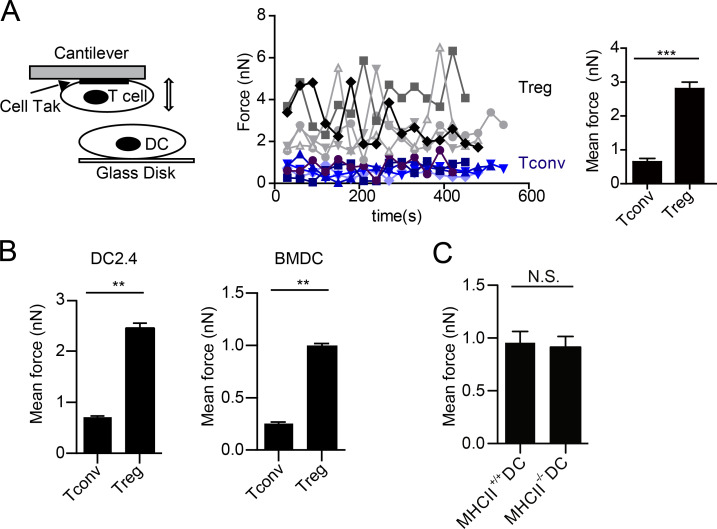
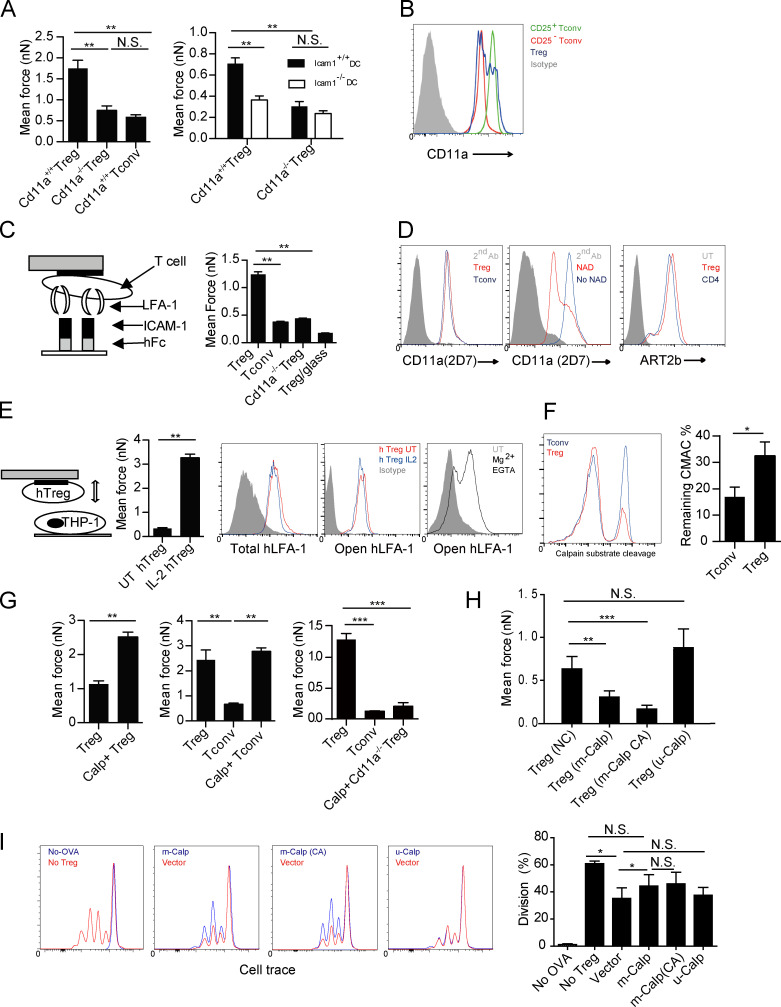
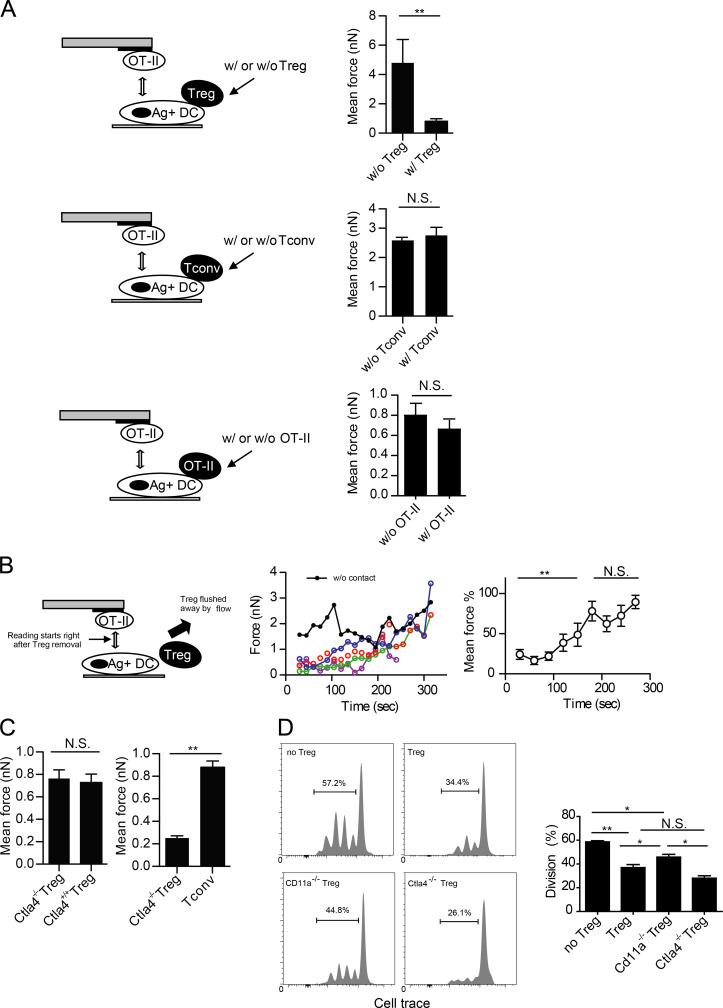
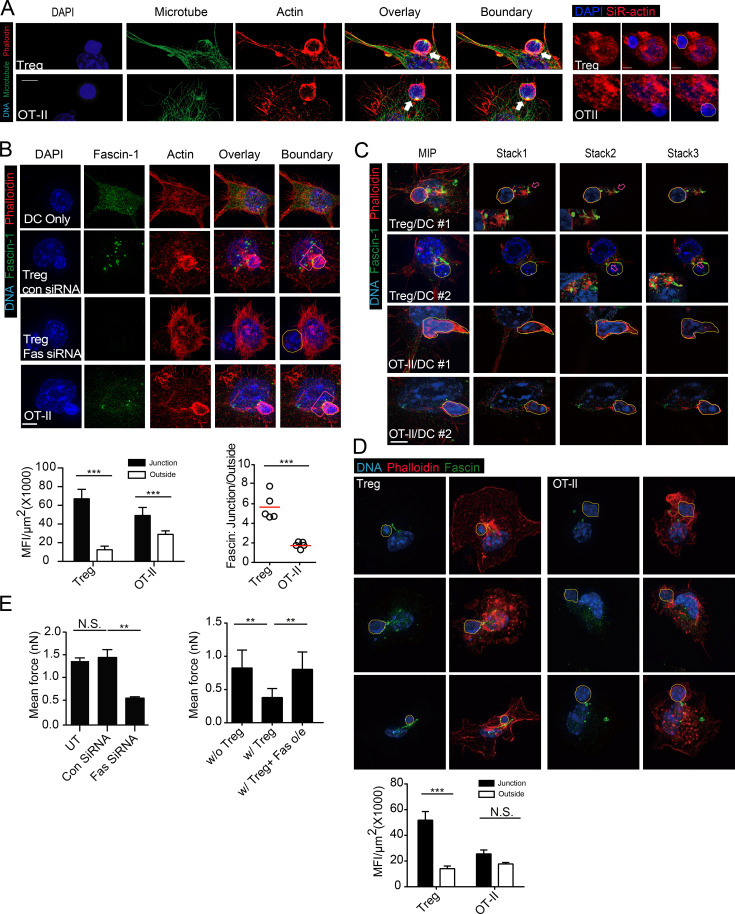
Dendritic cells are targeted by regulatory T (T reg) cells, in a manner that operates as an indirect mode of T cell suppression. In this study, using a combination of single-cell force spectroscopy and structured illumination microscopy, we analyze individual T reg cell-DC interaction events and show that T reg cells exhibit strong intrinsic adhesiveness to DCs. This increased DC adhesion reduces the ability of contacted DCs to engage other antigen-specific cells. We show that this unusually strong LFA-1-dependent adhesiveness of T reg cells is caused in part by their low calpain activities, which normally release integrin-cytoskeleton linkage, and thereby reduce adhesion. Super resolution imaging reveals that such T reg cell adhesion causes sequestration of Fascin-1, an actin-bundling protein essential for immunological synapse formation, and skews Fascin-1-dependent actin polarization in DCs toward the T reg cell adhesion zone. Although it is reversible upon T reg cell disengagement, this sequestration of essential cytoskeletal components causes a lethargic state of DCs, leading to reduced T cell priming. Our results reveal a dynamic cytoskeletal component underlying T reg cell-mediated DC suppression in a contact-dependent manner.


Figures

Figure 1.
Figure 1.
T reg cells show strong binding to DCs. (A) A schematic diagram for AFM-SCFS assay setup (left) and SCFS force readings for T cells of indicated types adhering to DC2.4 cells (middle). Black or gray. T reg cell (5); other colors, T conv (5). All data points (dots in the middle) from five independent DC-T cell pairs for each condition, collected on the same day, were used to generate the bar graph to the right. The data presented (middle and right) are collectively considered as one experiment. Error bars are SEM. All the force graphs henceforth used the identical analysis to show all data points collected from all T–DC pairs of each condition in one experiment. For all subsequent figures involving SCFS, at least 14 force readings were collected for each T–DC pair, and a minimum of three independent T–DC pairs were performed and analyzed for each condition. (B) Mean forces of T cells of indicated types adhering to DC2.4 cells (left) or BMDCs (right). (C) Mean forces of T reg cells adhering to wild-type and MHC class II–deficient BMDCs. **, P < 0.01; ***, P < 0.001; N.S., not significant. Each panel is representative of at least five independent experiments.
Figure 2.
Figure 2.
An intrinsic low level of calpain is associated with the high strength binding by LFA-1 on T reg cells. (A, left) Mean forces of wild-type or LFA-1 T–DC–deficient T reg, or T conv cells adhering to DC2.4 cells. (right) Mean forces of wild-type or LFA-1–deficient T reg cells adhering to wild-type or ICAM-1–deficient BMDCs. Representative of four independent experiments. (B) Levels of LFA-1 expression on T reg, resting (CD25), and activated (CD25+) T conv cells. Representative of three independent experiments. (C, left) Schematic diagram. (right) Adhesion forces between wild-type or Cd11a−/− T conv or T reg cells and recombinant Fc-ICAM-1–coated on a glass slide. B6 T reg cell/blank glass contact was recorded as the background. Representative of three independent experiments. (D) ADP ribosylation of LFA-1, which is induced by NAD treatment, is known to reduce 2D7 staining intensities. (left) T reg and T conv cells were stained with 2D7 antibody without NAD treatment. (middle) The NAD treatment–induced down-regulation of 2D7 staining in comparison with the untreated control. The comparable 2D7 staining intensities on T reg cells indicate no difference in ADP-ribosylation (left). (right) Similar expression of ART2b (ART2.2), the enzyme responsible for surface LFA-1 ADP ribosylation, between T reg and T conv cells. Representative of three independent experiments. (E) Adhesion forces between IL-2–treated or untreated human T reg cells adhering to PMA-stimulated THP-1 cells grown on the disk. (left) Scheme. Bar graph (middle left) shows mean adhesion forces of IL-2–treated or untreated human T reg cells. Levels of total (middle) or open conformation (middle right) LFA-1 expression on IL-2-treated human T reg cells from the peripheral blood. Gray: isotype control. Human T reg cells treated with Mg2+ and EGTA showed elevated expression of open LFA-1 (right). Representative of three independent experiments. (F, left) T reg and T conv cells were incubated with calpain substrate CMAC; calpain activities as fluorescence signals from the digested substrate were determined by FACS after a 5-min incubation. (right) The remaining substrates were quantified. Representative of at least 10 independent experiments. (G) Mean forces of untreated or calpeptin-treated T reg cell (left), T reg or T conv (middle), and wild-type, LFA-1-deficient T reg cell, or T conv cells (right) adhering to DC2.4. Representative of five independent experiments. (H) Mean forces of vector control, m-calpain, constitutively active m-calpain, or µ-calpain–overexpressing T reg adhering to DC2.4. Representative of three independent experiments. (I) T reg cell–mediated suppression of OT-II T cell division, as measured by CellTrace dilution, stimulated by OVA-pulsed DC2.4 cells as described in the Materials and methods. (left to right) Division in the presence or absence of OVA without T reg cells; in the presence of vector transfection control or m-calpain–overexpressing T reg cells; vector or CA (constitutively active) m-calpain–overexpressing T reg cells; and vector or µ-calpain–overexpressing T reg cells. Statistical results (far right) are pooled from three independent experiments. *, P < 0.05; **, < 0.01; ***, < 0.001; NS, not significant.
Figure 3.
Figure 3.
T reg cell binding blocks T conv–DC interaction. (A) Adhesion between OT-II T cells and OVA-pulsed DC2.4 cells that were free or engaged by T reg cell (top), anti-CD3/anti-CD28–activated T conv (middle), or OVA-peptide–activated OT-II T (bottom) cells on the opposite side of the DC cell bodies. Shown are the triple-cell AFM assay setup (left) and mean OT-II–DC adhesion forces (right). Each is representative of four independent experiments. (B) Adhesion between OT-II T cells and OVA-pulsed DC2.4 cells that were newly freed from engagement by T reg cells. (left) The assay setup. (middle) SCFS force readings for one control DC without prior T reg cell engagement (black) and four newly freed DCs (other colors). Time zero is the moment when the T reg cell contact was relieved by flushing. (right) The control-normalized SCFS force readings for the newly freed DCs (middle), running-averaged with a bin size of two. Representative of three independent experiments. (C, left) Mean forces of wild-type or Ctla4−/− T reg cells adhering to DC2.4 cells. (right) Mean forces of OT-II T cells adhering to OVA-pulsed DCs that were engaged on one side of the cell body by Ctla4−/− T reg cells or T conv cells. (D, left) Wild-type, Ctla4−/−, and Cd11a−/− T reg cell–mediated suppression of OT-II T cell division. (right) Statistical analysis. Representative of three independent experiments. *, P < 0.05; **, < 0.01; NS, not significant.
Figure 4.
Figure 4.
Polarization of actin and DC-specific actin bundling protein. Fascin-1 is associated with T reg cell–mediated suppression (A) Maximum-intensity projection (MIP) SIM images of a T reg cell or an OT-II T cell coupled with a DC2.4 cell pulsed with OVA, stained for DNA with DAPI, anti-α-tubulin and phalloidin. White arrows highlight the increased thickening of F-actin at the T–DC interface. Hand-traced boundaries of T cells according to DIC are shown to the right here, as well as in the subsequent images. Bars, 5 µm. Representative of at least 10 independent images from four independent stainings. (right) SiR-actin/DAPI-labeled DCs in mixture with T cells (DAPI only) under conventional microscope. (B, top) MIP SIM images of conjugates between T reg cells and DC2.4 cells transfected with control or Fascin-1 siRNA. Conjugates were stained with DAPI, phalloidin, and anti–Fascin-1 antibody. Red boxes covering the T–DC contact sites were used for statistical analyses of Facsin-1 intensity. (bottom) Fascin-1 intensities at T reg cell–DC and OT-II–DC contact sites, as indicated by red boxes in the left. (bottom right) Ratios of mean Fascin-1 intensities in and out of the junction areas. Representative of at least 10 independent images from four independent stainings. (C) MIP SIM images and representative optical sections (stack 1–3) of conjugates between T reg cell (top two rows) or OT-II (bottom two rows) cells and DC2.4 cells. Arrows highlight areas of intermingled Fascin-1 and F-actin bundling, magnified in the inserts. Representative of at least 10 independent images from three independent stainings. (D) As in B, Fascin-1 distribution in three T reg cell–BMDC or OT-II-BMDC pairs was visualized by SIM (top) and quantitatively analyzed in the lower. Representative of three independent stainings. (E, left) Mean forces of OT-II T cells adhering to untreated, control siRNA-treated, or Fascin-1–specific siRNA-treated DC2.4 cells prepulsed with OVA. (right) Mean forces of OT-II T cells adhering to control vector-transfected or Fascin-1–overexpressing DC2.4 cells prepulsed with OVA, with or without T reg cell contact. Each is representative of at least three independent experiments. **, < 0.01; ***, < 0.001; NS, not significant.

References

    1. Al-Alwan, M.M., Rowden G., Lee T.D., and West K.A.. 2001a. The dendritic cell cytoskeleton is critical for the formation of the immunological synapse. J. Immunol. 166:1452–1456. 10.4049/jimmunol.166.3.1452 - DOI - PubMed
    1. Al-Alwan, M.M., Rowden G., Lee T.D., and West K.A.. 2001b. Fascin is involved in the antigen presentation activity of mature dendritic cells. J. Immunol. 166:338–345. 10.4049/jimmunol.166.1.338 - DOI - PubMed
    1. Al-Alwan, M.M., Liwski R.S., Haeryfar S.M., Baldridge W.H., Hoskin D.W., Rowden G., and West K.A.. 2003. Cutting edge: dendritic cell actin cytoskeletal polarization during immunological synapse formation is highly antigen-dependent. J. Immunol. 171:4479–4483. 10.4049/jimmunol.171.9.4479 - DOI - PubMed
    1. Aldinucci, A., Rizzetto L., Pieri L., Nosi D., Romagnoli P., Biagioli T., Mazzanti B., Saccardi R., Beltrame L., Massacesi L., et al. . 2010. Inhibition of immune synapse by altered dendritic cell actin distribution: a new pathway of mesenchymal stem cell immune regulation. J. Immunol. 185:5102–5110. 10.4049/jimmunol.1001332 - DOI - PubMed
    1. Au-Yeung, B.B., Levin S.E., Zhang C., Hsu L.Y., Cheng D.A., Killeen N., Shokat K.M., and Weiss A.. 2010. A genetically selective inhibitor demonstrates a function for the kinase Zap70 in regulatory T cells independent of its catalytic activity. Nat. Immunol. 11:1085–1092. 10.1038/ni.1955 - DOI - PMC - PubMed

Publication types

Substances