. 2017 Mar;173(3):1659-1675.
doi: 10.1104/pp.16.01709. Epub 2017 Jan 12.

Analysis of Exocyst Subunit EXO70 Family Reveals Distinct Membrane Polar Domains in Tobacco Pollen Tubes

Affiliations

Analysis of Exocyst Subunit EXO70 Family Reveals Distinct Membrane Polar Domains in Tobacco Pollen Tubes

Juraj Sekereš et al. Plant Physiol. 2017 Mar.

Abstract

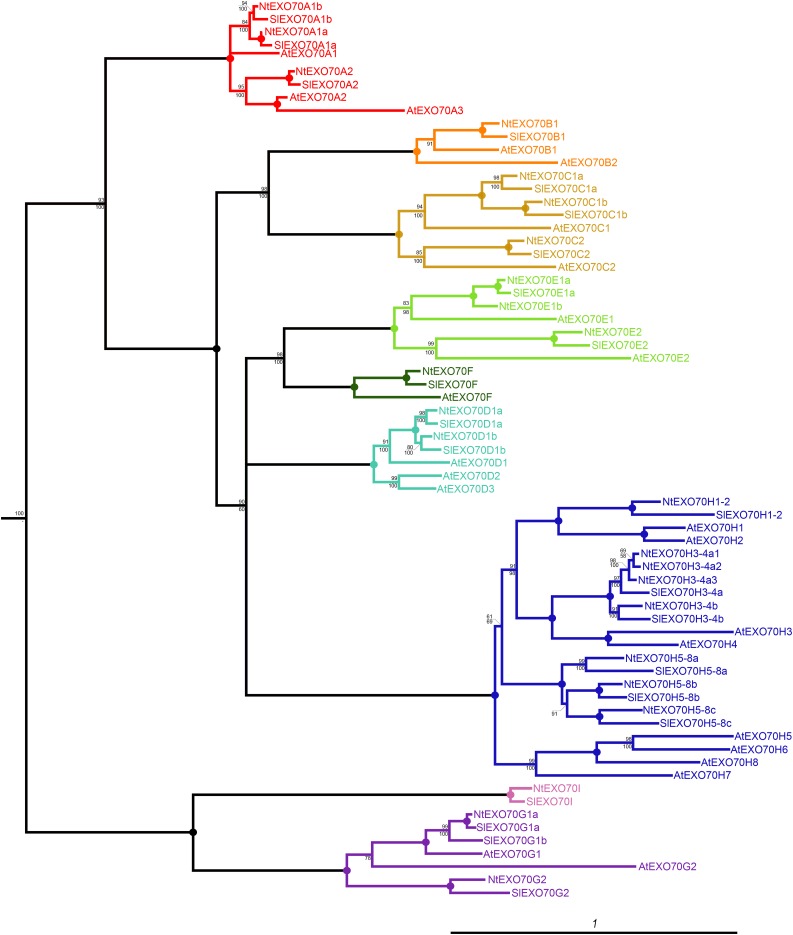
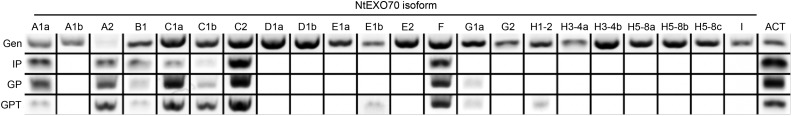
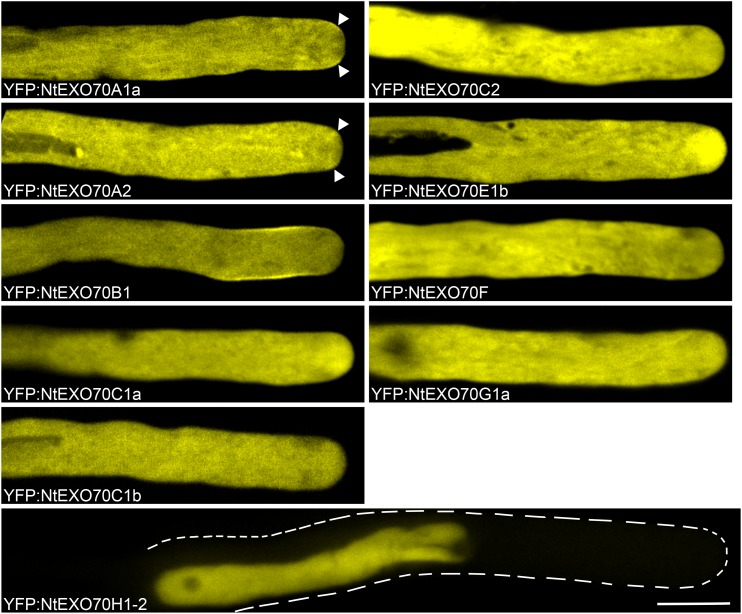
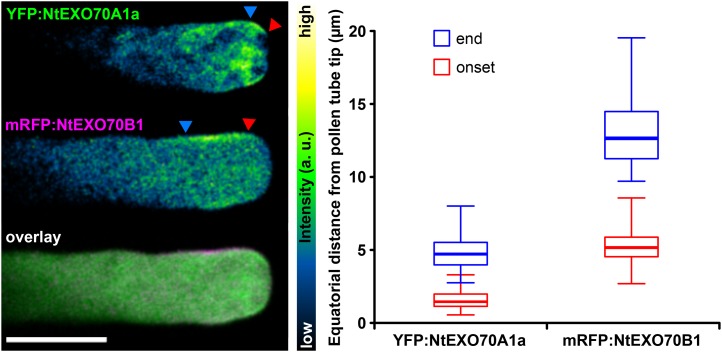
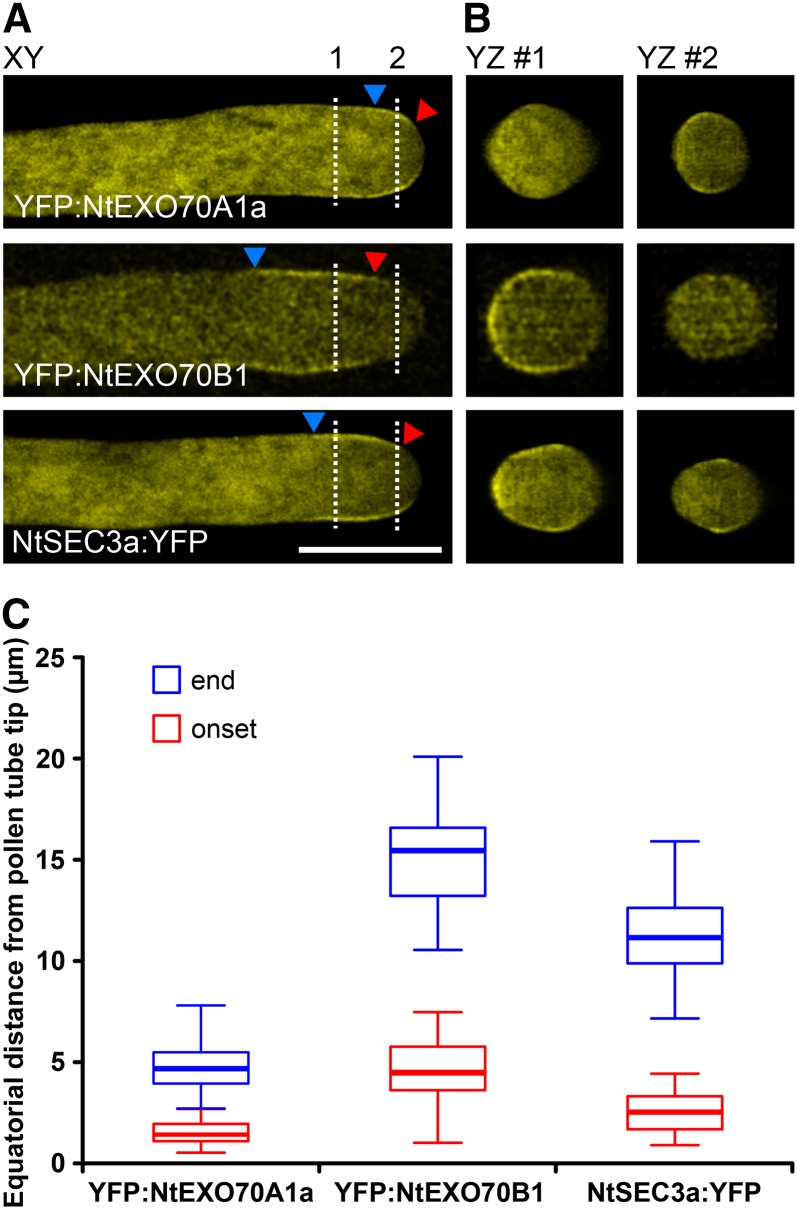
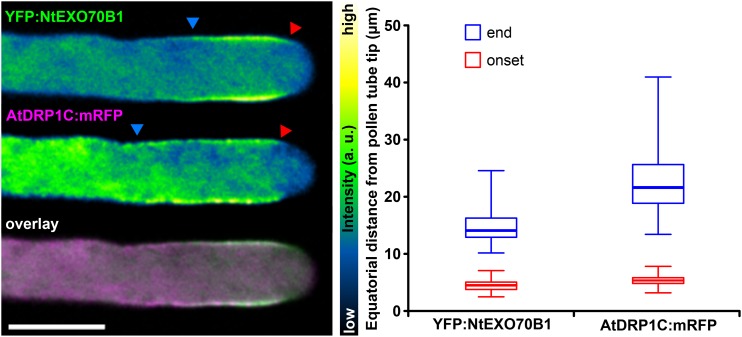
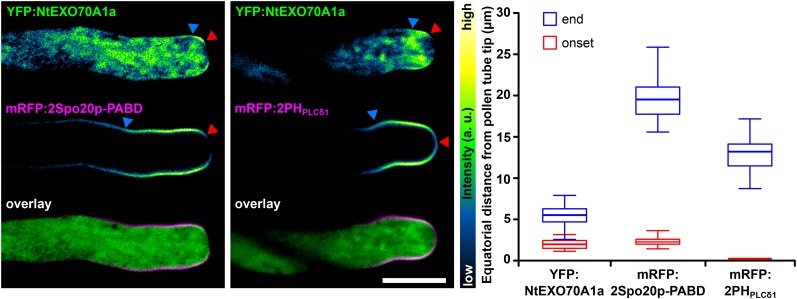
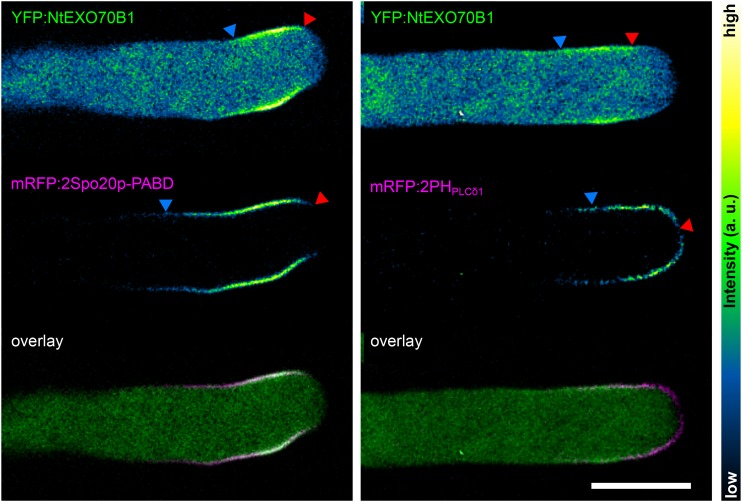
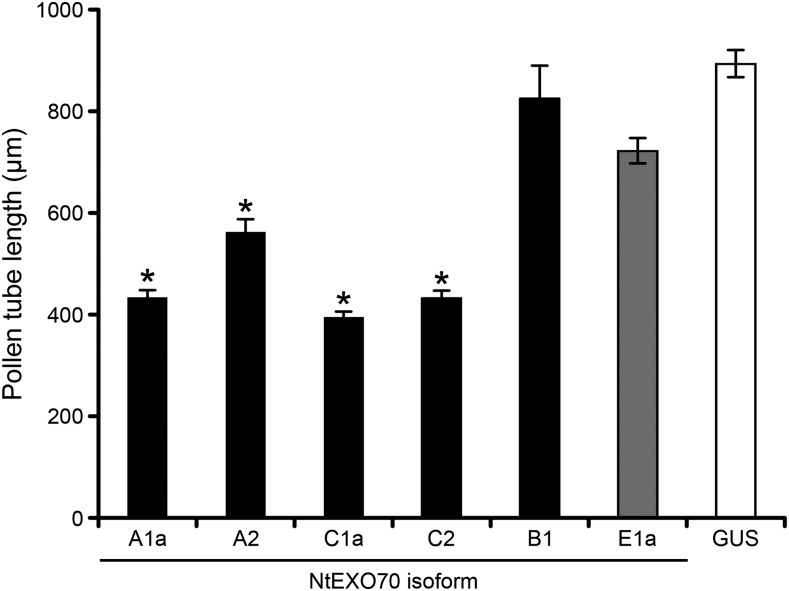
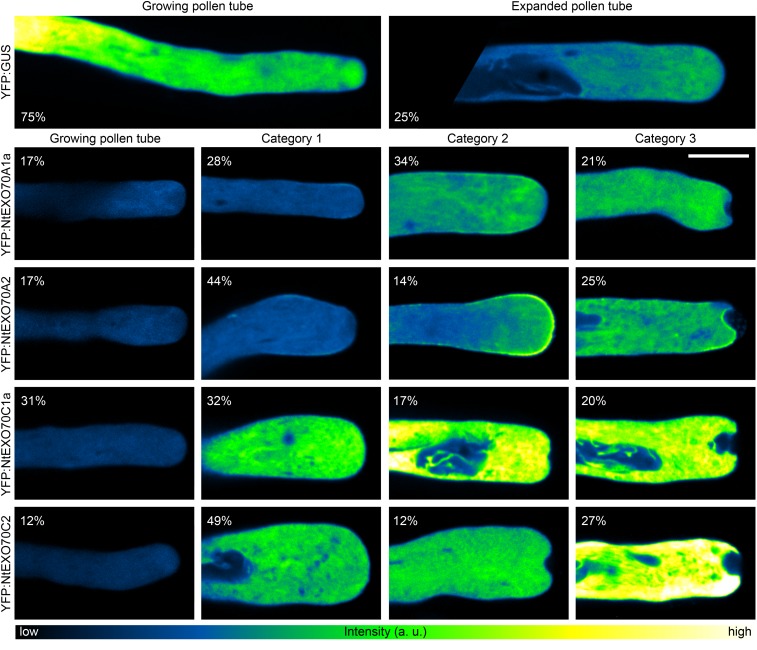
The vesicle-tethering complex exocyst is one of the crucial cell polarity regulators. The EXO70 subunit is required for the targeting of the complex and is represented by many isoforms in angiosperm plant cells. This diversity could be partly responsible for the establishment and maintenance of membrane domains with different composition. To address this hypothesis, we employed the growing pollen tube, a well-established cell polarity model system, and performed large-scale expression, localization, and functional analysis of tobacco (Nicotiana tabacum) EXO70 isoforms. Various isoforms localized to different regions of the pollen tube plasma membrane, apical vesicle-rich inverted cone region, nucleus, and cytoplasm. The overexpression of major pollen-expressed EXO70 isoforms resulted in growth arrest and characteristic phenotypic deviations of tip swelling and apical invaginations. NtEXO70A1a and NtEXO70B1 occupied two distinct and mutually exclusive plasma membrane domains. Both isoforms partly colocalized with the exocyst subunit NtSEC3a at the plasma membrane, possibly forming different exocyst complex subpopulations. NtEXO70A1a localized to the small area previously characterized as the site of exocytosis in the tobacco pollen tube, while NtEXO70B1 surprisingly colocalized with the zone of clathrin-mediated endocytosis. Both NtEXO70A1a and NtEXO70B1 colocalized to different degrees with markers for the anionic signaling phospholipids phosphatidylinositol 4,5-bisphosphate and phosphatidic acid. In contrast, members of the EXO70 C class, which are specifically expressed in tip-growing cells, exhibited exocytosis-related functional effects in pollen tubes despite the absence of apparent plasma membrane localization. Taken together, our data support the existence of multiple membrane-trafficking domains regulated by different EXO70-containing exocyst complexes within a single cell.


Figures

Figure 1.
Figure 1.
Phylogenetic relationship of EXO70 proteins from Arabidopsis (At), tobacco (Nt), and tomato (Sl). The tree represents the protein maximum likelihood phylogeny, where numbers at nodes correspond to the approximate likelihood ratio test with SH (Shimodaira-Hasegawa)-like support from maximum likelihood (top) and posterior probabilities from Bayesian analysis (bottom). Circles represent 100% support by both methods, and branches were collapsed if the inferred topology was not supported by both methods. The tree was rooted using human EXO70 as an outgroup. The scale bar indicates the rate of substitutions per site.
Figure 2.
Figure 2.
Several EXO70 isoforms are expressed in tobacco pollen and growing pollen tubes. Semiquantitative RT-PCR analysis is shown for the EXO70 family in tobacco imbibed pollen (IP), germinating pollen (GP), and growing pollen tube (GPT), with genomic DNA (Gen) used for the control amplification. Actin (ACT) was amplified as a control from the same premix solution. The image shown was assembled from two independent experiments for each tissue. Combinations that did not result in the presence of an active band are represented by blank spaces.
Figure 3.
Figure 3.
Localization of natively pollen-expressed EXO70 isoforms in growing tobacco pollen tubes. Selected YFP-tagged tobacco EXO70 isoforms were transiently expressed in tobacco pollen tubes, and their subcellular localization was examined by spinning disk confocal microscopy. Growing pollen tubes with low expression levels of the transgene are shown. The images shown are representative for 20 or more transformed pollen tubes observed in at least two independent experiments for NtEXO70F, NtEXO70G1a, and NtEXO70H1-2 and for 30 or more transformed pollen tubes in three or more independent experiments for the rest of the isoforms. Arrowheads mark small areas of membrane localization for NtEXO70A1a and concentration of signal in the corresponding area for NtEXO70A2. In the case of NtEXO70H1-2, the contour of the pollen tube is marked because of negligent cytoplasmic signal due to nuclear accumulation of the signal. Bar = 10 µm.
Figure 4.
Figure 4.
Mutually exclusive localization of NtEXO70A1a and NtEXO70B1 in growing tobacco pollen tubes. YFP:NtEXO70A1a and mRFP:NtEXO70B1 were transiently coexpressed in tobacco pollen tubes, and their subcellular localization was examined by spinning disk confocal microscopy with representative results shown (left). Images of individual channels are represented using a color intensity code in order to display local enrichment of the YFP/mRFP signal. In the overlay, YFP is represented by green, mRFP by magenta, and white indicates the overlapping signal. Red and blue arrowheads mark the onset and end of the particular membrane signal, measured in middle optical sections as the equatorial distance from the pollen tube apex (right; n = 25). a.u., Arbitrary unit. Bar = 10 µm.
Figure 5.
Figure 5.
Membrane NtSEC3a localization overlaps with both NtEXO70A1a and NtEXO70B1 localization. YFP:NtEXO70A1a, YFP:NtEXO70B1, and NtSEC3a:YFP were expressed individually in tobacco pollen tubes, and their subcellular localization was examined by optical sectioning using spinning disk confocal microscopy. The main image shows a single optical section at the x-y plane (A), and dashed lines indicate where the stack was sectioned to show the y-z planes (B). Red and blue arrowheads mark the onset and end of the particular membrane signal, measured as the equatorial distance from the pollen tube apex (C; n ≥ 15). Bar = 10 µm.
Figure 6.
Figure 6.
Overlap of NtEXO70B1 localization and the zone of clathrin-mediated endocytosis maximum marked by AtDRP1C. YFP:NtEXO70B1 and AtDRP1C:mRFP were transiently coexpressed in tobacco pollen tubes, and their subcellular localization was examined by spinning disk confocal microscopy with representative results shown (left). Images of individual channels are represented using a color intensity code in order to display local enrichment of the YFP/mRFP signal. In the overlay, YFP is represented by green, mRFP by magenta, and white indicates the overlapping signal. Red and blue arrowheads mark the onset and end of the particular membrane signal, measured as the equatorial distance from the pollen tube apex (right; n = 50). a.u., Arbitrary unit. Bar = 10 µm.
Figure 7.
Figure 7.
Colocalization of NtEXO70A1a with lipid markers in growing tobacco pollen tubes. NtEXO70A1a was transiently coexpressed together with the PA marker mRFP:2Spo20p-PABD (left) and the PIP2 marker mRFP:2PHPLCδ1 (middle), and the subcellular localization of the constructs was examined by spinning disk confocal microscopy. Images of individual channels are represented using a color intensity code in order to display local enrichment of the YFP/mRFP signal. In the overlays, YFP is represented by green, mRFP by magenta, and white indicates the overlapping signal. Red and blue arrowheads mark the onset and end of the particular membrane signal, measured as the equatorial distance from the pollen tube apex (right; n ≥ 13). The onset value for mRFP:2PHPLCδ1 was set to zero because it always covers the very tip of the pollen tube PM. Bar = 10 µm.
Figure 8.
Figure 8.
Colocalization of NtEXO70B1 with lipid markers in growing tobacco pollen tubes. NtEXO70B1 was transiently coexpressed together with the PA marker mRFP:2Spo20p-PABD (left) and the PIP2 marker mRFP:2PHPLCδ1 (right), and the subcellular localization of the constructs was examined by spinning disk confocal microscopy with representative results shown. Images of individual channels are represented using a color intensity code in order to display local enrichment of the YFP/mRFP signal. In the overlays, YFP is represented by green, mRFP by magenta, and white indicates the overlapping signal. Red and blue arrowheads mark the onset and end of the particular membrane signal. a.u., Arbitrary unit. Bar = 10 µm.
Figure 9.
Figure 9.
Overexpression of the major pollen EXO70 class members inhibits pollen tube growth. Tobacco pollen tubes transiently expressing high levels (5 µg of DNA) of selected tagged EXO70 isoforms and control (YFP-tagged GUS) were imaged 8 h after biolistic transformation by epifluorescence microscopy, and pollen tube lengths were determined. At least 100 cells from at least two independent transformations were measured for each construct. Asterisks indicate significant differences (P < 0.001) from the corresponding controls (GUS and NtEXO70E1a) according to ANOVA followed by posthoc multiple mean comparison test with Tukey contrasts using the multcomp R package. Data represent means of 100 or more pollen tubes ± se.
Figure 10.
Figure 10.
Effects of major pollen EXO70 isoform overexpression on the phenotypes of tobacco pollen tubes. Tobacco pollen tubes transiently expressing high levels of selected tagged EXO70 isoforms were imaged 8 h after biolistic transformation by spinning disk confocal microscopy. For each EXO70 isoform, pollen tubes were classified into four phenotypic categories (with the percentage of occurrence shown for each image). Control pollen tubes expressing YFP:GUS could be classified only into two categories. Images are displayed using a color intensity code with the same upper limit set for all images (see “Materials and Methods”), and the representative images thus reflect differences in signal intensity between the individual pollen tubes. The data are based on 33 or more transformed pollen tubes observed for each construct in three independent experiments. a.u., Arbitrary unit. Bar = 10 µm.

References

    1. Afzal AJ, Kim JH, Mackey D (2013) The role of NOI-domain containing proteins in plant immune signaling. BMC Genomics 14: 327. - PMC - PubMed
    1. Bloch D, Pleskot R, Pejchar P, Potocký M, Trpkošová P, Cwiklik L, Vukašinović N, Sternberg H, Yalovsky S, Žárský V (2016) Exocyst SEC3 and phosphoinositides define sites of exocytosis in pollen tube initiation and growth. Plant Physiol 172: 980–1002 - PMC - PubMed
    1. Bodemann BO, Orvedahl A, Cheng T, Ram RR, Ou YH, Formstecher E, Maiti M, Hazelett CC, Wauson EM, Balakireva M, et al. (2011) RalB and the exocyst mediate the cellular starvation response by direct activation of autophagosome assembly. Cell 144: 253–267 - PMC - PubMed
    1. Bosch M, Cheung AY, Hepler PK (2005) Pectin methylesterase, a regulator of pollen tube growth. Plant Physiol 138: 1334–1346 - PMC - PubMed
    1. Bove J, Vaillancourt B, Kroeger J, Hepler PK, Wiseman PW, Geitmann A (2008) Magnitude and direction of vesicle dynamics in growing pollen tubes using spatiotemporal image correlation spectroscopy and fluorescence recovery after photobleaching. Plant Physiol 147: 1646–1658 - PMC - PubMed

Publication types

MeSH terms

LinkOut - more resources