Continental drift and plateau uplift control origination and evolution of Asian and Australian monsoons
- PMID: 28084310
- PMCID: PMC5233948
- DOI: 10.1038/srep40344
Continental drift and plateau uplift control origination and evolution of Asian and Australian monsoons
Abstract
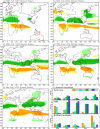
Evolutions of Asian and Australian monsoons have important significance for understanding the past global change but are still a controversial subject. Here, we explore systematically the effects of plate movement and plateau uplift on the formation and evolution of the Asian and Australian monsoons by numerical simulations based on land-sea distributions and topographic conditions for five typical geological periods during the Cenozoic. Our results suggest that the timings and causes of formation of the monsoons in South Asia, East Asia and northern Australia are different. The Indian Subcontinent, which was located in the tropical Southern Hemisphere in the Paleocene, was influenced by the austral monsoon system simulated at that time. Once it moved to the tropical Northern Hemisphere in the Eocene, the South Asian monsoon established and remained persistently thereafter. However, the monsoons of East Asia and northern Australia did not appear until the Miocene. The establishment of the simulated low-latitude South Asian (northern Australian) monsoon appeared to have strongly depended on the location of mainland India (Australia), associated with northward plate motion, without much relation to the plateau uplift. On the contrary, the establishment of the mid-latitude East Asian monsoon was mainly controlled by the uplift of Tibetan plateau.
Figures


Similar articles
-
Evolution of Asian monsoons and phased uplift of the Himalaya-Tibetan plateau since Late Miocene times.Nature. 2001 May 3;411(6833):62-6. doi: 10.1038/35075035. Nature. 2001. PMID: 11333976
-
Tibet, the Himalaya, Asian monsoons and biodiversity - In what ways are they related?Plant Divers. 2017 Sep 14;39(5):233-244. doi: 10.1016/j.pld.2017.09.001. eCollection 2017 Oct. Plant Divers. 2017. PMID: 30159517 Free PMC article. Review.
-
Paleogeography control of Indian monsoon intensification and expansion at 41 Ma.Sci Bull (Beijing). 2021 Nov 30;66(22):2320-2328. doi: 10.1016/j.scib.2021.07.023. Epub 2021 Jul 21. Sci Bull (Beijing). 2021. PMID: 36654458
-
Constraints on the early uplift history of the Tibetan Plateau.Proc Natl Acad Sci U S A. 2008 Apr 1;105(13):4987-92. doi: 10.1073/pnas.0703595105. Epub 2008 Mar 24. Proc Natl Acad Sci U S A. 2008. PMID: 18362353 Free PMC article.
-
The Origin of Evergreen Broad-Leaved Forests in East Asia from the Evidence of Floristic Elements.Plants (Basel). 2024 Apr 16;13(8):1106. doi: 10.3390/plants13081106. Plants (Basel). 2024. PMID: 38674515 Free PMC article. Review.
Cited by
-
Understanding Past, and Predicting Future, Niche Transitions based on Grass Flowering Time Variation.Plant Physiol. 2020 Jul;183(3):822-839. doi: 10.1104/pp.20.00100. Epub 2020 May 13. Plant Physiol. 2020. PMID: 32404414 Free PMC article. Review.
-
Genetically- and environmentally-dependent processes drive interspecific and intraspecific divergence in the Chinese relict endemic genus Dipteronia.Plant Divers. 2024 Apr 26;46(5):585-599. doi: 10.1016/j.pld.2024.04.008. eCollection 2024 Sep. Plant Divers. 2024. PMID: 39290880 Free PMC article.
-
Identifying long-term stable refugia for relict plant species in East Asia.Nat Commun. 2018 Oct 26;9(1):4488. doi: 10.1038/s41467-018-06837-3. Nat Commun. 2018. PMID: 30367062 Free PMC article.
References
-
- Webster P. J. et al.. Monsoons: processes, predictability, and the prospects for prediction. J. Geophys. Res. Oceans 103, 14451–14510 (1998).
-
- Wang B. & Ding Q. Changes in global monsoon precipitation over the past 56 years. Geophys. Res. Lett. 33, L06711, doi: 10.1029/2005GL025347 (2006). - DOI
-
- Wang P. X. et al.. The global monsoon across timescales: coherent variability of regional monsoons. Clim. Past 10, 2007–2052 (2014).
-
- Quade J., Cerling T. E. & Bowman J. R. Development of Asian monsoon revealed by marked ecological shift during the Latest Miocene in northern Pakistan. Nature 342, 163–166 (1989).
-
- Gupta A. K., Yuvaraja A., Prakasam M., Clemens S. C. & Velub A. Evolution of the South Asian monsoon wind system since the late Middle Miocene. Palaeogeogr. Palaeoclimatol. Palaeoecol. 438, 160–167 (2015).
Publication types
LinkOut - more resources
Full Text Sources
Other Literature Sources
Miscellaneous

