. 2017 Jan 13:7:40699.
doi: 10.1038/srep40699.

DOPAL derived alpha-synuclein oligomers impair synaptic vesicles physiological function

Affiliations

DOPAL derived alpha-synuclein oligomers impair synaptic vesicles physiological function

N Plotegher et al. Sci Rep. .

Abstract

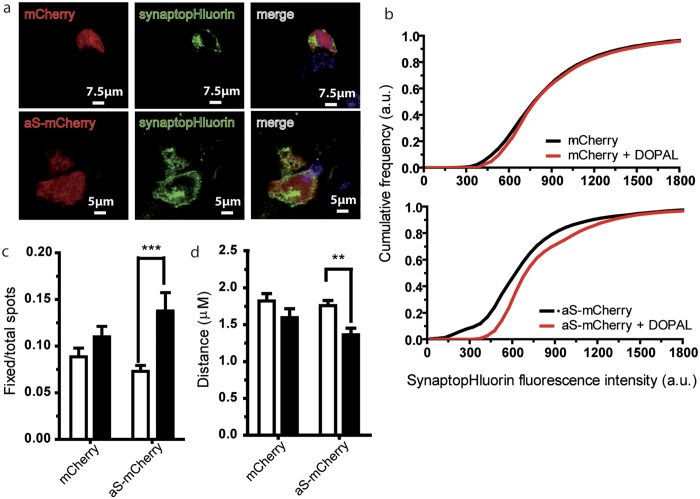
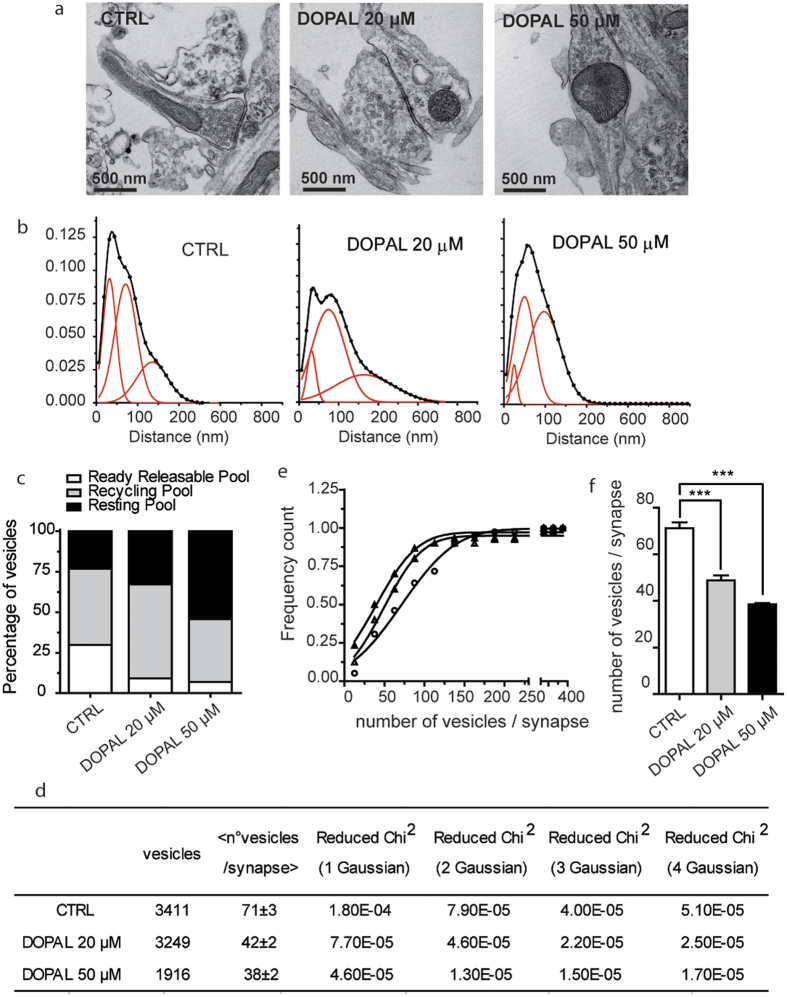
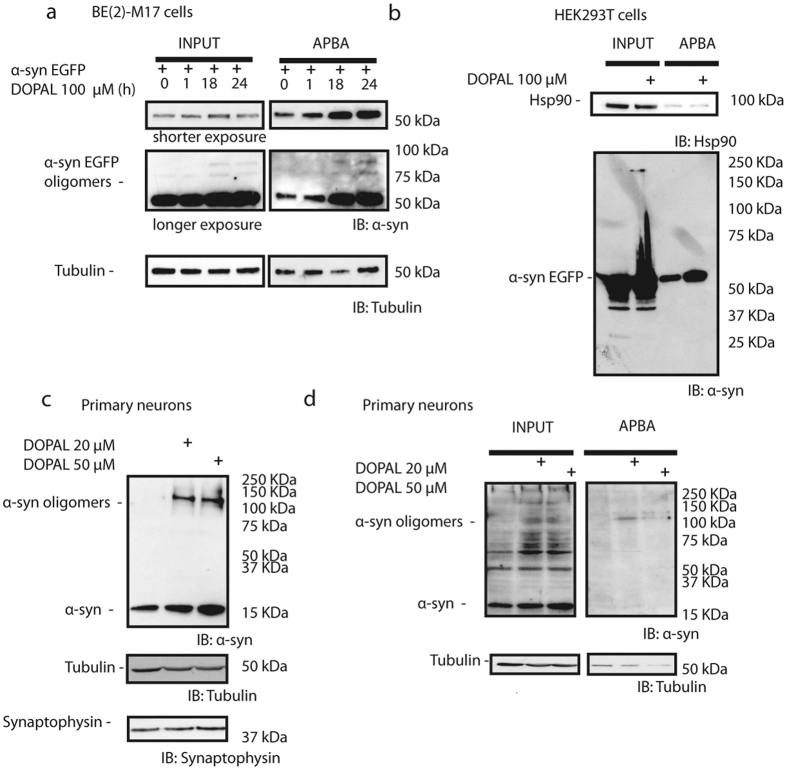
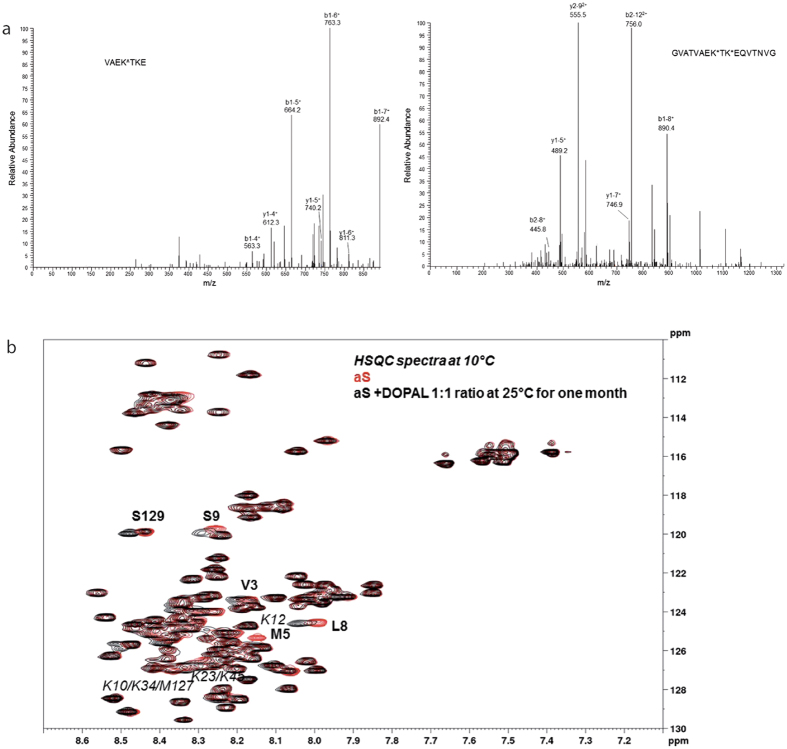
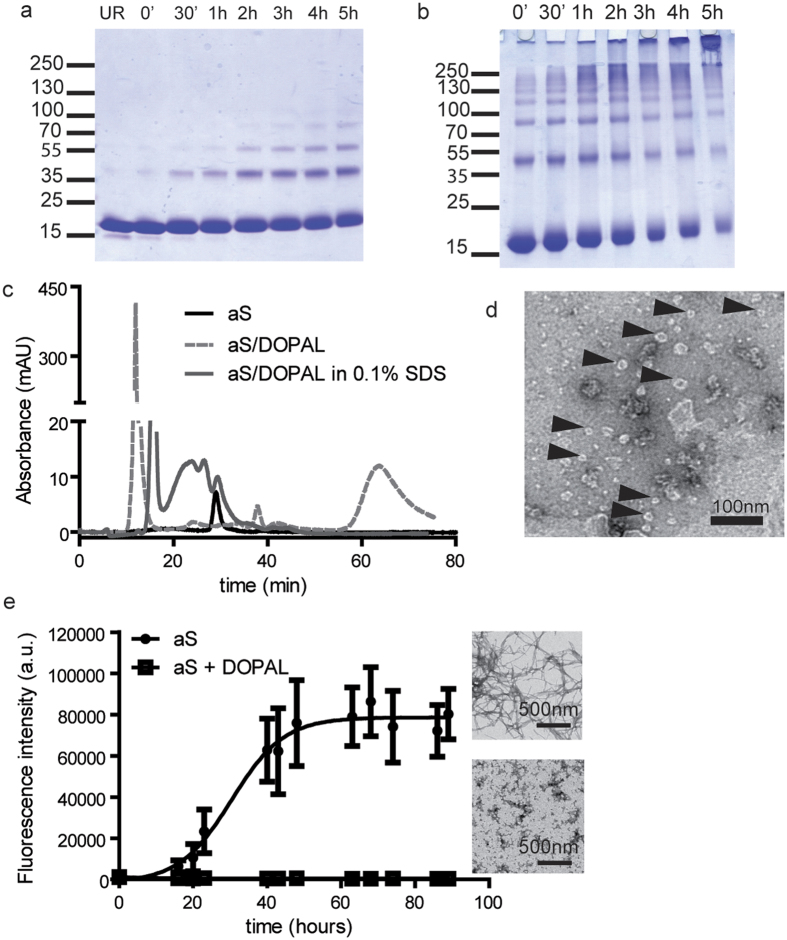
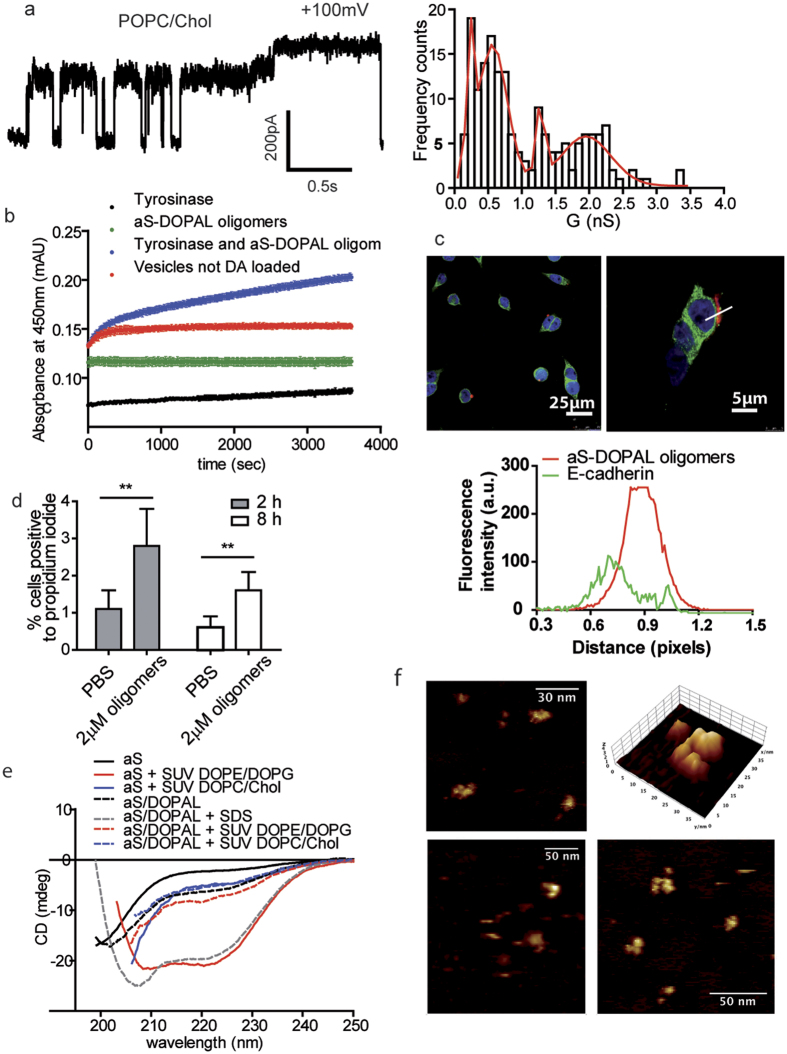
Parkinson's disease is a neurodegenerative disorder characterized by the death of dopaminergic neurons and by accumulation of alpha-synuclein (aS) aggregates in the surviving neurons. The dopamine catabolite 3,4-dihydroxyphenylacetaldehyde (DOPAL) is a highly reactive and toxic molecule that leads to aS oligomerization by covalent modifications to lysine residues. Here we show that DOPAL-induced aS oligomer formation in neurons is associated with damage of synaptic vesicles, and with alterations in the synaptic vesicles pools. To investigate the molecular mechanism that leads to synaptic impairment, we first aimed to characterize the biochemical and biophysical properties of the aS-DOPAL oligomers; heterogeneous ensembles of macromolecules able to permeabilise cholesterol-containing lipid membranes. aS-DOPAL oligomers can induce dopamine leak in an in vitro model of synaptic vesicles and in cellular models. The dopamine released, after conversion to DOPAL in the cytoplasm, could trigger a noxious cycle that further fuels the formation of aS-DOPAL oligomers, inducing neurodegeneration.


Figures

Figure 1
Figure 1. DOPAL effect on vesicle trafficking in aS overexpressing cells.
(a) Confocal images of BE(2)-M17 cells transfected with mCherry or aS-mCherry and synapto-pHluorin. (b) Normalized fluorescence intensity/number of vesicles cumulative graphs for mCherry and aS. Black and red traces refer to untreated cells, and cells treated with DOPAL 100 μM for 24 hours. (c) Histograms express the ratio between fixed (see Methods for details) and total vesicles over a certain period of time, i.e. the number of vesicles showing a high fluorescent value for the whole time span of the measure, for mCherry or aS-mCherry overexpressing cells untreated or treated with 100 μM for 24 hours. (d) Average distance covered by vesicles in cells overexpressing mCherry or aS-mCherry at time 0 and after 100 μM DOPAL treatment at 24 hours. White and black stand for control cells and cells treated with 100 μM DOPAL for 24 hours. Bars represent mean ± SEM from n = 25–30 cells from at least three independent experiments. Asterisks indicate statistical significance by two-way ANOVA (**p < 0.01, ***p < 0.001).
Figure 2
Figure 2. DOPAL effect on synaptic vesicles in primary mouse neurons.
(a) TEM images of mice primary neurons synapses not treated (CTRL) and treated with 20 μM and 50 μM DOPAL. (b) Frequency distribution of vesicles distance from the active zone of primary neurons in control, treated with 20 μM and 50 μM DOPAL (from left to right). Data were fitted with a three Gaussian function (OriginPro8). The dots represent the experimental points, the black continuous line is the best fit generated by sum of the contributing Gaussian curves (red continuous lines). (c) Grouped stack column plot of the percentage of area under curve of the three vesicle populations, representing the percentage of vesicles belonging to the ready-releasable (white), recycling (grey) and resting (black) pools in control neurons and in neurons treated with 20 μM and 50 μM DOPAL. (d) Summary of the parameters derived from the TEM images analysis: number of total vesicles, number of total synapses, average number of vesicles per synapse, and the value of the reduced Chi-Squared for fits with one, two, three and four Gaussian curves (OriginPro8), suggesting that the best fit is the one with three Gaussian curves. (e) Cumulative distributions of the number of vesicles per synapse show that the number of vesicles per synapse is higher in controls (full triangle) than in neurons treated with 20 μM and 50 μM DOPAL (empty triangles and empty circles, respectively). (f) Histograms representing the average inflection point values of the cumulative distribution of the number of vesicles/synapse showing a significant reduction after 20 μM and 50 μM DOPAL treatment. Bars represent mean ± SEM from n = 30–39 synapses from at least three independent experiments. Asterisks indicate statistical significance by two-way ANOVA (***p < 0.001).
Figure 3
Figure 3. aS-DOPAL oligomers are found in neuronal cell models upon DOPAL treatment.
(a) Western blot analysis of BE(2)-M17 cells overexpressing aS-mCherry and treated with 100 μM DOPAL for 1 hour, 18 hours or 24 hours. aS antibody detected aS monomers and oligomers (left) and after the pull-down with ABPA resin (right) the band showing monomeric aS modified by DOPAL is larger than the control after 18 or 24 hours treatment. (b) Western blot analysis of HEK293 cells treated with 100 μM DOPAL showing DOPAL-induced aS oligomers at high molecular weight (left) and the pull-down with ABPA resin (right) show that DOPAL-modified aS monomer is accumulated upon treatment. (c) Western blot of primary cortical neurons upon 20 μM and 50 μM DOPAL treatment show monomeric aS and aS-DOPAL oligomers accumulation. (d) ABPA resin pull-down from neuronal lysate of control and treated samples suggested that the accumulated monomeric aS is modified by DOPAL.
Figure 4
Figure 4. Mass spectra HSQC-NMR spectra of DOPAL modified aS.
(a) In the left panel, MS/MS spectrum of the peak assigned to the VAEKTKE peptide (55–61 residues of aS) with the K58 residue bound to DOPAL, resulting in a 136 amu increase in peptide mass. This peptide was observed when aS reaction with DOPAL was performed in reducing conditions. The assignments of y and b ion series are reported (all are in mono-charged state). In the right panel, MS/MS spectrum of the peak assigned to the GVATVAEKTKEQVTNVG peptide (51–67 residues of aS) with the K58 and K60 residues bound to DOPAL, resulting in a 134 amu increase in peptide mass for each modification. This peptide was observed in aS-DOPAL in cell cultures experiments. The assignments of y and b ion series are reported (either in mono- or double-charged state). (b) Spectra overlap of 15N-1H HSQC spectra recorded at 10 °C for a sample of 15N labelled aS (160.5 μM) alone (red) or incubated with DOPAL for 1 month at 25 °C in a stoichiometric ratio of 1:1 (black).
Figure 5
Figure 5. Biophysical and biochemical characterization of aS-DOPAL monomer and oligomers.
(a) SDS-PAGE of samples from the aS and DOPAL reaction performed at 25 °C for 5 hours collected at different time points. The reaction products were obtained reacting 67 μM aS in a stoichiometric ratio of 1:20 with DOPAL. (b) SDS-PAGE showing the reaction products of 310 μM aS in a stoichiometric ratio of 1:5 with DOPAL. (c) Size-exclusion chromatography of monomeric aS compared to the reaction products of 67 μM aS in a stoichiometric ratio of 1:20 with DOPAL, which are large oligomers eluting in the void volume of the column. The graph also shows the chromatographic profile of aS-DOPAL oligomers in the presence of 0.1% SDS. The elution profile of aS-DOPAL oligomers changes in the presence of SDS and shows peaks at lower molecular weights further confirming that SDS can disaggregate the aS-DOPAL non-covalent oligomers into the ensemble of dimers, trimers and tetramers reported in panel a. (d) TEM image of aS-DOPAL oligomers showing annular shapes. (e) ThT kinetic of aS aggregation alone (full circles) shows the typical sigmoidal shape and lead to the formation of canonical amyloid fibrils. The aggregation process of aS-DOPAL molecules (empty squares) shows that they do not acquire a beta-sheet structure and the final products of the aggregation are not fibrils but amorphous aggregates.
Figure 6
Figure 6. Permeabilization ability of aS-DOPAL oligomers in different membrane models.
(a) Planar Lipid Membrane experiments showing the permeabilization ability of aS-DOPAL oligomers in lipid membranes constituted by POPC/CHO, and relative conductances distribution to characterize the pores formed. The same permeabilization was not present when the planar membranes were prepared with DOPE/DOPG. (b) POPC/CHO SUVs mimicking synaptic vesicles composition and loaded with DA were permeabilized by aS-DOPAL oligomers and allowed the release of DA as measured by monitoring the Tyrosinase dependent Dopachrome formation at 505 nm (blue). When SUVs were not loaded with DA (red) or Tyrosinase was removed from the SUVs solution in the presence of aS-DOPAL oligomers (green), there was no formation of Dopachrome. When only Tyrosinase was added to the DA loaded SUVs (black), a small increase in the measured absorbance was observed probably because of DA leaking. (c) Confocal images of aS-DOPAL oligomers (red) localized at the plasma membrane (green) of BE(2)-M17 cells. (d) Permeabilization of BE(2)-M17 cells by aS-DOPAL oligomers as measured by propidium iodide after 2 and 8 hours treatment. (e) CD measurement of monomeric aS and aS-DOPAL oligomers alone and in the presence or absence of POPC/CHO or DOPE/DOPG SUVs show that aS-DOPAL oligomers can acquire an alpha-helical structure only in the presence of SDS which is able to disaggregate large non-covalent oligomers. (f) AFM images of aS-DOPAL oligomers performed on POPC/CHO lipid monolayer in liquid show that they present the annular shape previously observed by TEM by us and for other aS oligomeric species by others.

Similar articles

Cited by

References

    1. German D. C., Manaye K., Smith W. K., Woodward D. J. & Saper C. B. Midbrain dopaminergic cell loss in Parkinson’s disease: computer visualization. Ann Neurol 26, 507–514 (1989). - PubMed
    1. Bisaglia M., Greggio E., Beltramini M. & Bubacco L. Dysfunction of dopamine homeostasis: Clues in the hunt for novel Parkinson’s disease therapies. FASEB J 27, 2101–2110 (2013). - PubMed
    1. Goldstein D. S., Kopin I. J. & Sharabi Y. Catecholamine autotoxicity. Implications for pharmacology and therapeutics of Parkinson disease and related disorders. Pharmacol Ther 1110 (2014). - PMC - PubMed
    1. Galvin J. E. Interaction of alpha-synuclein and dopamine metabolites in the pathogenesis of Parkinson’s disease: a case for the selective vulnerability of the substantia nigra. Acta Neuropathol 112, 115–126 (2006). - PubMed
    1. Goldstein D. S. et al.. Determinants of buildup of the toxic dopamine metabolite DOPAL in Parkinson’s disease. J Neurochem 126, 591–603 (2013). - PMC - PubMed

Publication types

MeSH terms