

What do these scores mean? Presenting patient-reported outcomes data to patients and clinicians to improve interpretability
- PMID: 28085201
- PMCID: PMC5419857
- DOI: 10.1002/cncr.30530
What do these scores mean? Presenting patient-reported outcomes data to patients and clinicians to improve interpretability
Abstract
Background: Patient-reported outcomes (PROs) (eg, symptoms, functioning) can inform patient management. However, patients and clinicians often have difficulty interpreting score meaning. The authors tested approaches for presenting PRO data to improve interpretability.
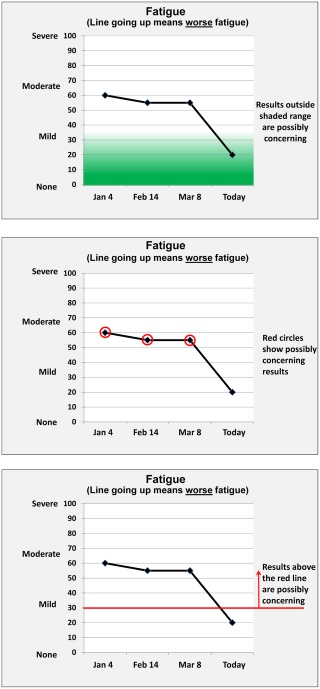
Methods: This mixed-methods study included an Internet survey of cancer patients/survivors, oncology clinicians, and PRO researchers circulated via snowball sampling, plus individual in-person interviews. Clinical importance was conveyed using 3 approaches (presented in random order): normal score range shaded green, concerning scores circled in red, and red threshold lines indicating normal versus concerning scores. Versions also tested 2 approaches to score directionality: higher = more (better for function, worse for symptoms) and higher = better for both function and symptoms. Qualitative data from online comments and in-person interviews supplemented quantitative results on interpretation accuracy, clarity, and the "most useful" format.
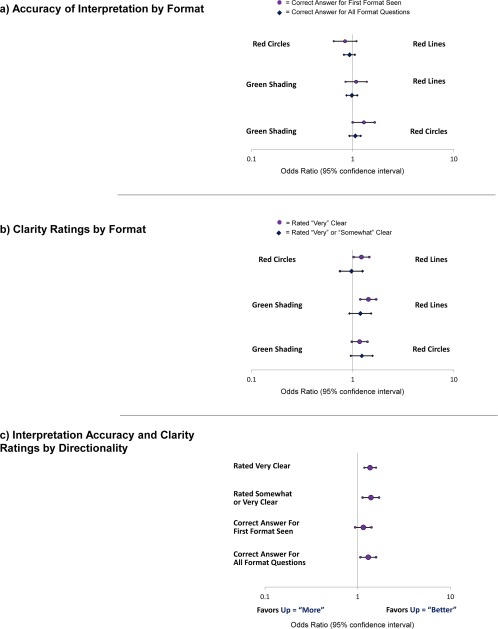
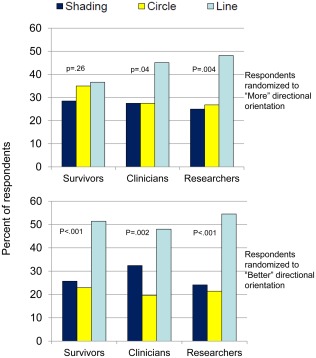
Results: The survey included 1113 respondents: 627 survivors, 236 clinicians, and 250 researchers, plus 10 patients and 10 clinicians who were purposively sampled interviewees. Interpretation accuracy ranged from 53% to 100%. The formats in which higher = better were interpreted more accurately versus those in which higher = more (odds ratio [OR], 1.30; 95% confidence interval [CI], 1.07-1.58) and were more likely to be rated "very"/"somewhat" clear (OR, 1.39; 95% CI, 1.13-1.70) and "very" clear (OR, 1.36; 95% CI, 1.18-1.58). Red circle formats were interpreted more accurately than green-shaded formats when the first format presented (OR, 1.29; 95% CI, 1.00-1.65). Threshold-line formats were more likely to be rated "very" clear than green-shaded (OR, 1.43; 95% CI, 1.19-1.71) and red-circled (OR, 1.22, 95% CI, 1.02-1.46) formats. Threshold lines were most often selected as "most useful."
Conclusions: The current results support presenting PRO data with higher = better directionality and threshold lines indicating normal versus concerning scores. Cancer 2017;123:1848-1859. © 2017 The Authors. Cancer published byWiley Periodicals, Inc. on behalf of American Cancer Society. This is an open access article under the terms of the Creative Commons Attribution-NonCommercial-NoDerivs License, which permits use and distribution in any medium, provided the original work is properly cited, the use is non-commercial and no modifications or adaptations aremade.
Keywords: cancer; clinical practice; interpretation; patient management; patient-reported outcomes.
© 2017 The Authors. Cancer published by Wiley Periodicals, Inc. on behalf of American Cancer Society.
Figures

References
-
- Greenhalgh J. The applications of PROs in clinical practice: what are they, do they work, and why? Qual Life Res. 2009;18:115–123. - PubMed
-
- Velikova G, Booth L, Smith AB, et al. Measuring quality of life in routine oncology practice improves communication and patient well being: a randomized controlled trial. J Clin Oncol. 2004;22:714–724. - PubMed
-
- Santana MJ, Feeny D, Johnson JA, et al. Assessing the use of health‐related quality of life measures in the routine clinical care of lung‐transplant patients. Qual Life Res. 2010;19:371–379. - PubMed
Publication types
MeSH terms
Grants and funding
LinkOut - more resources
Full Text Sources
Other Literature Sources
Miscellaneous
