. 2017 Mar 4;14(3):347-360.
doi: 10.1080/15476286.2017.1279786. Epub 2017 Jan 13.

MicroRNA-432 targeting E2F3 and P55PIK inhibits myogenesis through PI3K/AKT/mTOR signaling pathway

Affiliations

MicroRNA-432 targeting E2F3 and P55PIK inhibits myogenesis through PI3K/AKT/mTOR signaling pathway

Meilin Ma et al. RNA Biol. .

Abstract

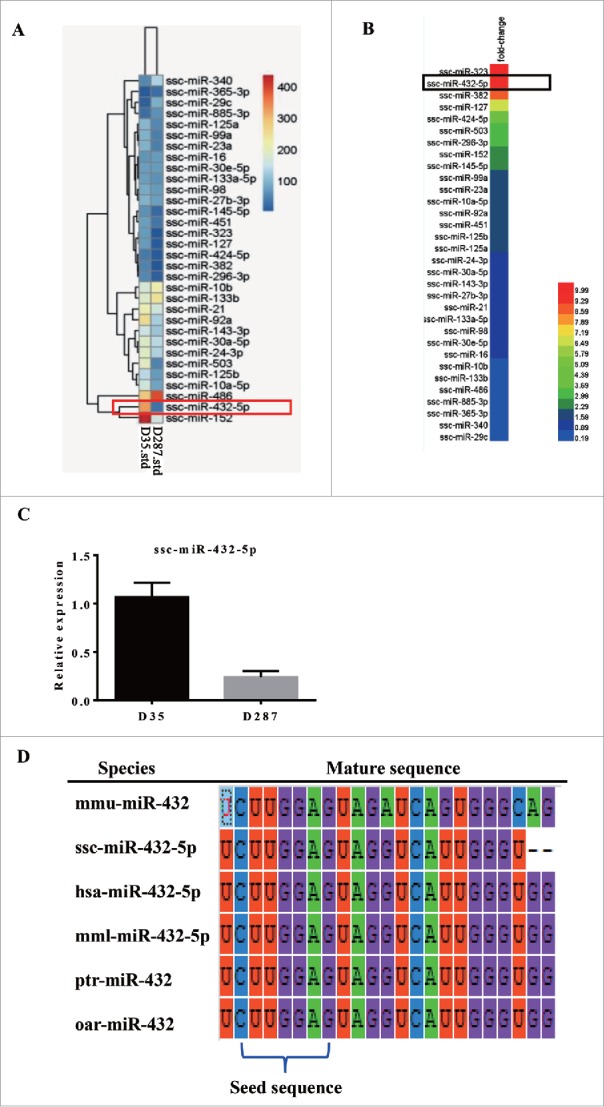
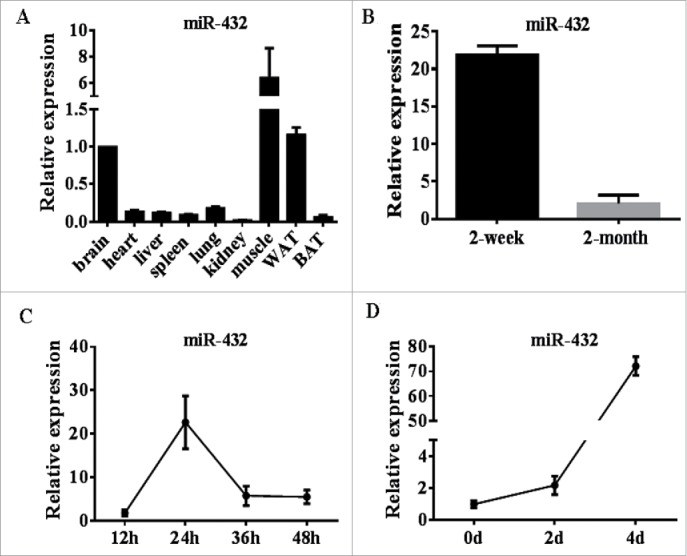
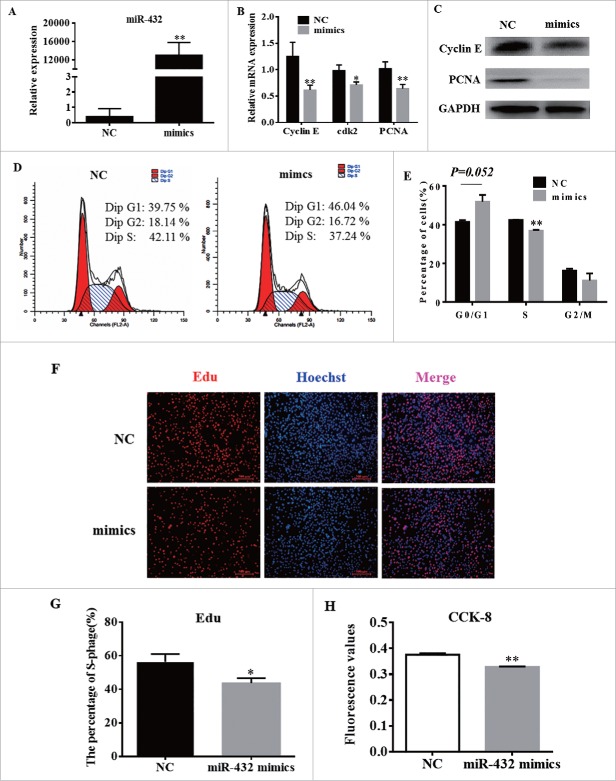
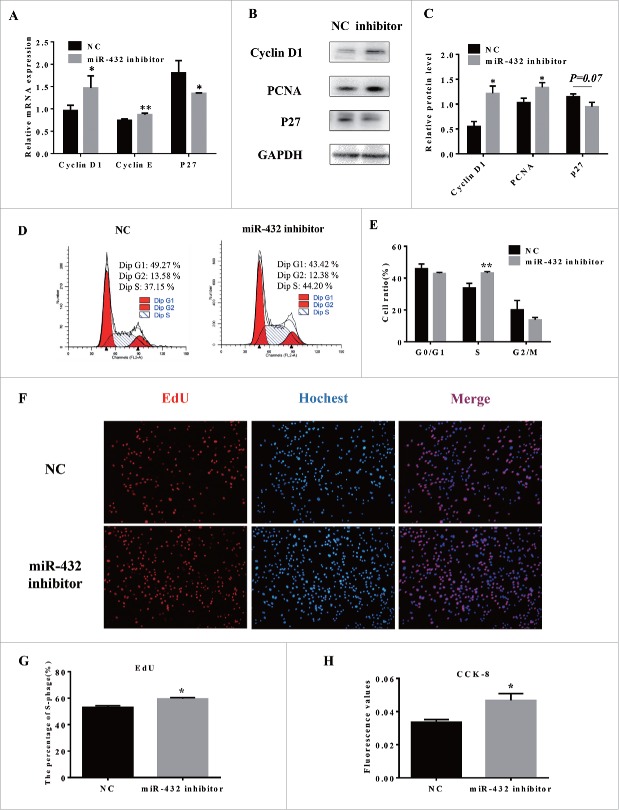
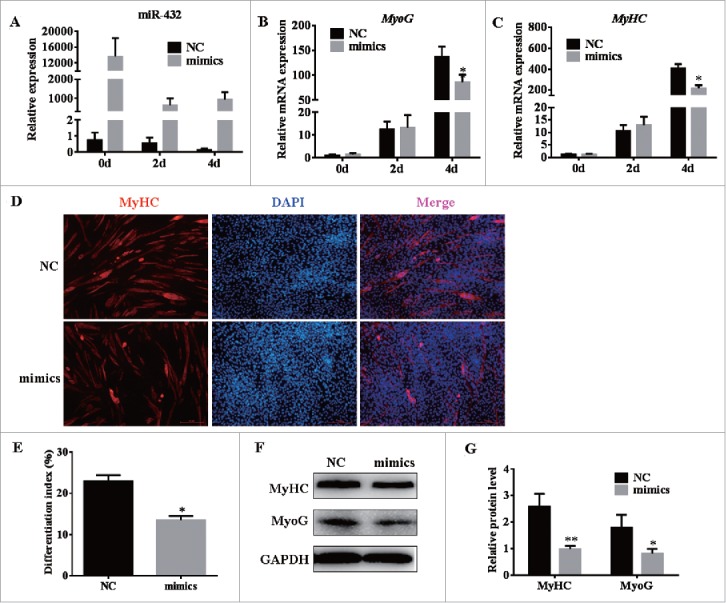
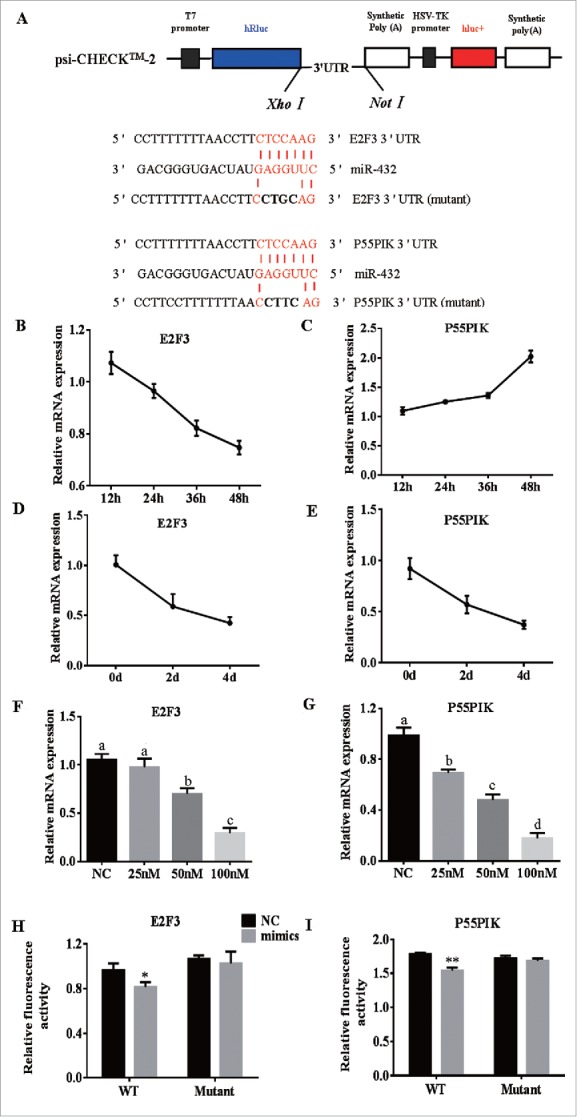
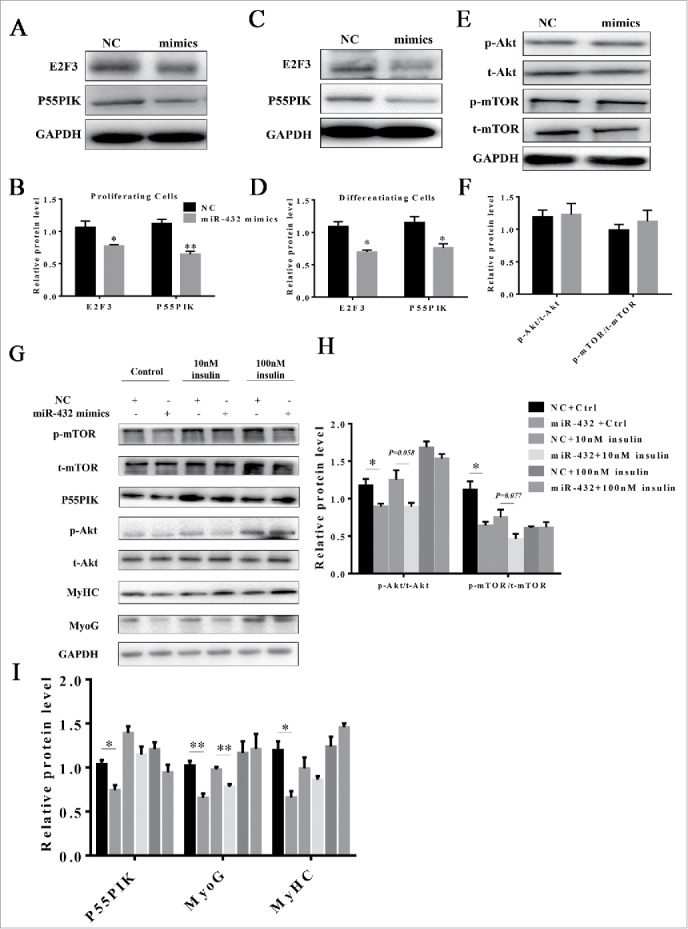
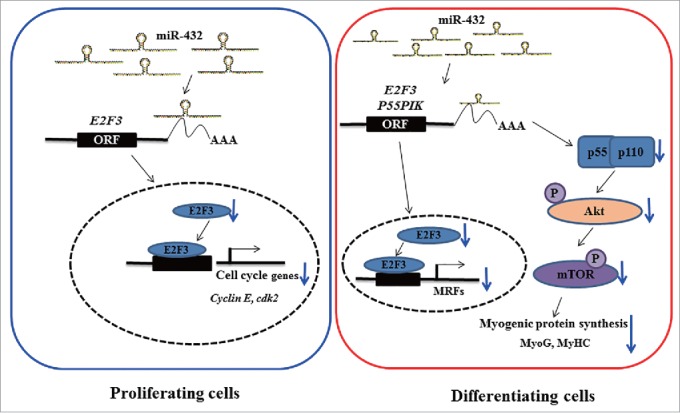
Skeletal muscle is the dominant executant in locomotion and regulator in energy metabolism. Embryonic myogenesis and postnatal muscle growth are controlled by a cascade of transcription factors and epigenetic regulatory mechanisms. MicroRNAs (miRNAs), a family of non-coding RNA of 22 nucleotides in length, post-transcriptionally regulates expression of mRNA by pairing the seed sequence to 3' UTR of target mRNA. Increasing evidence has demonstrated that miRNAs are important regulators in diverse myogenic processes. The profiling of miRNA expression revealed that miR-432 is more enriched in the longissimus dorsi of 35-day-old piglets than that of adult pigs. Our gain of function study showed that miR-432 can negatively regulate both myoblast proliferation and differentiation. Mechanically, we found that miR-432 is able to down-regulate E2F transcription factor 3 (E2F3) to inactivate the expression of cell cycle and myogenic genes. We also identified that phosphatidylinositol 3-kinase regulatory subunit (P55PIK) is another target gene of miR-432 in muscle cells. downregulation of P55PIK by miR-432 leads to inhibition of P55PIK-mediated PI3K/AKT/mTOR signaling pathway during differentiation. The blocking effect of miR-432 on this pathway can be rescued by insulin treatment. Taken together, our findings identified microRNA-432 as a potent inhibitor of myogenesis which functions by targeting E2F3 and P55PIK in muscle cells.

Keywords: E2F3; P55PIK; PI3K/Akt/mTOR pathway; microRNA-432; myogenesis.


Figures

Figure 1.
Figure 1.
MiR-432 is a candidate regulator in myogenesis. (A) The partial microRNA sequencing results of longissimus dorsi from 35-day-old weaned Rongchang piglets and 287-day-old adult Rongchang pigs, respectively. Different colors represented the relative expression. (B) The fold change of miRNAs in 1A. (C) Relative expression of miR-432-5p in 35-day-old piglets and 287-day-old pigs by real time quantitative PCR (RT qPCR). Each treatment was carried out in triplicate and repeated 3 times. Data were representative of means ± SD. (D) Comparation of miR-432 seed sequence from mice, pig, human, macaca mulatta, pan troglodytes and ovis aries.
Figure 2.
Figure 2.
The profiles of miR-432 in mice different tissues and during C2C12 cell myogenesis. (A) The expression level of miR-432 in different tissues of mice. (B) The expression profile of miR-432 in skeletal muscle of 2-week-old and 8-week-old mice. (C) RT qPCR was performed to detect the expression of miR-432 in proliferating myoblasts. (D) RT qPCR analysis of miR-432 expression after inducing myoblast differentiation. U6 small nuclear RNA was used as an internal control. All results were representative of means ± SD of three independent experiments.
Figure 3.
Figure 3.
MiR-432 inhibited myoblast proliferation. MiR-432 mimics or negative control (NC) were transfected into cells at 50% density at 50nM and cells were harvested on 24 h after transfection. (A) The overexpression efficiency of miR-432 after transfecting miR-432 mimics compared with negative control (NC). (B) Real-time qPCR was used to detect cell cycle genes, Cyclin E, cdk2 and PCNA after 24 h transfection. (C) Western blot analysis of cell cycle genes. (D) Cell cycle analysis were performed by flow cytometer after transfection for 24 h. (E) The statistics results of cell cycle analysis. (F) EdU assay was carried out after transfection for 24 h. Cells during DNA replication were stained by EdU (red) and cell nuclei were stained with Hoechst (blue). (G) The percentage of EdU positive cells / Hoechst positive cells was quantified. (H) Cell count was measured by cell count kit 8 (CCK8), results represented absorbance value at 490 nm after incubation with 10% CCK8 solution for 4 h. Data were representative of means ± SD of three independent experiments.*, P < 0.05;**, P < 0.01.
Figure 4.
Figure 4.
MiR-432 inhibitor promoted proliferation of myoblasts. (A) RT qPCR analysis of cell cycle related genes after transfection for 24h. (B) Western blot analysis of Cyclin D1, Cyclin E, P27. (C) Quantification of Western blot analysis of Cyclin D1, Cyclin E, P27. (D) Flow cytometer was used to analyze cell cycle. (E) Statistics of cells number in different stages. (F) Edu staining of myoblasts after transfection for 24 h. Cells during DNA replication were stained by EdU (red) and cell nuclei were stained with Hoechst (blue). (G) Quantification of the percentage of EdU positive cells/total cells. (H) Cell cycle kit 8 was used to estimate total cell number and the data displayed the absorbtivity at 490nm. Data were shown by mean ± SD of three independent experiments. *, P < 0.05;**, P < 0.01.
Figure 5.
Figure 5.
MiR-432 suppressed myoblast differentiation. MiR-432 mimics or negative control (NC) were transfected into cells at 70% density at 50nM. The total RNA on day 0, 2, 4 for RT qPCR and protein on day 4 for western blotting analysis. (A) The overexpression efficiency of miR-432 after transfecting miR-432 mimics compared with negative control (NC). (B, C) Real-time qPCR was used to detect cell myogenic genes, MyoG, MyHC (MYH1) after inducing. (D) Immunofluorescence of muscle myosin heavy chain (MyHC) in C2C12 cells on fourth day of differentiation. (E) The fusion index was counted by MyHC-positive cells to total nuclei (Hoechst-positive cells). (F) Western blot analysis of myogenic genes on fourth day of differentiation. (G) The quantify results of protein level. Data were representative of means ± SD of three independent experiments. *, P < 0.05; **, P < 0.01.
Figure 6.
Figure 6.
MiR-432 directly targets E2F3 and P55PIK. (A) The construction of the luciferase (Luc) expression vector fused to the 3′ UTR and predicted target sites between miR-432 and mouse E2F3 3′ UTR or P55PIK 3′ UTR. (B and C) The expression of E2F3 mRNA (B) and P55PIK mRNA (C) during myoblast proliferation. (D and E) The expression of E2F3 mRNA (D) and P55PIK mRNA (E) during C2C12 myoblasts differentiation. (F and G) The mRNA expression of E2F3 (F), P55PIK (G) when treated with different concentration of mimics. a, b, c, d: significant difference among group treated with NC, 25 nM, 50 nM and 100 nM mimics. (P < 0.05). (H and I) The results of Dual luciferase reporter assay of E2F3 (H), P55PIK (I). Predicted target sites between miR-432 and E2F3 3′UTR or P55PIK 3′UTR. psi-CHECK™−2 Vectors, containing the E2F3 3′UTR or the mutated E2F3 3′UTR were transfected into HEK293 cells either with NC or miR-432 mimics. Renilla luciferase activity was normalized to firefly luciferase. Each treatment was carried out in triplicate and repeated 3 times. Data were representative of means ± SD of three independent experiments. *, P < 0.05;**, P < 0.01.
Figure 7.
Figure 7.
MiR-432 blocked myogenesis through PI3K/AKT signaling pathway. (A) Western blot analysis of protein change of E2F3 and P55PIK during proliferation. (B) Quantification of E2F3 and P55PIK protein expression in proliferating cells. (C) Protein changes of E2F3 and P55PIK during myoblast differentiation. (D) Quantification of E2F3 and P55PIK protein expression in differentiating cells. (E) Western blot analysis of signal molecules of PI3K/Akt/mTOR pathway during proliferation. (F) Ratios of p-Akt/t-Akt and p-mTOR/t-mTOR in proliferating cells. (G) Protein level of signal molecules in PI3K/Akt/mTOR pathway. After transfection with NC or miR-432 mimics, myoblasts were induced by myogenic differentiation medium for 3 days followed by incubating with control, 10nM insulin or 100nM insulin respectively for 24 h. Total protein was collected for western blot analysis. (H) The ratios of p-Akt/t-Akt and p-mTOR/t-mTOR protein changes in 7G. (I) Quantification of P55PIK, MyoG, and MyHC protein changes in 7G. Data were shown by mean ± SD of three independent experiments. *, P < 0.05;**, P < 0.01.
Figure 8.
Figure 8.
A model depicting role of miR-432 in regulating myogenesis. In proliferating cells (left), suppression of E2F3 mRNA by miR-432 resulted in transcription factor E2F3 decreasing in nucleus to dampen transcription of cell cycle genes and finally caused arrest in G1-phage. In differentiating cells (right), on the one hand, suppression of E2F3 by miR-432 inhibited transcription of MyoG to restrain myogenic differentiation; on the other hand, miR-432 contributed to phosphorylation of its downstream Akt and mTOR being suffocated to block myogenesis by targeted P55PIK.

Similar articles

Cited by

References

    1. Massie B, Conway M, Yonge R, Frostick S, Ledingham J, Sleight P, Radda G, Rajagopalan B. Skeletal muscle metabolism in patients with congestive heart failure: relation to clinical severity and blood flow. Circulation 1987; 76:1009-19; PMID:3664989; https://doi.org/10.1161/01.CIR.76.5.1009 - DOI - PubMed
    1. Zurlo F, Larson K, Bogardus C, Ravussin E. Skeletal muscle metabolism is a major determinant of resting energy expenditure. J Clin Invest 1990; 86:1423-27; PMID:2243122; http://dx.doi.org/10.1172/JCI114857 - DOI - PMC - PubMed
    1. Saltin B, Gollnick PD. Skeletal Muscle Adaptability: Significance for Metabolism and Performance. Comprehensive Physiology 2011; 555-631.
    1. Buckingham M, Bajard L, Chang T, Daubas P, Hadchouel J, Meilhac S, Montarras D, Rocancourt D, Relaix F. The formation of skeletal muscle: from somite to limb. J Anat 2003; 202:59-68; PMID:12587921 - PMC - PubMed
    1. Buckingham M. Skeletal muscle formation in vertebrates. Curr Opin Genet Dev 2001; 11:440-48; PMID:11448631 - PubMed

MeSH terms