. 2017 Jul/Aug;38(4):409-425.
doi: 10.1097/AUD.0000000000000400.

Using Neural Response Telemetry to Monitor Physiological Responses to Acoustic Stimulation in Hybrid Cochlear Implant Users

Affiliations

Using Neural Response Telemetry to Monitor Physiological Responses to Acoustic Stimulation in Hybrid Cochlear Implant Users

Paul J Abbas et al. Ear Hear. 2017 Jul/Aug.

Abstract

Objective: This report describes the results of a series of experiments where we use the neural response telemetry (NRT) system of the Nucleus cochlear implant (CI) to measure the response of the peripheral auditory system to acoustic stimulation in Nucleus Hybrid CI users. The objectives of this study were to determine whether they could separate responses from hair cells and neurons and to evaluate the stability of these measures over time.

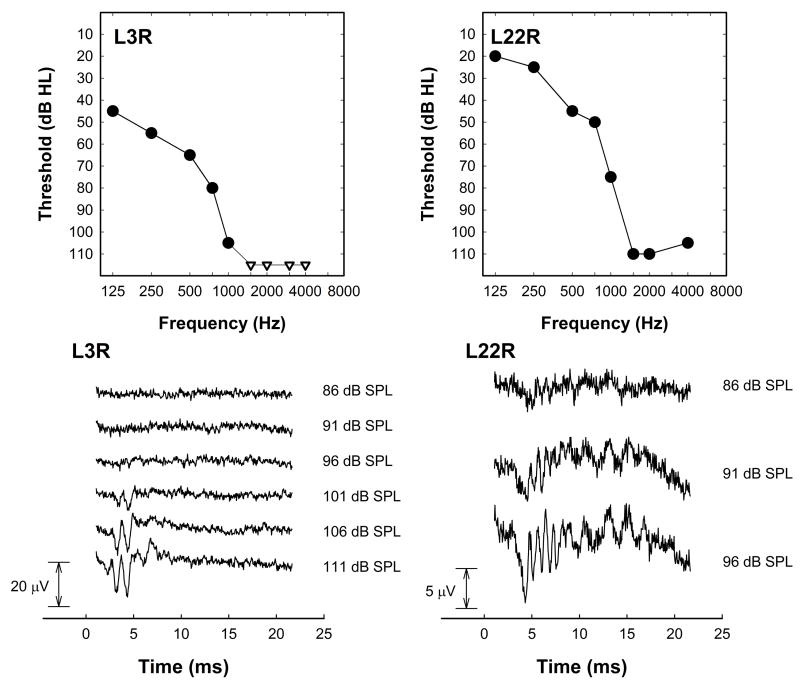
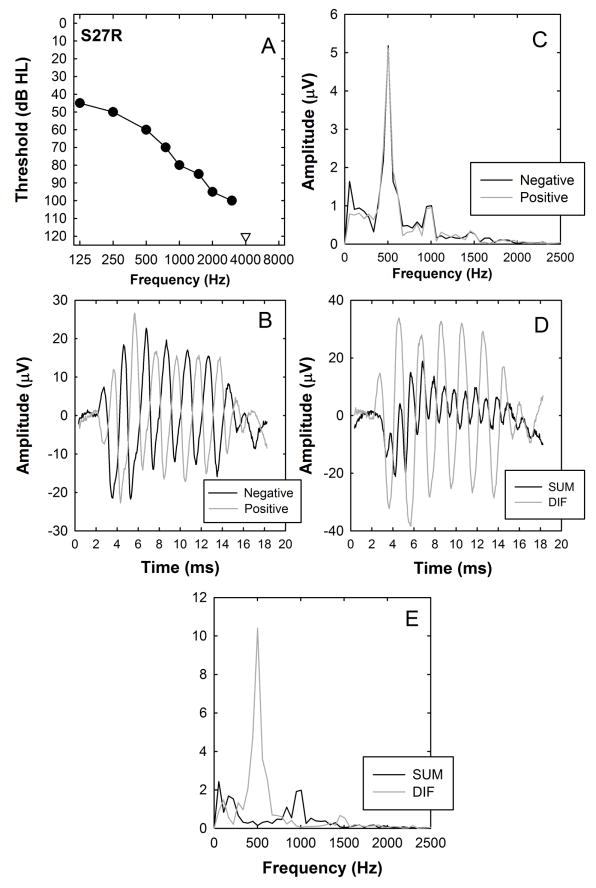
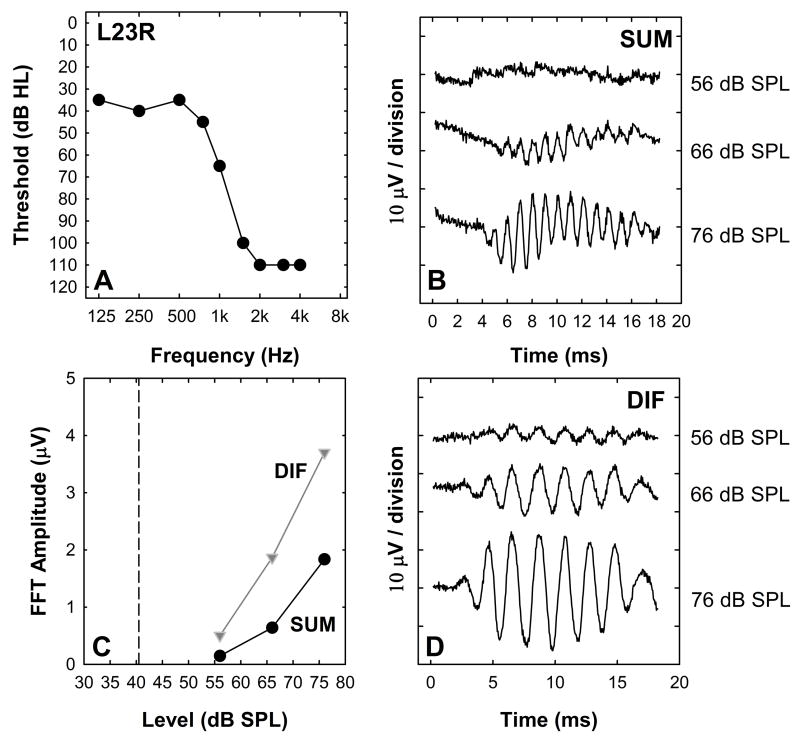
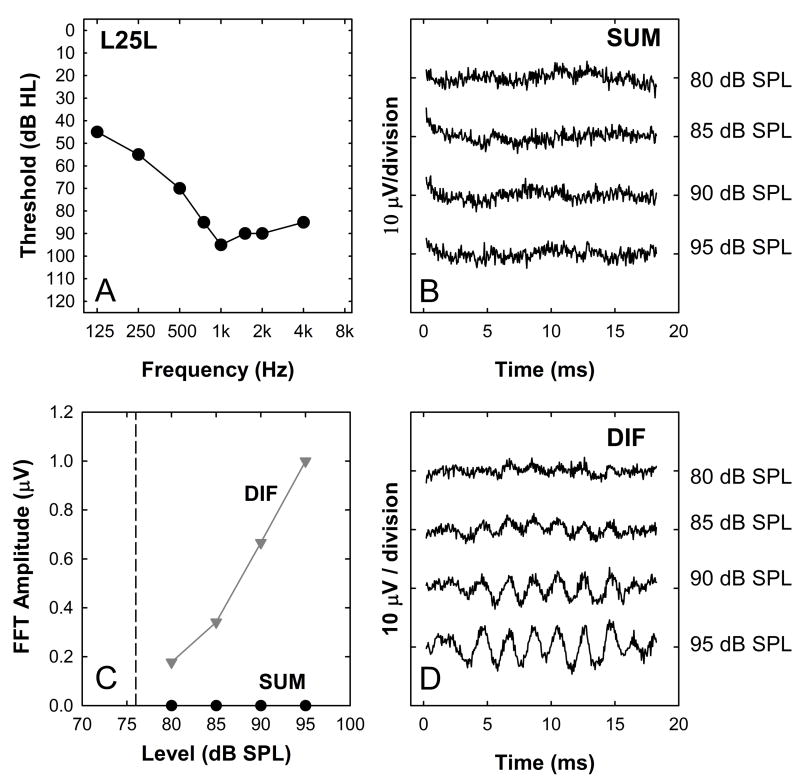
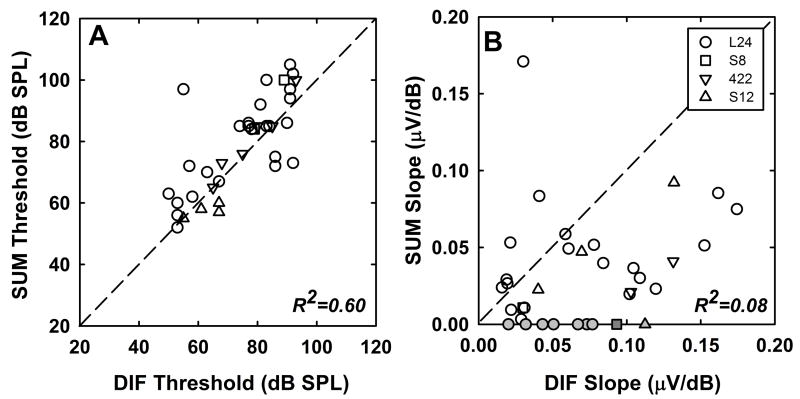
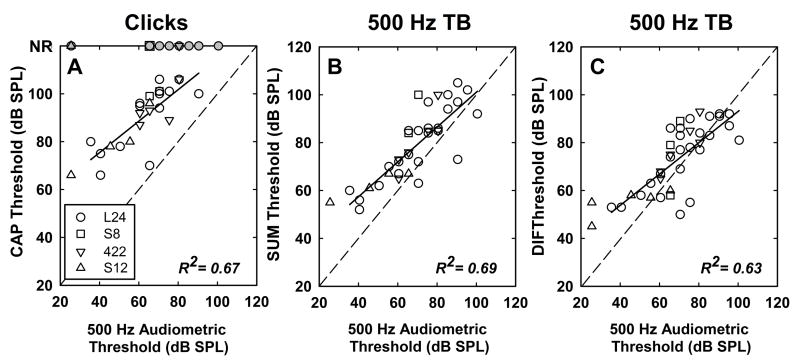
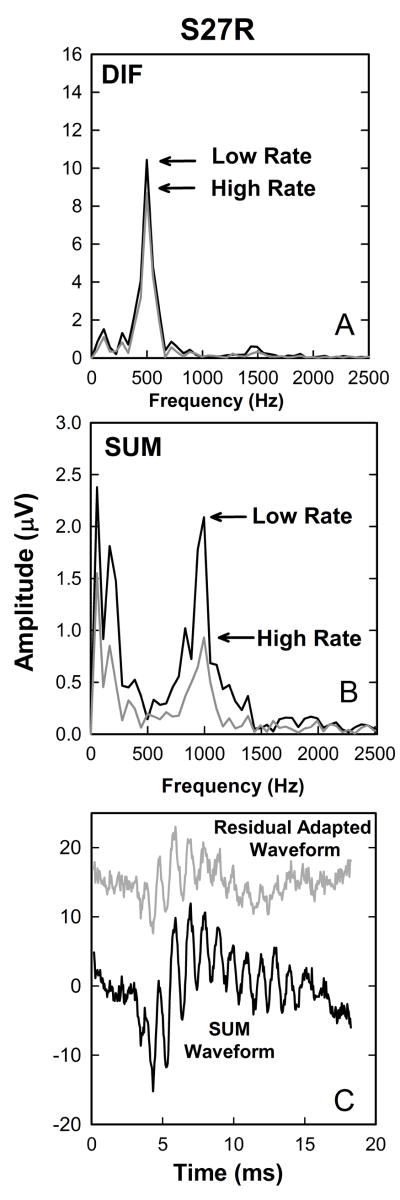
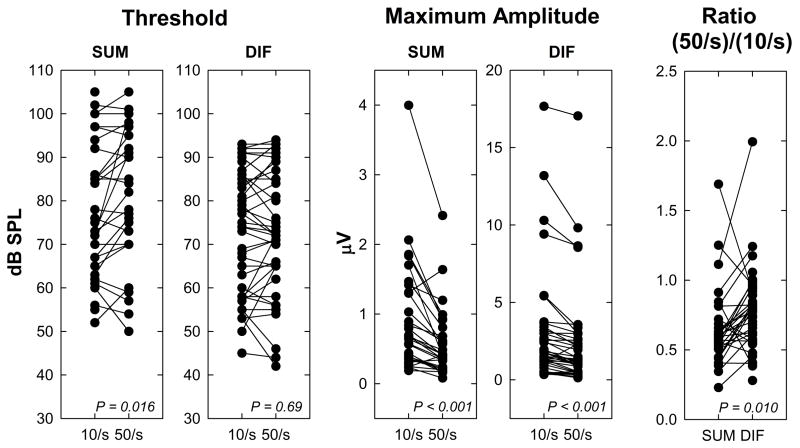
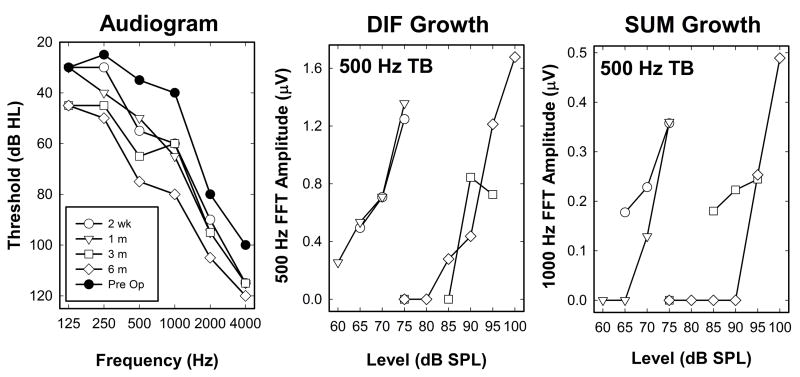
Design: Forty-four CI users participated. They all had residual acoustic hearing and used a Nucleus Hybrid S8, S12, or L24 CI or the standard lateral wall CI422 implant. The NRT system of the CI was used to trigger an acoustic stimulus (500-Hz tone burst or click), which was presented at a low stimulation rate (10, 15, or 50 per second) to the implanted ear via an insert earphone and to record the cochlear microphonic, the auditory nerve neurophonic and the compound action potential (CAP) from an apical intracochlear electrode. To record acoustically evoked responses, a longer time window than is available with the commercial NRT software is required. This limitation was circumvented by making multiple recordings for each stimulus using different time delays between the onset of stimulation and the onset of averaging. These recordings were then concatenated off-line. Matched recordings elicited using positive and negative polarity stimuli were added off-line to emphasize neural potentials (SUM) and subtracted off-line to emphasize potentials primarily generated by cochlear hair cells (DIF). These assumptions regarding the origin of the SUM and DIF components were tested by comparing the magnitude of these derived responses recorded using various stimulation rates. Magnitudes of the SUM and DIF components were compared with each other and with behavioral thresholds.

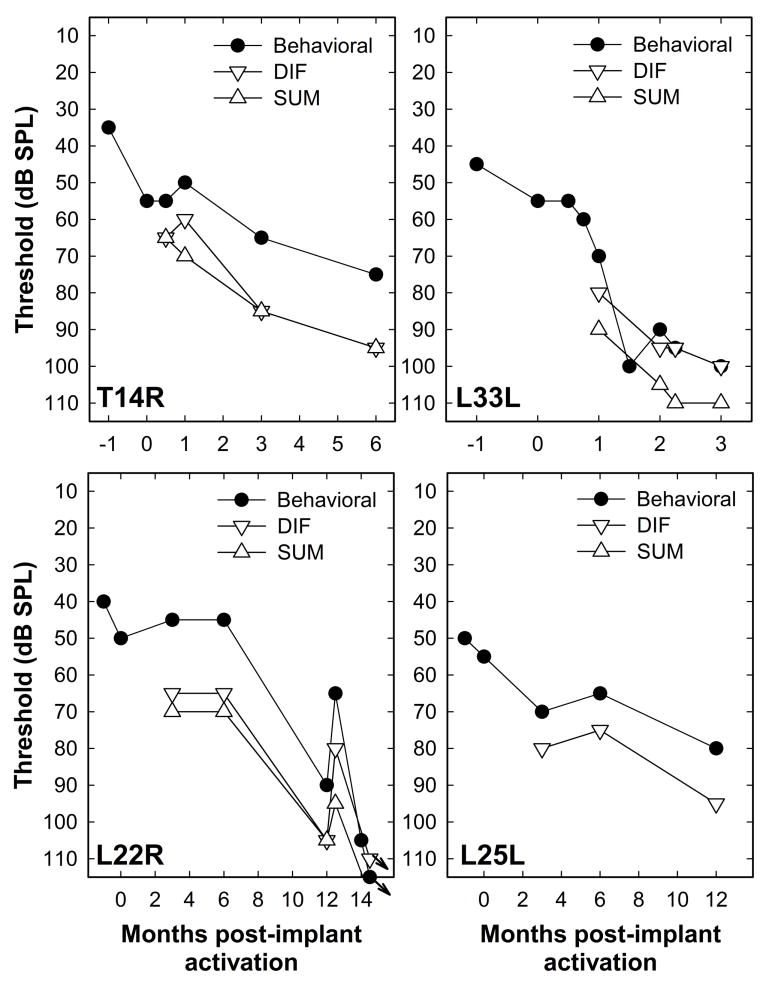
Results: SUM and DIF components were identified for most subjects, consistent with both hair cell and neural responses to acoustic stimulation. For a subset of the study participants, the DIF components grew as stimulus level was increased, but little or no SUM components were identified. Latency of the CAPs in response to click stimuli was long relative to reports in the literature of recordings obtained using extracochlear electrodes. This difference in response latency and general morphology of the CAPs recorded was likely due to differences across subjects in hearing loss configuration. The use of high stimulation rates tended to decrease SUM and CAP components more than DIF components. We suggest this effect reflects neural adaptation. In some individuals, repeated measures were made over intervals as long as 9 months. Changes over time in DIF, SUM, and CAP thresholds mirrored changes in audiometric threshold for the subjects who experienced loss of acoustic hearing in the implanted ear.

Conclusions: The Nucleus NRT software can be used to record peripheral responses to acoustic stimulation at threshold and suprathreshold levels, providing a window into the status of the auditory hair cells and the primary afferent nerve fibers. These acoustically evoked responses are sensitive to changes in hearing status and consequently could be useful in characterizing the specific pathophysiology of the hearing loss experienced by this population of CI users.


Conflict of interest statement

Conflicts of interest: None of the authors report having a conflict of interest.

Figures

Figure 1
Figure 1
Average audiometric threshold plotted as a function of frequency for all 44 study participants. Error bars indicate ± 1 standard deviation. Thresholds used in the calculation are from the implanted ear and were measured at or near the time the electrophysiological recordings were made.
Figure 2
Figure 2
Schematic diagram illustrating the method used for data collection. See text for details.
Figure 3
Figure 3
Panel A shows 7 responses. Each recording is 3.2 ms in duration but started at a different time interval relative to the onset of the acoustic stimulus. Panel B plots the same series of responses after subtraction of the “no stimulus” condition. Panel C shows the waveform that resulted from concatenation of all seven recordings. Panel D shows the same waveform after the final correction for baseline drift/tilt was applied. The time scale on the abscissa is the same for all four tracings and represents time after onset of the 500-Hz tone burst.
Figure 4
Figure 4
Responses to click stimuli presented at several different levels are shown for two subjects (L3R and L22R). Audiograms for both subjects measured on the day these recordings were obtained are also shown. Note the different amplitude scales used for these two study participants.
Figure 5
Figure 5
An example of responses recorded using a 500-Hz tone burst. Panel A shows the audiogram measured at the time of evoked potential testing. Panel B shows the response to positive leading and negative leading tone bursts plotted as a function of time after stimulus onset. Panel C shows the results of fast Fourier transform analysis of the two time waveforms shown in panel B. The amplitude scale in this and subsequent figures indicates the amplitude of each frequency component of the transform (in μV) calculated using 376 time samples recorded at a rate of 20,000 samples/s. Panel D shows the sum of the positive and negative -leading traces (labeled SUM) which tends to enhance the neural response as well as the difference between positive and negative leading responses (labeled DIF) which tends to enhance the hair cell response. Panel E shows the results of a fast Fourier transform of the time waveforms shown in Panel D.
Figure 6
Figure 6
An example of responses showing growth of both DIF and SUM components with level are shown. Panel A shows the audiogram from the test ear measured at the time of recording. Panels B and D show the SUM and DIF waveforms plotted as a function of time after stimulus onset for the three stimulation levels indicated at the right. Panel C shows the results of an FFT analysis of the SUM and DIF waveforms shown in panels B and D.
Figure 7
Figure 7
An example of responses from a subject who had a clear Diff component but no measurable SUM response. Organization of the figure is identical to Figure 6.
Figure 8
Figure 8
Scatterplots illustrate the relationship between the DIF and SUM components across the population of subjects tested. Panel A plots threshold of the SUM component as a function of DIF threshold. Panel B shows the relationship between the slope of the SUM and DIF growth functions. Thresholds were determined using linear regression of the amplitude growth data. Different symbols are used to represent the device type used by each study participant. Gray symbols represent cases where no ANN responses were observed. Linear regression analysis was used to calculate the R2 values shown. The data shown in gray were not included in that analysis. The dashed line has a slope of one.
Figure 9
Figure 9
Scatterplots illustrate the relationship between physiologic thresholds and behavioral thresholds. Panel A shows CAP thresholds measured using click stimuli plotted as a function of the subject’s 500-Hz audiometric threshold. Panels B and C show the SUM and DIF thresholds respectively plotted as a function of the 500-Hz audiometric threshold. Data for the four different implant types are plotted using different symbols. Grey symbols are used to indicate instances where no physiologic response was detected. The dashed line has a slope of one. Results of linear regression analysis are shown using a solid line and did not include data from subjects with no measurable CAP. R2 values are indicated on each graph.
Figure 10
Figure 10
Additional recordings obtained from the same subject (S27R) whose data are plotted in Figure 5. Panels A and B show the results of fast Fourier transform analysis of the DIF and SUM waveforms recorded using both a low (10/s) and high (50/s) stimulation rate. Panel C shows the SUM waveforms in black and the residual adapted SUM waveform (see text) in grey.
Figure 11
Figure 11
The effect of changing stimulation rate for individual subjects is shown. Threshold (dB SPL) and maximum amplitude (μV) of the SUM and DIF components are plotted for the two stimulation rates (10/s and 50/s). Maximum amplitude of the 500-Hz component of the FFT presented at the highest stimulation level used is shown for the DIF responses. Maximum amplitude of the 1000-Hz component of the FFT presented at the same level is shown for the SUM responses. Data from individual subjects are connected by a line to show trends. In order to compare the changes in response amplitude due to adaptation for the DIF and SUM recordings, the ratio of maximum amplitude for the fast rate relative to the slow rate is also shown in the panel on the right.
Figure 12
Figure 12
These plots show an example of a series of recordings obtained from an individual study participant (T14R) who experienced a loss of hearing several months after implantation. The panel on the left shows audiometric thresholds plotted as a function of stimulus frequency both preoperatively and at several times after implantation. Initially there some hearing loss but by the 3 and 6 month visits the extent of the hearing loss was more severe. The plots on the right show growth functions constructed using the DIF and SUM responses at each of the four postoperative appointments.
Figure 13
Figure 13
Changes in the DIF and SUM responses over time post implant are shown for four subjects who experienced a loss of acoustic hearing at 500 Hz following the initial activation of their CI. In each case, the stimulus was a 500 Hz toneburst presented via an insert earphone at a rate of 10 tone bursts per second. Also shown are changes in the subject’s 500 Hz audiometric threshold.

References

    1. Adunka O, Roush P, Grose J, et al. Monitoring of cochlear function during cochlear implantation. Laryngoscope. 2006;116:1017–1020. - PubMed
    1. Aran J-M, Charlet de Sauvage R. Clinical value of cochlear microphonic recordings. In: Ruben RJ, Elberling C, Salomon G, editors. Electrocochleography. University Park Press; 1976. pp. 55–65.
    1. Brockmeier SJ, Peterreins M, Lorens A, et al. Music perception in electric acoustic stimulation users as assessed by the Mu.S.I.C. Test. Adv Otorhinolaryngol. 2010;67:70–80. - PubMed
    1. Calloway NH, Fitzpatrick DC, Campbell AP, et al. Intracochlear electrocochleography during cochlear implantation. Otol Neurotol. 2014;35:1451–1457. - PubMed
    1. Campbell L, Kaicer A, Briggs R, et al. Cochlear response telemetry: Intracochlear electrocochleography via cochlear implant neural response telemetry pilot study results. Otol Neurotol. 2014;36:399–405. - PubMed