. 2017 Jan 12;168(1-2):111-120.e11.
doi: 10.1016/j.cell.2016.12.023. Epub 2017 Jan 12.

Structures of the Human HCN1 Hyperpolarization-Activated Channel

Affiliations

Structures of the Human HCN1 Hyperpolarization-Activated Channel

Chia-Hsueh Lee et al. Cell. .

Abstract

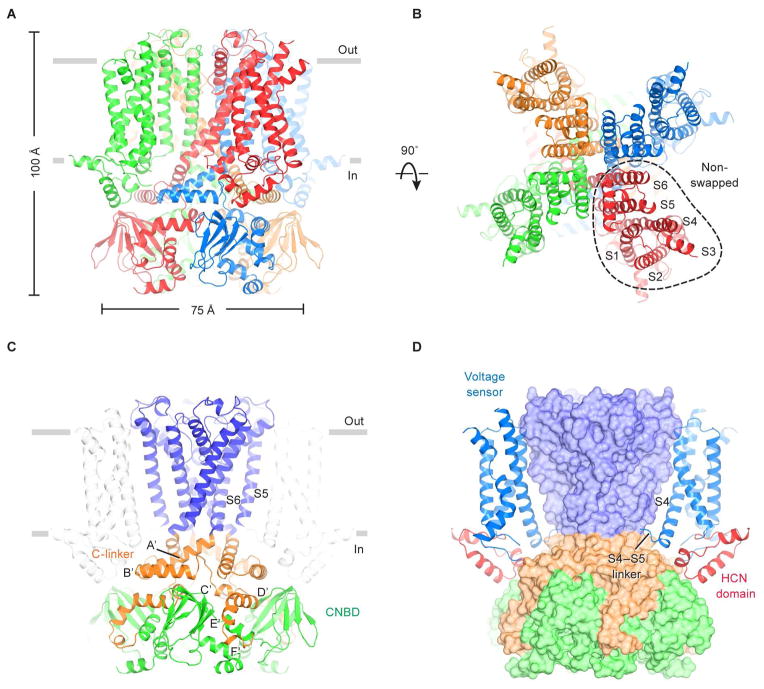
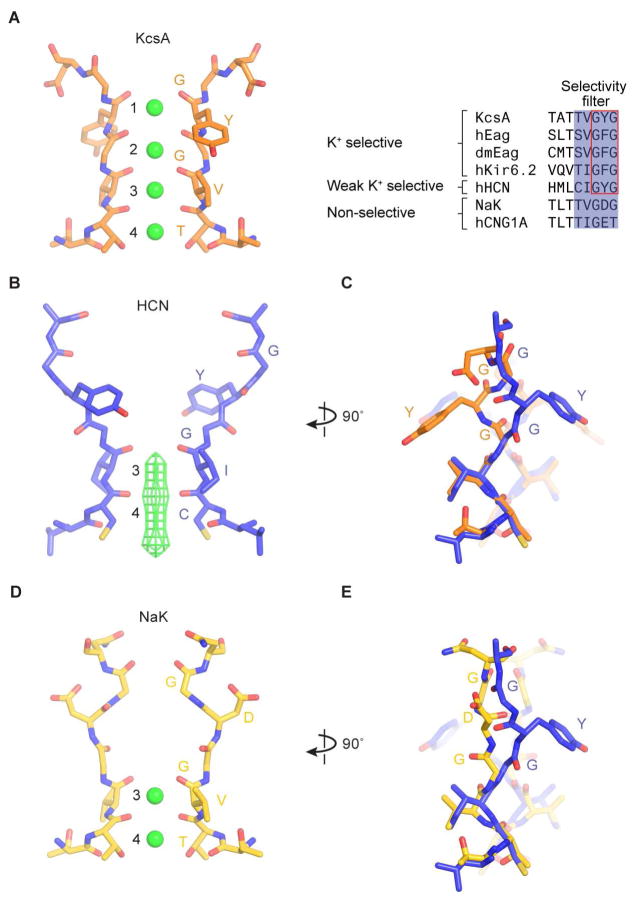
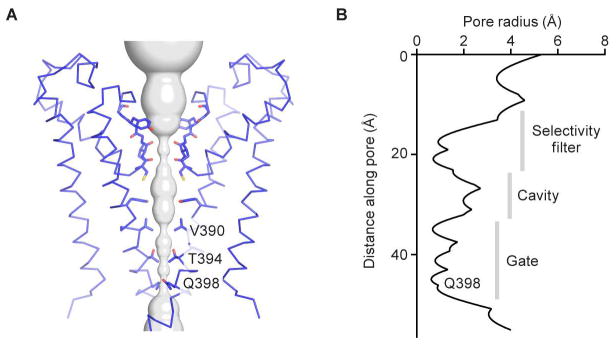
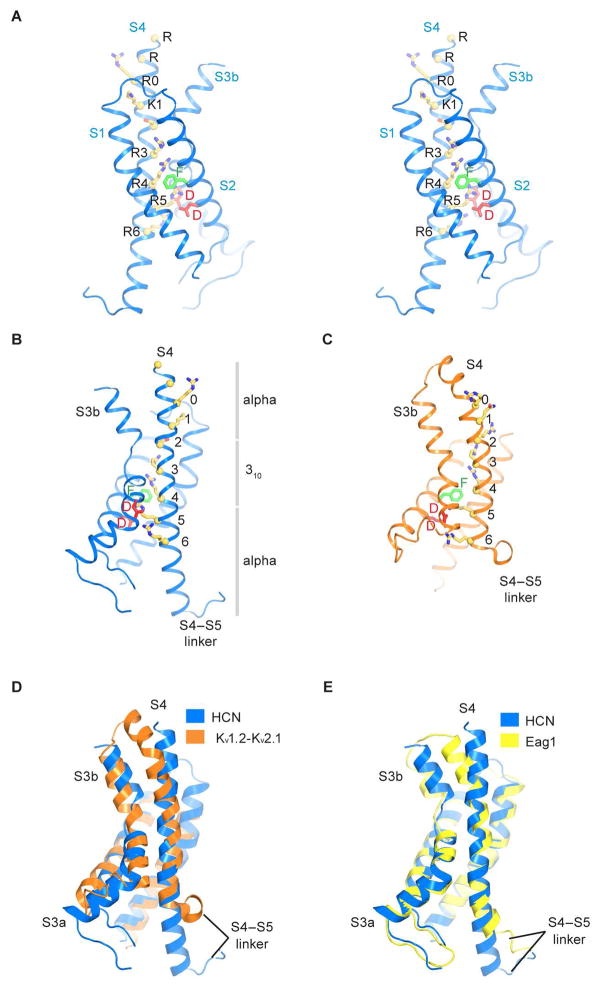
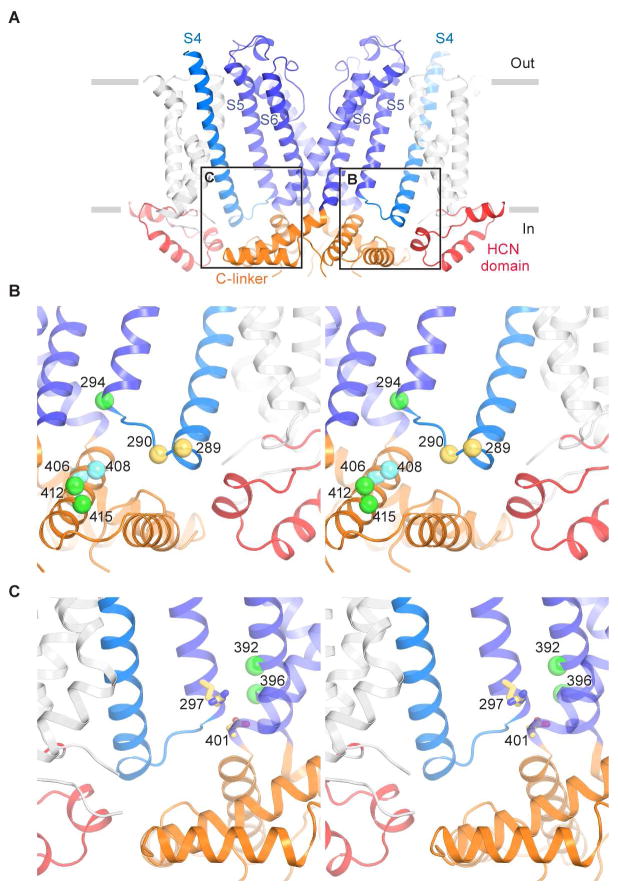
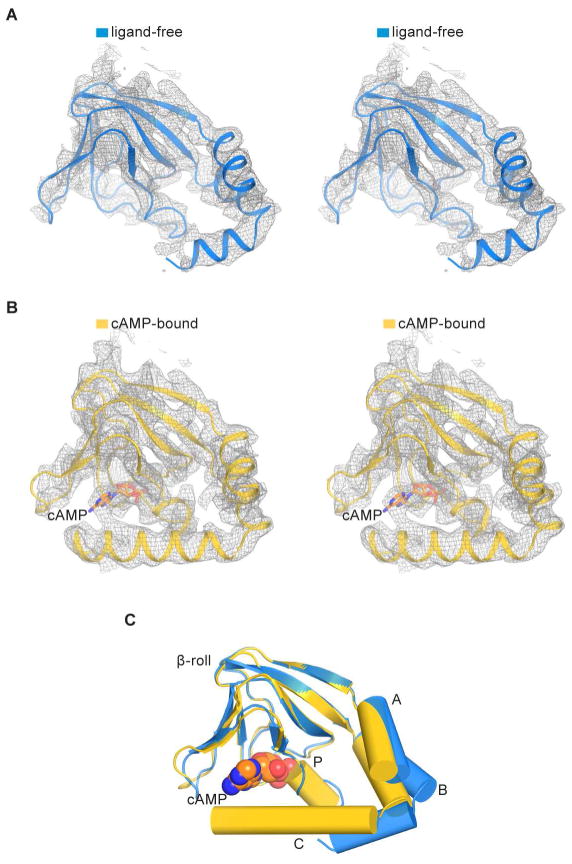
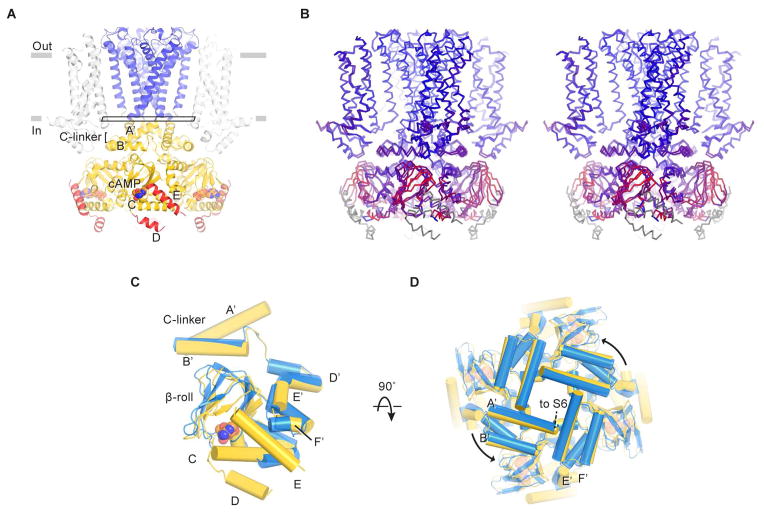
Hyperpolarization-activated cyclic nucleotide-gated (HCN) channels underlie the control of rhythmic activity in cardiac and neuronal pacemaker cells. In HCN, the polarity of voltage dependence is uniquely reversed. Intracellular cyclic adenosine monophosphate (cAMP) levels tune the voltage response, enabling sympathetic nerve stimulation to increase the heart rate. We present cryo-electron microscopy structures of the human HCN channel in the absence and presence of cAMP at 3.5 Å resolution. HCN channels contain a K+ channel selectivity filter-forming sequence from which the amino acids create a unique structure that explains Na+ and K+ permeability. The voltage sensor adopts a depolarized conformation, and the pore is closed. An S4 helix of unprecedented length extends into the cytoplasm, contacts the C-linker, and twists the inner helical gate shut. cAMP binding rotates cytoplasmic domains to favor opening of the inner helical gate. These structures advance understanding of ion selectivity, reversed polarity gating, and cAMP regulation in HCN channels.

Keywords: atomic structure; cardiac and neuronal pacemaker; cryo-electron microscopy; hyperpolarization-activated ion channel; ion selectivity; rhythmic firing; voltage-dependent gating.


Figures

Figure 1
Figure 1. Architecture of the human HCN1 channel
(A and B) Structure of the channel tetramer in the ligand-free state, viewed parallel to the membrane (A) or from the extracellular side (B). Each subunit is shown in a different color. Gray bars represent approximate boundaries of the membrane bilayer. (C and D) Domain organization of the HCN channel. In (C), the pore domain (helices S5 and S6) is colored blue, the C-linker disk (A′- and B′-helices) and four following helices (C′- to F′-helices) are colored orange, and the CNBD is colored green. In (D), the voltage sensors and the HCN domains are shown as ribbons, whereas the pore and C-terminal domains are in surface representation. The voltage sensor from the subunit nearest to the viewer is removed for clarity. See also Figures S1, S2, S3 and S5.
Figure 2
Figure 2. Selectivity filter of the HCN1 channel
(A) Structure of the KcsA filter, a K+-selective filter (PDB ID: 1K4C). Discrete K+ binding sites (1 to 4) are labeled. K+ ions within the filter are represented as green spheres. A sequence alignment of the filter regions from selected channels is shown on the right. (B) Structure of the HCN1 filter, a weak K+-selective filter. The density of K+ ions is represented as green mesh. The map is sharpened with a b-factor of −120 Å2, and contoured at 5.5 σ. (C) Comparison of the HCN1 and KcsA filters. The superposition of the HCN (blue) and KcsA filters (orange) is based on Cα atoms of residues 357 to 359 of the HCN channel. K+ ions in the KcsA channel are removed for clarity. (D) Structure of the NaK filter, a non-selective filter (PDB ID: 2AHZ). (E) Comparison of the HCN1 and NaK filters. See also Figure S6.
Figure 3
Figure 3. Pore of the HCN1 channel
(A) Ion pore with only two subunits shown, viewed from within the membrane. The minimal radial distance from the center axis to the protein surface is colored in gray. Selected residues facing the pore are in stick representation and constricting residues are labeled. (B) Radius of the pore. The van der Waals radius is plotted against the distance along the pore axis.
Figure 4
Figure 4. Voltage sensor of the HCN1 channel
(A) Stereo view of the voltage sensor. Yellow spheres denote Cα positions of Arg252, Arg255, Arg258 (R0), Lys261 (K1), Ser264, Arg267 (R3), Arg270 (R4), Arg273 (R5) and Arg276 (R6). Resides that form the gating charge transfer center are labeled (Phe186, green; Asp189 and Asp225, red). (B and C) Comparison of the HCN1 and Kv1.2–2.1 voltage sensors (PDB ID: 2R9R). The gray bars in (B) show the extents of α- versus 310-helical transitions in the S4 helix of the HCN1 channel. (D) Superposition of the HCN1 and Kv1.2–2.1 voltage sensors using Cα atoms of S1 and S2 helices. The S1–S2 loop of Kv1.2-Kv2.1 is not shown for clarity. (E) Superposition of the HCN1 and Eag1 voltage sensors (PDB ID: 5K7L), using Cα atoms of S1 to S3 helices. See also Figure S6.
Figure 5
Figure 5. Coupling between the voltage sensor and pore
(A) Interactions between the voltage sensor, pore and cytoplasmic domains. S1 to S5 helices from the subunits nearest and farthest to the viewer are removed for clarity. The boxes indicate approximate regions of the views shown in (B) and (C). (B) Stereo view of interactions between the S4–S5 linker, S5 helix and C-linker. Residues 289 and 290 that may interact with the HCN domain are shown as yellow spheres. Residues on the Clinker that “lock-open” the channel when cross-linked with residue 294 are represented as green spheres. Residues on the C-linker that “lock-close” the channel when cross-linked with residue 294 are represented as cyan spheres. (C) Stereo view of interactions between S4, S5 and S6 helices. The salt bridge forming residues, Arg297 and Asp401, are shown as yellow sticks. Residues that “lock-open” the channel after Cd2+ crosslinking are represented as green spheres. See also Figure S6.
Figure 6
Figure 6. Cyclic AMP-induced conformational changes in the CNBD
(A) Stereo view of CNBD density in the absence of cAMP. The density map (gray mesh) is sharpened with a b-factor of −90 Å2 and contoured at 6.5 σ. (B) Stereo view of CNBD density in the presence of cAMP. The density map (gray mesh) is sharpened with a b-factor of −120 Å2 and contoured at 6.5 σ. The cAMP is represented as sticks with carbon atoms in orange, oxygen in red and nitrogen in blue. (C) Superposition of CNBDs in the ligand-free (blue) and cAMP-bound states (yellow) based on Cα atoms of the β-jelly roll. A-, B-, C- and P-helices are shown in cylinders and cAMP is shown in spheres. See also Figures S4 and S7.
Figure 7
Figure 7. Cyclic AMP modulation of the HCN1 channel
(A) Structure of the channel in the cAMP-bound state. D- and E-helices are colored red. The rectangle near the gate indicates the plane of the “slice” used for the view in (D). (B) Stereo view of the superposition of ligand-free and cAMP-bound structures based on Cα atoms of the pore helices. The channel is colored on a red-to-blue spectrum according to the displacement of Cα atoms between the two structures. Blue color represents minimal displacements and red color represents displacements up to 4.5 Å. Gray color indicates residues only present in one structure and thus are not aligned. (C and D) Superposition of C-linkers and CNBDs in the ligand-free (blue) and cAMP-bound states (yellow). Only single subunits are shown in (C) for clarity. (D) is viewed from the extracellular side. See also Figures S4 and S7.

References

    1. Afonine PV, Headd JJ, Terwilliger TC, Adams PD. New tool: phenix.real_space_refine. Comput Crystallogr Newsl. 2013;4:43–44.
    1. Aggarwal SK, MacKinnon R. Contribution of the S4 segment to gating charge in the Shaker K+ channel. Neuron. 1996;16:1169–1177. - PubMed
    1. Barad BA, Echols N, Wang RYR, Cheng Y, DiMaio F, Adams PD, Fraser JS. EMRinger: side chain–directed model and map validation for 3D cryo-electron microscopy. Nat Methods. 2015;12:943–946. - PMC - PubMed
    1. Benarroch EE. HCN channels: function and clinical implications. Neurology. 2013;80:304–310. - PubMed
    1. Biasini M, Bienert S, Waterhouse A, Arnold K, Studer G, Schmidt T, Kiefer F, Cassarino TG, Bertoni M, Bordoli L, et al. SWISS-MODEL: modelling protein tertiary and quaternary structure using evolutionary information. Nucleic Acids Res. 2014;42:W252–W258. - PMC - PubMed

MeSH terms

Substances