. 2017 Jan 12;168(1-2):264-279.e15.
doi: 10.1016/j.cell.2016.12.032. Epub 2017 Jan 12.

Dynamic Remodeling of Membrane Composition Drives Cell Cycle through Primary Cilia Excision

Affiliations

Dynamic Remodeling of Membrane Composition Drives Cell Cycle through Primary Cilia Excision

Siew Cheng Phua et al. Cell. .

Erratum in

Abstract

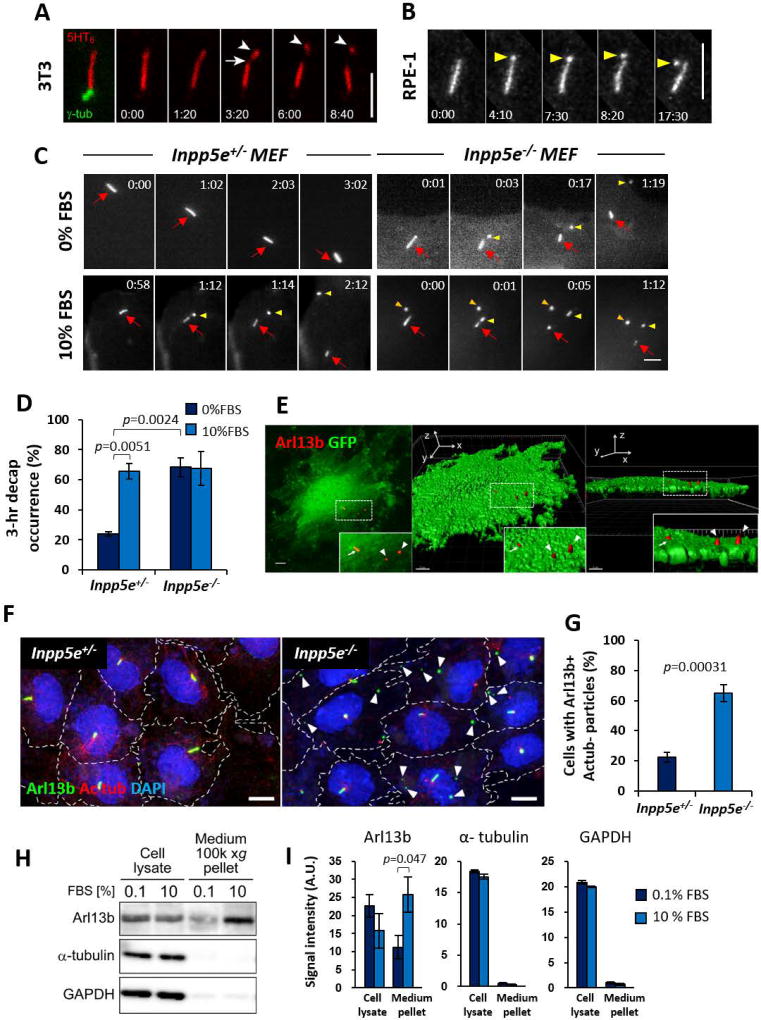
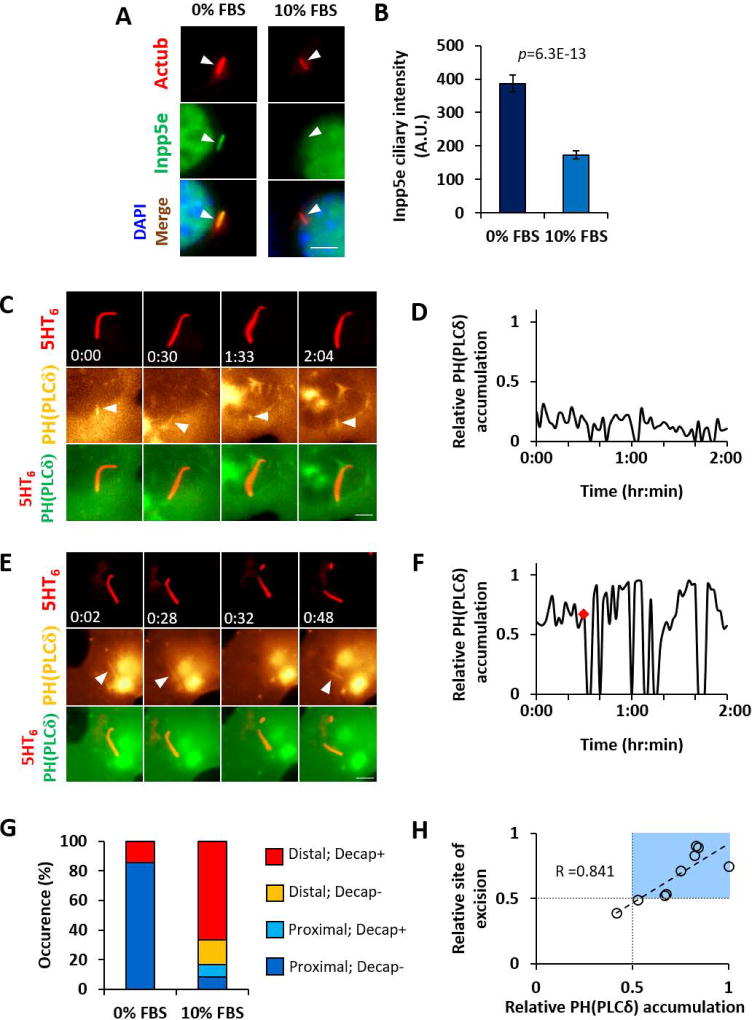
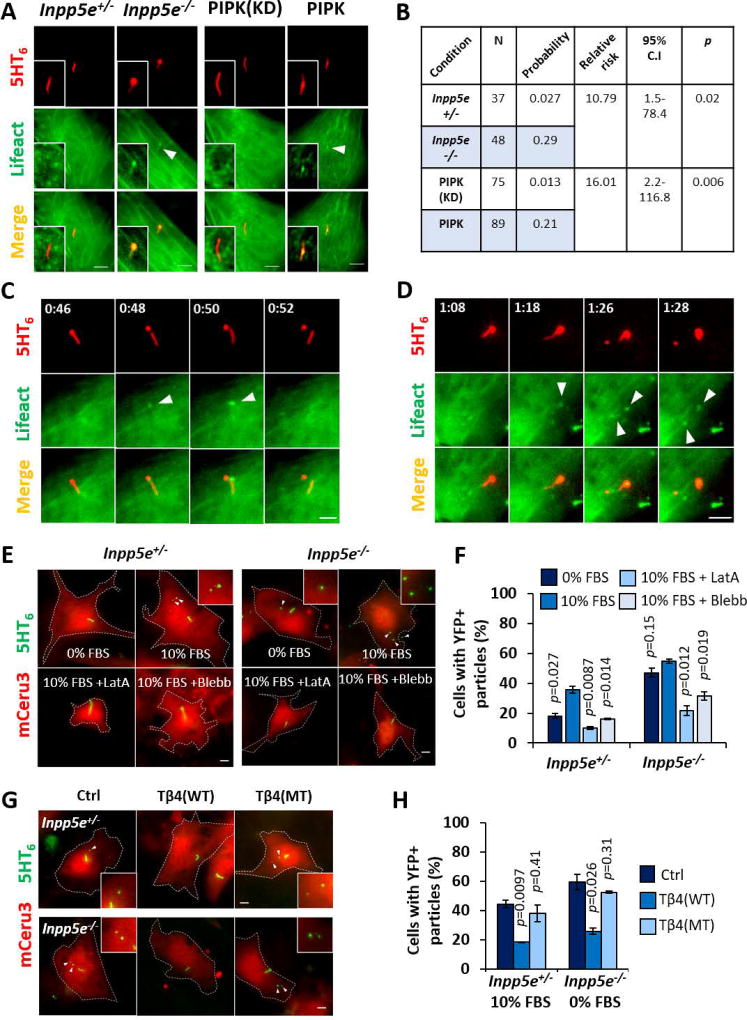
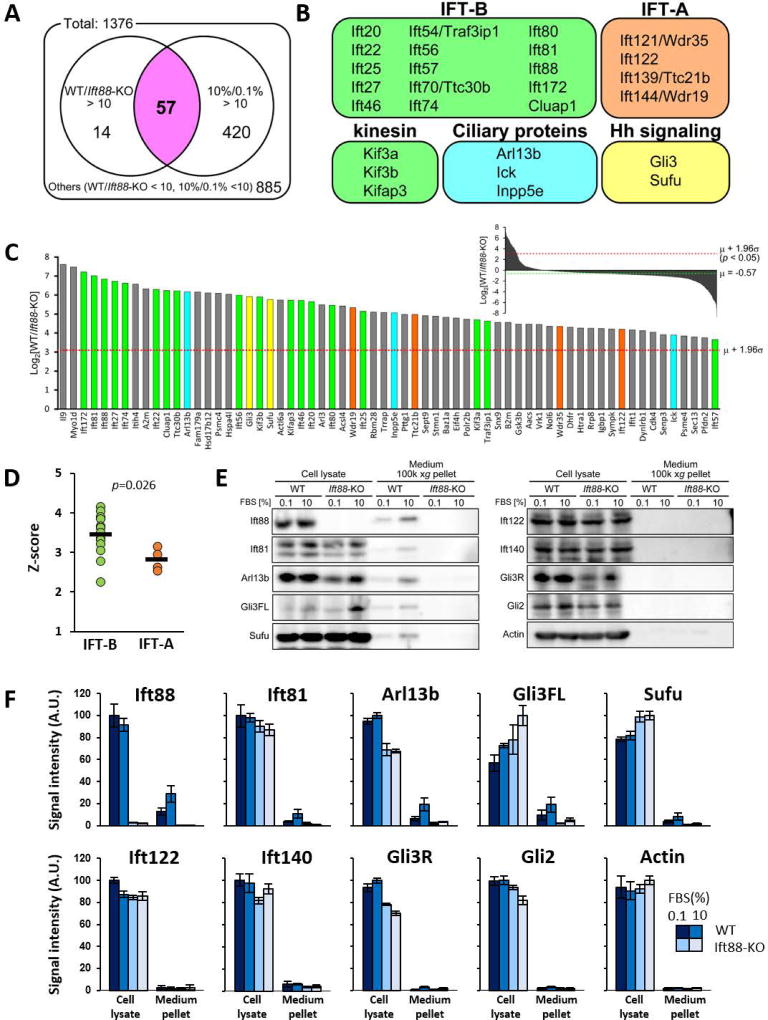
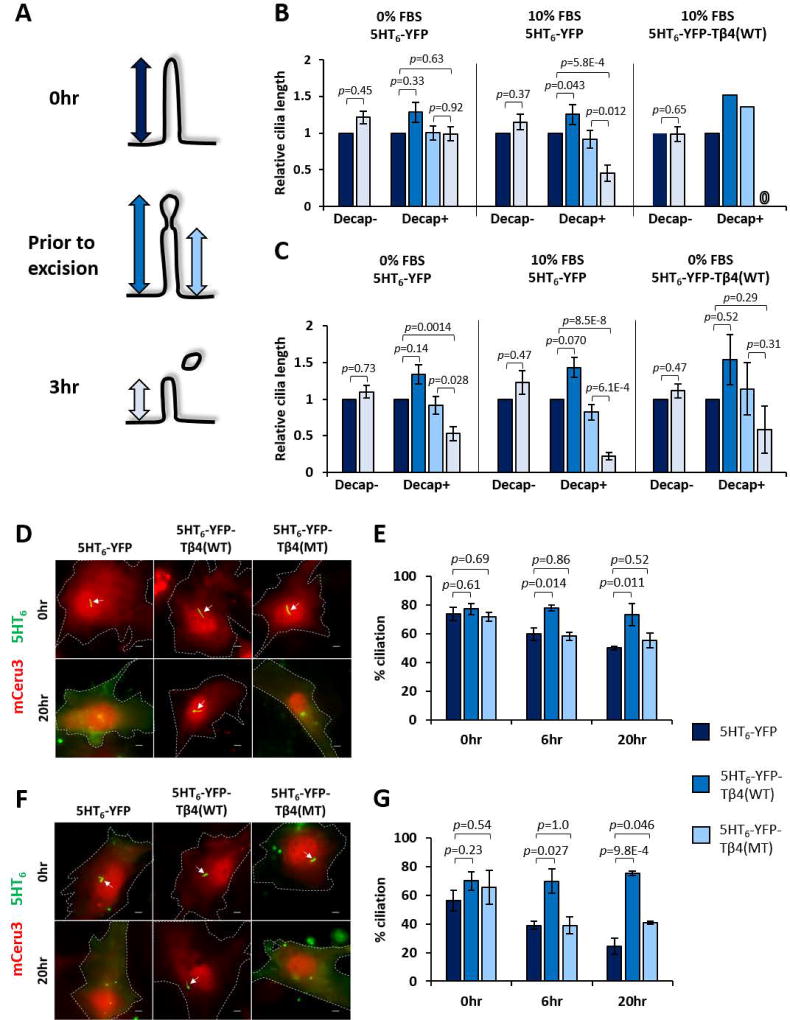
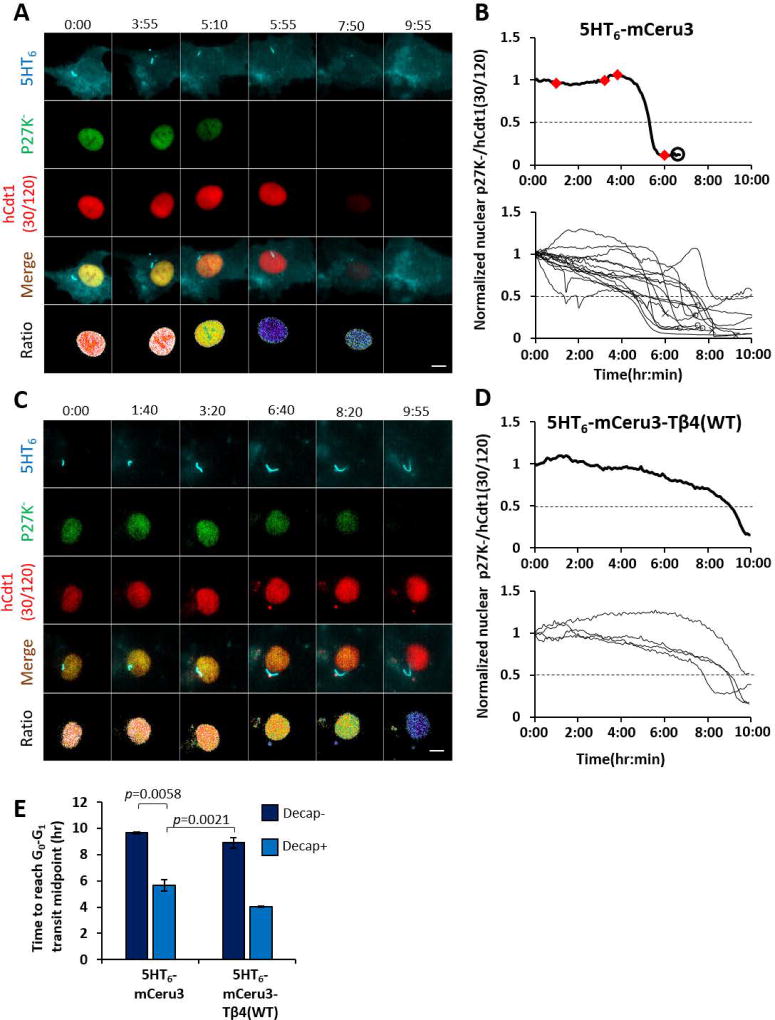
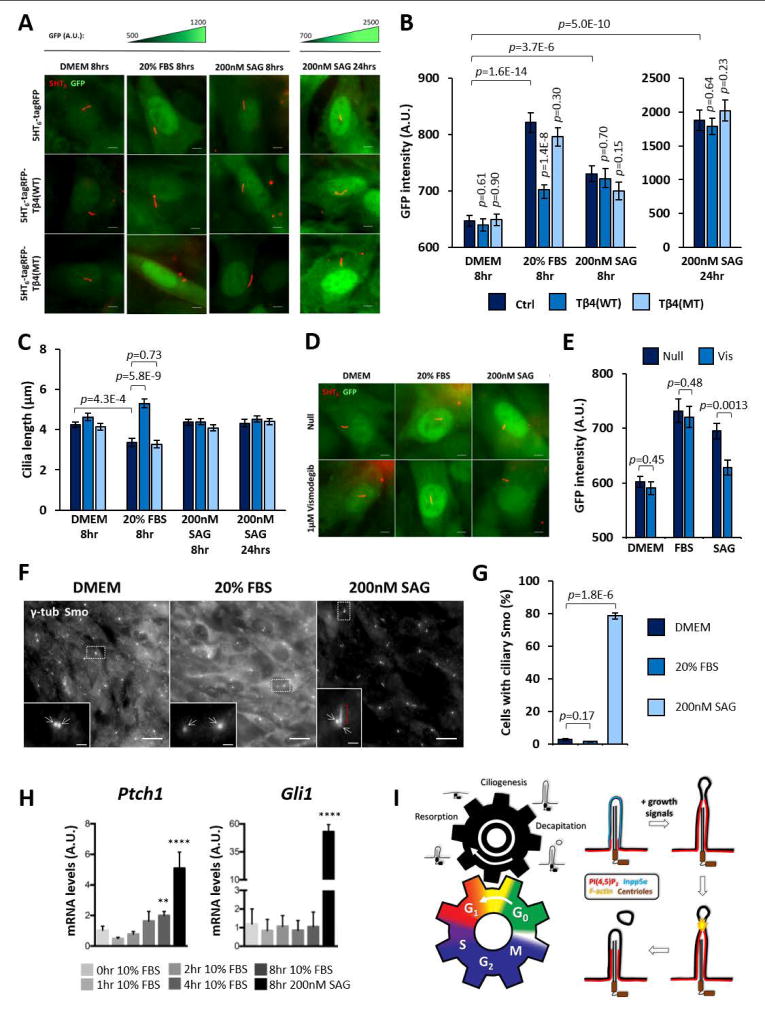
The life cycle of a primary cilium begins in quiescence and ends prior to mitosis. In quiescent cells, the primary cilium insulates itself from contiguous dynamic membrane processes on the cell surface to function as a stable signaling apparatus. Here, we demonstrate that basal restriction of ciliary structure dynamics is established by the cilia-enriched phosphoinositide 5-phosphatase, Inpp5e. Growth induction displaces ciliary Inpp5e and accumulates phosphatidylinositol 4,5-bisphosphate in distal cilia. This change triggers otherwise-forbidden actin polymerization in primary cilia, which excises cilia tips in a process we call cilia decapitation. While cilia disassembly is traditionally thought to occur solely through resorption, we show that an acute loss of IFT-B through cilia decapitation precedes resorption. Finally, we propose that cilia decapitation induces mitogenic signaling and constitutes a molecular link between the cilia life cycle and cell-division cycle. This newly defined ciliary mechanism may find significance in cell proliferation control during normal development and cancer.

Keywords: AurA; F-actin; Gli; Inpp5e; PI(4,5)P(2); Primary cilia; cell-cycle entry; decapitation; disassembly; ectosome; extracellular vesicles; genetically encoded ciliary actin inhibitor.


Figures

Figure 1
Figure 1. Growth stimulation induces cilia decapitation regulated by Inpp5e
(A) Time-lapse images of a NIH/3T3 primary cilium expressing 5HT6-mCherry and γ-tub-GFP at quiescent state. Arrow: ciliary membrane thinning prior to excision. Arrowheads: excised cilium tip. (B) Time-lapse images of an hTERT RPE-1 primary cilium expressing Arl13b-GFP at quiescent state. Note ciliary tip bulging prior to excision (yellow arrowheads). (C) Time-lapse images of Inpp5e+/− and Inpp5e−/− MEF primary cilia expressing 5HT6-YFP at quiescent or growth-stimulated states. Red arrows: cilia. Yellow arrows: excised cilia tips. Orange arrow: YFP+ particles present from beginning. (D) Scoring % of cells displaying cilia decapitation over 3 hours, as in (C). (n= 51, 49, 28, 34 cells from left to right; 3–5 experiments) (E) Maximum intensity projection of Arl13b immunofluorescence and GFP in Inpp5e−/− MEF. Middle and right panels are 3D reconstructions of confocal image on left panel. Insets are magnifications of dotted regions. Arrows: cilia. Arrowheads: Arl13b+ particles residing on cell surface. (F) Arl13b/Ac tub immunofluorescence and nuclear staining (DAPI) of quiescent Inpp5e+/− and Inpp5e+/− MEF. Arrowheads: Arl13b+Ac tub- particles. (G) Scoring % of cells with associated Arl13b+Actub- particles, as in (F). (n= 344, 376 cells from left to right; 3 experiments) (H) Representative Western blots in cell lysates and conditioned culture media pellets from mIMCD-3 cells treated with 0.1% or 10% FBS for 24 hours. (I) Quantification of band signal intensities in (H). (n = 4 experiments for Arl13b, n = 3 experiments for α-tubulin and GAPDH) Data are shown as mean ± SEM; Student’s T-tests were performed with p values indicated. Time in min:sec for (A) and (B), and hr:min for (C). Scale bars: 5µm in (A), (B), (C) and (E), and 10µm in (F). See also Figure S1 and Movies S1 and S2.
Figure 2
Figure 2. Growth stimulation regulates ciliary Inpp5e and PI(4,5)P2 localization
(A) Ac tub/Inpp5e immunofluorescence and nuclear staining (DAPI) of Inpp5e+/− MEF treated with 0% FBS or 10% FBS for 4 hours. Images of each wavelength are scaled to same intensity range. Arrowheads mark cilia positions. (B) Inpp5e immunofluorescence signal intensity measurements in primary cilia, as in (A). Data shown as mean ± SEM. Student’s T-test was performed with p values indicated. (n= 131, 148 cells from left to right; 2 experiments) (C) Time-lapse images of Inpp5e+/− MEF primary cilium expressing 5HT6-mCeru3 and YFP-PH(PLCδ) (a PI(4,5)P2 sensor) at quiescent state. Arrows marks PH(PLCδ) at proximal cilia. (D) Time-lapse measurements of PH(PLCδ) proximal-distal accumulation in cilium in (C), given as relative ratio of cilium length. (E) Time-lapse images of Inpp5e+/− MEF primary cilium expressing 5HT6-mCeru3 and YFP-PH(PLCδ) at 4–6 hours of 10% FBS stimulation. Arrows marks ciliary PH(PLCδ). (F) Time-lapse measurements of PH(PLCδ) accumulation in cilium in (E), given as relative ratio of cilium length. Red diamond marks cilia decapitation time point. (G) Classifying ciliary PH(PLCδ) accumulation with cilia decapitation. “Distal” or “proximal” indicates PH(PLCδ) accumulating to distal or proximal half of ciliary length. “Decap+” or “Decap-” indicates presence or absence of cilia decapitation over 2-hour imaging periods. (n= 7,12 cells from left to right; 2–3 experiments) (H) Correlation plot of ciliary PH(PLCδ) accumulation with site of excision, each given as a relative ratio of ciliary length. In each case, the maximal ciliary PH(PLCδ) accumulation value within ten minutes prior to excision is shown. Light blue box highlights distal location of ciliary PH(PLCδ) accumulation and site of cilia excision. Linear regression is drawn in dashed line, with Pearson correlation coefficient R value indicated. (n=9 cells from 10% FBS data in (G)) Time in hr:min for (C) and (E). Scale bars: 5µm. See also Figure S2 and Movie S3.
Figure 3
Figure 3. Ciliary PI(4,5)P2 induces intraciliary F-actin assembly which executes cilia decapitation
(A) Live fluorescence images of (two leftmost columns) Inpp5e+/− and Inpp5e−/− MEF primary cilia expressing 5HT6-YFP and mCeru3-Lifeact, and (two rightmost columns) NIH/3T3 primary cilia expressing 5HT6-YFP-PIPK or 5HT6-YFP-PIPK(KD) and mCeru3-Lifeact. Insets are magnifications of respective cilia. Arrowheads mark ciliary Lifeact signals. (B) Relative risk ratio analyses on the effect of ciliary PI(4,5)P2 in influencing intraciliary F-actin incidence, as in (A). (C) Time-lapse images of a primary cilium from Inpp5e+/− MEF expressing 5HT6-YFP and mCeru3-Lifeact at 4–6 hours of 10% FBS stimulation. Arrowheads mark F-actin at site of cilia excision. (D) Time-lapse images of primary cilium from Inpp5e−/− MEF expressing 5HT6-YFP and mCeru3-Lifeact at 0–2 hours of 10% FBS stimulation. Arrowheads mark F-actin at site of cilia excision. Note that F-actin first appeared in bulged cilia tip before expanding to proximal cilia region. F-actin was also detected in excised cilia tip. (E) Live fluorescence images of Inpp5e+/− and Inpp5e−/− MEF expressing 5HT6-YFP with mCeru3 after 3 hours in 0% FBS, 10% FBS, 10% FBS + 200nM latrunculin A (LatA), or 10% FBS + 50µM blebbistatin (Blebb). Arrowheads indicate cell-associated YFP+ particles that were likely vesicles released from primary cilia, and insets are respective magnified images. (F) Quantification of % cells with associated extracellular YFP+ particles, as in (E). (n=99, 82, 70, 62, 75, 69, 73, 67 cells from left to right; 2 experiments) (G) Live fluorescence images of Inpp5e+/− MEF and Inpp5e−/− MEF expressing 5HT6-YFP (control), 5HT6-YFP-Tβ4(WT) or 5HT6-YFP-Tβ4(MT) with mCeru3 respectively after 3 hours of 10% FBS stimulation or at quiescence (0% FBS). Arrowheads indicate cell-associated YFP+ particles, and insets are respective magnified images. (H) Quantification of % cells with associated extracellular YFP+ particles, as in (G). (n=83, 88, 96, 69, 95, 76 cells from left to right; 2 experiments) Data shown as mean ± SEM. Student’s T-tests were performed with respect to (E) each 10% FBS condition and (F) each control condition, p values indicated. Time in hr:min for (A) and (B). Scale bars: 5µm. See also Figures S3 and S4 and Movie S4.
Figure 4
Figure 4. Global proteomic profiling of conditioned culture media reveals growth-stimulated extracellular release of IFT-B dependent on primary cilia
(A) Venn diagram classification of proteins detected in conditioned culture media under indicated conditions, with a threshold of false discovery rate=0.01. “10%/0.1% >10”: 477 proteins with mass spectrometry signal areas ≥10 fold higher in 10% FBS condition than in 0.1% FBS condition, in WT mIMCD-3 (growth stimulation-dependent). “WT/Ift88KO >10”: 71 proteins with mass spectrometry signal areas ≥10 fold higher in WT mIMCD-3 than Ift88-KO mIMCD-3, in 10% FBS condition (cilia-dependent). There is a 57-protein (purple) overlap, i.e. both cilia- and growth stimulation- dependent. (B) Classification of ciliary proteins amongst the 57 proteins highlighted in (A). (C) Comparative analyses of proteins extracellularly released in cilia-dependent manner (WT/Ift88KO). Mass spectrometry signal area ratios for respective proteins are represented as logarithm to the base 2 (log2), and ranked in descending order of Z-scores. Only top 1.2% of proteins with Z-scores higher than 2.25 are shown. The mean (µ) log2 ratios of area values is -0.57, and standard deviation (σ) is 1.87. Color coding as in (B). (D) Z-score comparison between IFT-B and IFT-A components identified from proteomic analysis, as in (C). Ift88 is excluded from IFT-B group, since a high WT/Ift88KO ratio would occur with Ift88-KO. Bars indicate mean of Z-scores. A Mann-Whitney U-test was performed with p values indicated. (E) Representative Western blot analyses in total cell lysates and conditioned culture media pellets. (F) Quantification of respective band signal intensities in (E). Data shown as mean ± SEM. (n=3 experiments) See also Figure S5 and Tables S1 and S2.
Figure 5
Figure 5. Inhibition of cilia decapitation suppresses growth-stimulated cilia disassembly
(A) Schematic illustrating the time points when respective cilia lengths, indicated by double-headed arrows, were measured over a 3-hour live imaging period. Color coding for arrows applies to (B) and (C). (B) Quantification of Inpp5e+/− MEF cilia lengths over 3-hour imaging period. Cilia are classified according to occurrence of cilia decapitation, and cilia lengths are given as a ratio to cilia length at T=0. Only a single cell was available for analysis under the category of “Decap+; 10% FBS Tβ4(WT)” due to high efficacy of 5HT6-YFP-Tβ4(WT) in inhibiting cilia decapitation. “0” indicates complete disassembly. Data in left and middle panels were derived from data in Figure 1D. (n=26,11,19,22,9,1 cells; 1–5 experiments) (C) Quantification of Inpp5e−/− MEF cilia lengths over 3-hour imaging period, with similar data representation as in (B). Data in left and middle panels were derived from data in Figure 1D. (n=8,16,8,20,11,3 cells; 2–5 experiments) (D) Live fluorescence images of Inpp5e+/− MEF under indicated conditions at 0 and 20 hours of 10% FBS stimulation. Arrows mark cilia. (E) Quantification of % cells possessing primary cilia, as in (D). (n=167, 182, 162, 157, 153, 164, 176, 131, 139 cells from left to right; 3 experiments) (F) Live fluorescence images of Inpp5e−/− MEF under indicated conditions at 0 and 20 hours of 10% FBS stimulation. Arrows mark cilia. (G) Quantification of % cells possessing primary cilia, as in (F). (n=165, 155, 112, 156, 107, 123, 14, 136, 144 cells from left to right; 3 experiments) Data shown as mean ± SEM; Student’s T-tests were performed with p values indicated. In (B–C), Student’s T-tests were performed on absolute cilia lengths. Scale bars: 5µm.
Figure 6
Figure 6. Cilia decapitation occurs in G0 and regulates G1 phase entry
(A) Representative time-lapse images of prompt G1 entry that occurs with cilia decapitation in Inpp5e+/− MEF expressing 5HT6-mCeru3. Venus-p27K was abruptly degraded at approximately 5 hours post-FBS stimulation, and rapid mCherry-hCdt1(30/120) depletion ensued by approximately 8 hours post-growth stimulation, indicating transit into G1 and S phase respectively. Images of each panel are scaled to same intensity range. (B) Quantification of basal-normalized nuclear Venus-p27K-/mCherry-hCdt1 ratio (pseudo-colored in (A)) over 10 hours. Upper panel: plot for cell in (A). Red diamonds indicate cilia decapitation time points. Open circle marks beginning of mCherry-hCdt1(30/120) degradation. Lower panel: plot for all 15 cells that were determined for quiescence exit within the 10-hour period (i.e. these cells demonstrated a sharp decrease in Venus-p27K at some point). Cilia decapitation events not denoted here; refer to Figure S6A for individual plots. Open circle marks beginning of mCherry-hCdt1(30/120) degradation. Crosses mark end of imaging period. (C) Representative time-lapse images of prolonged G1 entry that occurs with suppressed cilia decapitation in Inpp5e+/− MEF expressing 5HT6-mceru3-Tβ4(WT). Note gradual Venus-p27K degradation which indicates delayed G1 entry. Images of each panel are scaled to same intensity range. (D) Quantification of basal-normalized nuclear Venus-p27K/mCherry-hCdt1 ratio (pseudo-colored in (C)) over 10 hours. Upper panel: plot for cell in (C). No cilia decapitation was observed over the 10-hour imaging period. Lower panel: plot for all 4 cells that were determined to exit quiescence; refer to Figure S6D for individual plots. (E) Quantification of time duration to reach G0-G1 transit mid-point, derived from time points when basal-normalized p27K/hCdt1=0.5. Only cells that reached ratio value ≤0.5 by 10 hours were considered here. Data shown as mean ± SEM. Student’s T-tests were performed with p values indicated. (n=2, 15, 4, 2 cells; 3–7 experiments) Time in hr:min. Scale bars: 10µm. See also Figure S6 and Movie S5.
Figure 7
Figure 7. Growth-induced Gli activation is dependent on cilia decapitation
(A) Representative fluorescence images of NIH/3T3: 8xGBS-GFP reporter line under indicated conditions. GFP fluorescence intensities of the same column group are scaled to the same intensity ranges indicated above each group. (B) GFP fluorescence intensity measurements, as in (A). (n= 70, 89, 72, 64, 73, 70, 61, 77, 61, 39, 56 and 59 cells from left to right; 4 experiments) (C) Cilia length measurements in response to indicated stimuli and cilia-targeted probes; data derived from same experiments in (B). (D) Representative fluorescence images of NIH/3T3: 8xGBS-GFP reporter line at 8 hours under indicated conditions. GFP fluorescence intensities are scaled to the same intensity range. (E) GFP fluorescence intensity measurements, as in (D). (n= 39, 54, 48, 49, 43 and 44 cells from left to right; 3 experiments) (F) γ-tub and Smoothened (Smo) immunofluorescence on NIH/3T3: 8xGBS-GFP reporter line upon 8 hours with indicated conditions. Insets are magnifications of dotted regions. Arrows indicate centrioles. Red bracket indicates ciliary Smo signals. (G) Scoring % cells with ciliary Smo signals, as in (F). (n=249, 206, 239 cells from left to right; 3 experiments) (H) Quantitative real-time PCR assay for Ptch1 and Gli1 gene expression performed on NIH/3T3 post-stimulation with 10% FBS. An 8-hour 200nM SAG positive control for Smo-dependent Hedgehog signaling activation was included. Ubc was used to normalize Ptch1 and Gli1 transcript levels. One-way ANOVA was performed to compare 0-hour 10% FBS samples with all other samples. ** p< 0.01; **** p< 0.0001 (n= 8 experiments) (I) Summary model of cilia decapitation during quiescence exit. (Left panel) Two meshing gears represent the mutual dependency between cell division cycle and primary cilium life cycle. As known, growth induction (counterclockwise rotation of the bottom gear) promotes cilia disassembly (clockwise rotation of the top gear). The present study characterizes cilia decapitation as one of the key gear teeth enmeshing the two biological cycles. Cilia decapitation stimulates disassembly of cilia, and also modulates cell proliferation by inducing G1 entry. (Right panel) Growth-stimulated cilia decapitation occurs through four major steps: (1) Inpp5e re-localization (2) PI(4,5)P2 elevation (3) Actin polymerization (4) Cilia tip excision. In (B), (C), (E), (G), data are shown as mean ± SEM; Student’s T-tests were performed between indicated sample pairs (horizontal p values), or with respect to each 5HT6-tagRFP condition (vertical p values). Scale bars indicate 5µm in (A) and (D), 20µm and 2µm in (F) and (F) insets respectively.

References

    1. Basten SG, Giles RH. Functional aspects of primary cilia in signaling, cell cycle and tumorigenesis. Cilia. 2013;2:6. - PMC - PubMed
    1. Bergman K, Goodenough UW, Goodenough DA, Jawitz J, Martin H. Gametic differentiation in Chlamydomonas reinhardtii. II. Flagellar membranes and the agglutination reaction. J. Cell Biol. 1975;67:606–622. - PMC - PubMed
    1. Bhogaraju S, Cajanek L, Fort C, Blisnick T, Weber K, Taschner M, Mizuno N, Lamla S, Bastin P, Nigg EA, et al. Molecular Basis of Tubulin Transport Within the Cilium by IFT74 and IFT81. Science. 2013;341:1009–1012. - PMC - PubMed
    1. Bielas SL, Silhavy JL, Brancati F, Kisseleva MV, Al-Gazali L, Sztriha L, Bayoumi Ra, Zaki MS, Abdel-Aleem A, Rosti RO, et al. Mutations in INPP5E, encoding inositol polyphosphate-5-phosphatase E, link phosphatidyl inositol signaling to the ciliopathies. Nat. Genet. 2009;41:1032–1036. - PMC - PubMed
    1. Boehlke C, Kotsis F, Patel V, Braeg S, Voelker H, Bredt S, Beyer T, Janusch H, Hamann C, Gödel M, et al. Primary cilia regulate mTORC1 activity and cell size through Lkb1. Nat. Cell Biol. 2010;12:1115–1122. - PMC - PubMed