Brain metabolic pattern analysis using a magnetic resonance spectra classification software in experimental stroke
- PMID: 28086802
- PMCID: PMC5237280
- DOI: 10.1186/s12868-016-0328-x
Brain metabolic pattern analysis using a magnetic resonance spectra classification software in experimental stroke
Abstract
Background: Magnetic resonance spectroscopy (MRS) provides non-invasive information about the metabolic pattern of the brain parenchyma in vivo. The SpectraClassifier software performs MRS pattern-recognition by determining the spectral features (metabolites) which can be used objectively to classify spectra. Our aim was to develop an Infarct Evolution Classifier and a Brain Regions Classifier in a rat model of focal ischemic stroke using SpectraClassifier.
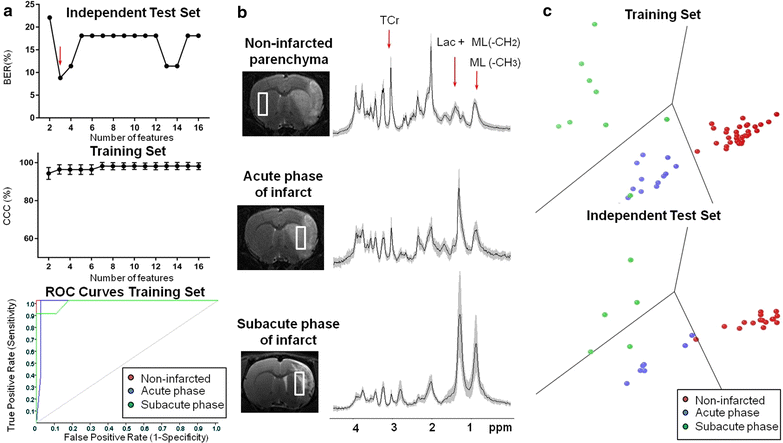
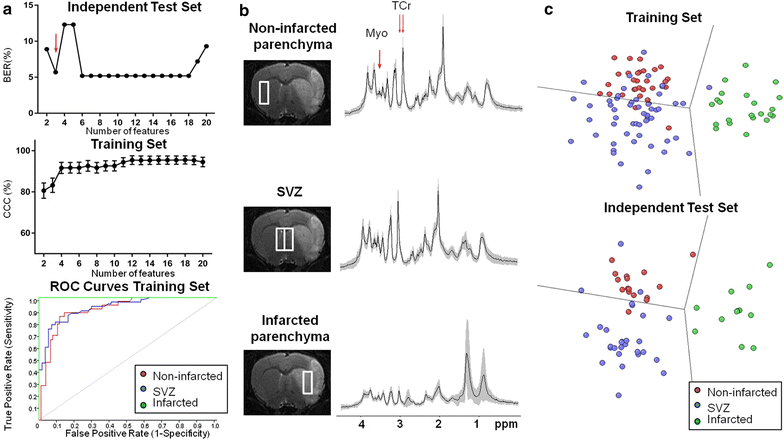
Results: A total of 164 single-voxel proton spectra obtained with a 7 Tesla magnet at an echo time of 12 ms from non-infarcted parenchyma, subventricular zones and infarcted parenchyma were analyzed with SpectraClassifier ( http://gabrmn.uab.es/?q=sc ). The spectra corresponded to Sprague-Dawley rats (healthy rats, n = 7) and stroke rats at day 1 post-stroke (acute phase, n = 6 rats) and at days 7 ± 1 post-stroke (subacute phase, n = 14). In the Infarct Evolution Classifier, spectral features contributed by lactate + mobile lipids (1.33 ppm), total creatine (3.05 ppm) and mobile lipids (0.85 ppm) distinguished among non-infarcted parenchyma (100% sensitivity and 100% specificity), acute phase of infarct (100% sensitivity and 95% specificity) and subacute phase of infarct (78% sensitivity and 100% specificity). In the Brain Regions Classifier, spectral features contributed by myoinositol (3.62 ppm) and total creatine (3.04/3.05 ppm) distinguished among infarcted parenchyma (100% sensitivity and 98% specificity), non-infarcted parenchyma (84% sensitivity and 84% specificity) and subventricular zones (76% sensitivity and 93% specificity).
Conclusion: SpectraClassifier identified candidate biomarkers for infarct evolution (mobile lipids accumulation) and different brain regions (myoinositol content).
Keywords: Animal model; Magnetic resonance spectroscopy; Metabolomics; Pattern recognition; Stroke.
Figures


References
-
- Stefan D, Di Cesare F, Andrasescu A, Popa E, Lazariev A, Vescovo E, et al. Quantitation of magnetic resonance spectroscopy signals: the jMRUI software package. Meas Sci Technol. 2009;20:10. doi: 10.1088/0957-0233/20/10/104035. - DOI
Publication types
MeSH terms
Substances
LinkOut - more resources
Full Text Sources
Other Literature Sources
Medical

