Cost of shingles: population based burden of disease analysis of herpes zoster and postherpetic neuralgia
- PMID: 28086817
- PMCID: PMC5237245
- DOI: 10.1186/s12879-017-2185-3
Cost of shingles: population based burden of disease analysis of herpes zoster and postherpetic neuralgia
Abstract
Background: Around 30% of the population will experience herpes zoster (HZ), 10% of whom develop postherpetic neuralgia (PHN). Together, these illnesses produce a significant economic burden to the healthcare system.
Methods: Administrative healthcare data collected over the period of April 1st 1997 to March 31st 2014 were analyzed to determine the healthcare system burden of HZ using direct medical costs. Episodes of HZ were identified using international classification of disease (ICD) codes. Trends in age-adjusted (AA) HZ-rates were analyzed by piecewise-regression. Total annual and per-episode costs were determined for drug treatment, medical care, and hospitalizations within each year.
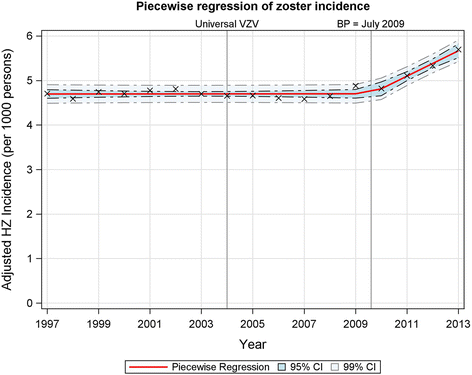
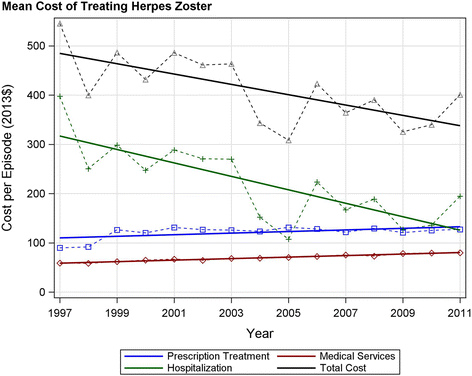
Results: The incidence of HZ increased by 49.5% from 1997/98 to 2013/14. Piecewise-regression of AA-rates revealed a steady AA-rate of 4.7 episodes/1000 person-years (PY) from 1997/98 to a breakpoint in 2008/09, after which rates began to increase reaching 5.7 episodes/1000 PY in 2013/14. Drug costs rose significantly (p <0.03) from $89.77/episode (95% CI: $82.96, $96.59) to $127.34/episode (95% CI: $117.24, $137.44). Medical costs increased (p <0.0001) from $57.98/episode (95% CI; $55.26, $60.70) to $78.84/episode (95% CI; $74.08, $83.61). Hospitalization rates declined from 3.10% in 1997/98 to 1.36% in 2011/12, resulting in cost dropping from $397/episode (95% CI; $284, $511) to $195/episode (95% CI; $129, $260). Total annual costs of HZ and PHN were $1,997,183 in 2011/12, 4.7% lower than the 1997/98 costs of $2,095,633.
Conclusion: A significant increase in annual number of HZ cases was observed, driven largely by demographic factors. A 21% increase in the AA-incidence reveals changes in HZ rates beyond those expected by population shifts. The large increase in incidence of HZ, with rising per episode medical and prescription costs were offset by dramatic drops in hospitalization rates, the net effect of which has been to hold the total costs relatively constant. However, the decrease in hospitalization rates slowed over the last half of the study, settling at 1.3% in the last 4 study years. The likely future of HZ burden is one of rising costs, primarily driven by the demographic shifts of an increasing and aging population.
Keywords: Administrative data; Burden; Economics; Epidemiology; Herpes zoster; Postherpetic neuralgia.
Figures


References
Publication types
MeSH terms
Grants and funding
LinkOut - more resources
Full Text Sources
Other Literature Sources
Medical
Miscellaneous

