. 2017 Jan 13;16(1):8.
doi: 10.1186/s12944-017-0406-9.

Biochemical mechanism underlying hypertriglyceridemia and hepatic steatosis/hepatomegaly induced by acute schisandrin B treatment in mice

Affiliations

Biochemical mechanism underlying hypertriglyceridemia and hepatic steatosis/hepatomegaly induced by acute schisandrin B treatment in mice

Yi Zhang et al. Lipids Health Dis. .

Abstract

Background: It has been demonstrated that acute oral administration of schisandrin B (Sch B), an active dibenzocyclooctadiene isolated from Schisandrae Fructus (a commonly used traditional Chinese herb), increased serum and hepatic triglyceride (TG) levels and hepatic mass in mice. The present study aimed to investigate the biochemical mechanism underlying the Sch B-induced hypertriglyceridemia, hepatic steatosis and hepatomegaly.

Methods: Male ICR mice were given a single oral dose of Sch B (0.25-2 g/kg). Sch B-induced changes in serum levels of biomarkers, such as TG, total cholesterol (TC), apolipoprotein B48 (ApoB 48), very-low-density lipoprotein (VLDL), non-esterified fatty acid (NEFA) and hepatic growth factor (HGF), as well as hepatic lipids and mass, epididymal adipose tissue (EAT) and adipocyte size, and histological changes of the liver and EAT were examined over a period of 12-120 h after Sch B treatment.

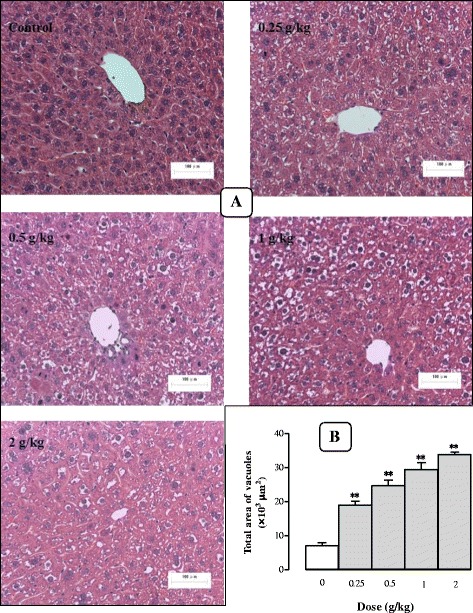
Results: Serum and hepatic TG levels were increased by 1.0-4.3 fold and 40-158% at 12-72 h and 12-96 h, respectively, after Sch B administration. Sch B treatment elevated serum ApoB 48 level (up to 12%), a marker of exogenous TG, but not VLDL, as compared with the vehicle treatment. Treatment with Sch B caused a time-/dose-dependent reduction in EAT index (up to 39%) and adipocyte size (up to 67%) and elevation in serum NEFA level (up to 55%). Sch B treatment induced hepatic steatosis in a time-/dose-dependent manner, as indicated by increases in total vacuole area (up to 3.2 fold vs. the vehicle control) and lipid positive staining area (up to 17.5 × 103 μm2) in liver tissue. Hepatic index and serum HGF levels were increased by 18-60% and 42-71% at 12-120 h and 24-72 h post-Sch B dosing, respectively. In addition, ultrastructural changes, such as increase in size and disruption of cristae, in hepatic mitochondria were observed in Sch B-treated mice.

Conclusion: Our findings suggest that exogenous sources of TG and the breakdown of fat storage in the body contribute to Sch B-induced hypertriglyceridemia and hepatic steatosis in mice. Hepatomegaly (a probable hepatotoxic action) caused by Sch B may result from the fat accumulation and mitochondrial damage in liver tissue.

Keywords: Chylomicron; Hepatic steatosis; Hepatomegaly; Hypertriglyceridemia; Lipolysis; Schisandrin B.


Figures

Fig. 1
Fig. 1
Time/dose response of schisandrin B (Sch B) treatment on serum triglyceride (TG) and total cholesterol (TC) levels. Mice were orally administered with Sch B (1 g/kg, suspended in olive oil). Control (untreated) animals received the vehicle (5 ml/kg) only. For the time course study, serum TG and TC levels were measured at 12, 24, 48, 72, 96, and 120 h after Sch B treatment or 24 h post-vehicle treatment (a and c). Preliminary studies indicated that vehicle-treated mice did not show any changes in serum lipids from 12 to 120 h post treatment. For the dose–response study, serum TG and TC were determined at 24 h in the Sch B-treated mice. Pharmacodynamic parameters (b and d) E max (maximal effect), K D (affinity), and pD 2 (an index of affinity) were estimated with the Scott’s plot method. Values given are the mean ± SEM, with n = 10. *P < 0.05, **P < 0.01 vs control, using a one-way ANOVA followed by Dunnett’s multiple comparisons test, Student’s t-test or post-hoc analysis
Fig. 2
Fig. 2
Time/dose response of Sch B treatment on serum apolipoprotein B48 (Apo B48) and very-low-density lipoprotein (VLDL) levels. Experimental details were described in Fig. 1. For the time course study, serum Apo 48 and VLDL levels were measured at 12, 24, 48, 72, 96, and 120 h after Sch B treatment (a and c). For the dose–response study, mice were intragastrically treated with Sch B (0.25–2 g/kg). Twenty-four h later, serum samples were obtained to determine the Apo B 48 and VLDL levels, as well as the E max, K D, and pD 2 values (b and d). Values given are the mean ± SEM, with n = 10. *P < 0.05, **P < 0.01 vs Control, using a one-way ANOVA followed by Dunnett’s multiple comparisons test, Student’s t-test or post-hoc analysis
Fig. 3
Fig. 3
Time/dose response of Sch B treatment on serum non-esterified fatty acid (NEFA) and hepatocyte growth factor (HGF) levels. Experimental details were described in Fig. 1. For the time course study, serum NEFA and HGF levels were measured at 12, 24, 48, 72, 96 and 120 after Sch B treatment (a and c). For the dose–response study, mice were intragastrically treated with Sch B (0.25–2 g/kg). Twenty-four 24 h later, the pharmacodynamic parameters (E max, K D, and pD 2) were estimated (b and d). Values given are the mean ± SEM, with n = 10. *P < 0.05, **P < 0.01 vs Control, using a one-way ANOVA followed by Dunnett’s multiple comparisons test, Student’s t-test or post-hoc analysis
Fig. 4
Fig. 4
Time/dose response of Sch B treatment on epididymal adipose tissue (EAT) and adipocyte mass. Experimental details were described in Fig. 1. For the time course study, EAT index (EAT weight/body weight × 100) and adipocyte size were measured at 12, 24, 48, 72, 96, and 120 h after Sch B treatment (a, b and d). A representative microscopic picture of a haematoxylin and eosin (HE)-stained EAT section for each group is shown in (c). The adipocyte area of each section was computed by Image Proplus 6.0. For the dose–response study, mice were intragastrically treated with Sch B (0.25–2 g/kg). Twenty-four h later, the pharmacodynamic parameters (E max, K D, and pD 2) of Sch B on EAT index were measured (b). Values given are the mean ± SEM, with n = 10. *P < 0.05, **P < 0.01 vs Control, using a one-way ANOVA followed by Dunnett’s multiple comparisons test, Student’s t-test or post-hoc analysis
Fig. 5
Fig. 5
Time/dose response of Sch B treatment on hepatic triglyceride (TG) and total cholesterol (TC) contents. Experimental details were described in Fig. 1. For the time course study, hepatic TG and TC contents were measured at 12, 24, 48, 72, 96, and 120 h after Sch B treatment (a and c). For the dose–response study, mice were intragastrically treated with Sch B (0.25–2 g/kg). Twenty-four h and forty-eight h later, the pharmacodynamic parameters E max, K D, and pD 2 were determined (b, d and e). Values given are the mean ± SEM, with n = 10. *P < 0.05, **P < 0.01 vs Control, using a one-way ANOVA followed by Dunnett’s multiple comparisons test, Student’s t-test or post-hoc analysis
Fig. 6
Fig. 6
Time response of Sch B treatment on hepatic steatosis. Experimental details were described in Fig. 1. Mice were orally administered with Sch B (1 g/kg). Control (untreated) animals received the vehicle only. After 12, 24, 48, 72, 96, and 120 h, mice were sacrificed, and livers were removed and frozen by liquid nitrogen. A representative microscopic picture of Oil Red O-stained liver tissue section for each group is shown in a, lipid positive staining area of each section was computed by Image Proplus 6.0 (b). Values given are the mean ± SEM, with n = 10. *P < 0.05, **P < 0.01 vs Control, using a one-way ANOVA followed by Dunnett’s multiple comparisons test, Student’s t-test or post-hoc analysis
Fig. 7
Fig. 7
Dose response of Sch B treatment on hepatic steatosis. Experimental details were described in Figs. 1 and 6. Mice were intragastrically treated with Sch B (0.25–2 g/kg) or vehicle. Twenty-four h later, a representative microscopic picture of Oil Red O-stained liver tissue section is shown in (a). The lipid positive staining area of each section was computed by Image Proplus 6.0 (b). Values given are the mean ± SEM, with n = 10. *P < 0.05, **P < 0.01 vs Control, using a one-way ANOVA followed by Dunnett’s multiple comparisons test, Student’s t-test or post-hoc analysis
Fig. 8
Fig. 8
Time/dose response of Sch B treatment on hepatic mass and haematoxylin and eosin (HE) stain. Experimental details were described in Fig. 1. At 24 h after Sch B treatment, mice were sacrificed, and livers were removed and weighed to calculate the hepatic index (hepatic weight/body weight × 100) and pharmacodynamic parameters (E max, K D, and pD 2) shown in (a and b). Then liver samples were fixed in 10% formalin and stained with HE. A representative microscopic picture of a HE-stained liver tissue section for each group is shown in c, and total vacuole area of each section was computed by Image Proplus 6.0 (d). Values given are the mean ± SEM, with n = 10. *P < 0.05, **P < 0.01 vs Control, using a one-way ANOVA follow by Dunnett’s multiple comparisons test, Student’s t-test or post-hoc analysis
Fig. 9
Fig. 9
Dose response of Sch B treatment on hepatocyte structure. Experimental details were described in Fig. 1 and 8. Mice were intragastrically treated with Sch B (0.25–2 g/kg) or vehicle. At 24 h after Sch B treatment, liver tissue sections were stained with HE (a). The total vacuole area of each section was computed by Image Proplus 6.0 (b). Values given are the mean ± SEM, with n = 10. *P < 0.05, **P < 0.01 vs Control, using a one-way ANOVA followed by Dunnett’s multiple comparisons test, Student’s t-test or post-hoc analysis
Fig. 10
Fig. 10
Time response of Sch B treatment on hepatocyte ultrastructure. Experimental details were described in Fig. 1. Mice were orally administered with Sch B (1 g/kg). Control (untreated) animals received the vehicle only. After 72 and 120 h, mice were sacrificed and liver tissues were removed and fixed in 2% glutaraldehyde Sorensen’s phosphate buffer. Then ultrathin sections were made and stained with uranyl acetate and lead citrate for TEM

References

    1. Cameron AJ, Shaw JE, Zimmet PZ. The metabolic syndrome: prevalence in worldwide populations. Endocrinol Metab Clin North Am. 2004;33:351–75. doi: 10.1016/j.ecl.2004.03.005. - DOI - PubMed
    1. Carpentier AC. Hypertriglyceridemia associated with abdominal obesity: getting contributing factors into perspective. Arterioscler Thromb Vasc Biol. 2015;35:2076–8. - PubMed
    1. Watts GF, Karpe F. Republished review: Triglycerides and atherogenic dyslipidaemia: extending treatment beyond statins in the high-risk cardiovascular patient. Postgrad Med J. 2011;87:776–82. doi: 10.1136/pgmj.2010.204990rep. - DOI - PubMed
    1. Subramanian S, Chait A. Hypertriglyceridemia secondary to obesity and diabetes. Biochim Biophys Acta. 2012;1821:819–25. - PubMed
    1. Charlesworth A, Steger A, Crook MA. Acute pancreatitis associated with severe hypertriglyceridaemia; A retrospective cohort study. Int J Surg. 2015;25:23–7. doi: 10.1016/j.ijsu.2015.08.080. - DOI - PubMed

MeSH terms