. 2017 Jan 17;46(1):133-147.
doi: 10.1016/j.immuni.2016.12.010. Epub 2017 Jan 10.

On-going Mechanical Damage from Mastication Drives Homeostatic Th17 Cell Responses at the Oral Barrier

Affiliations

On-going Mechanical Damage from Mastication Drives Homeostatic Th17 Cell Responses at the Oral Barrier

Nicolas Dutzan et al. Immunity. .

Abstract

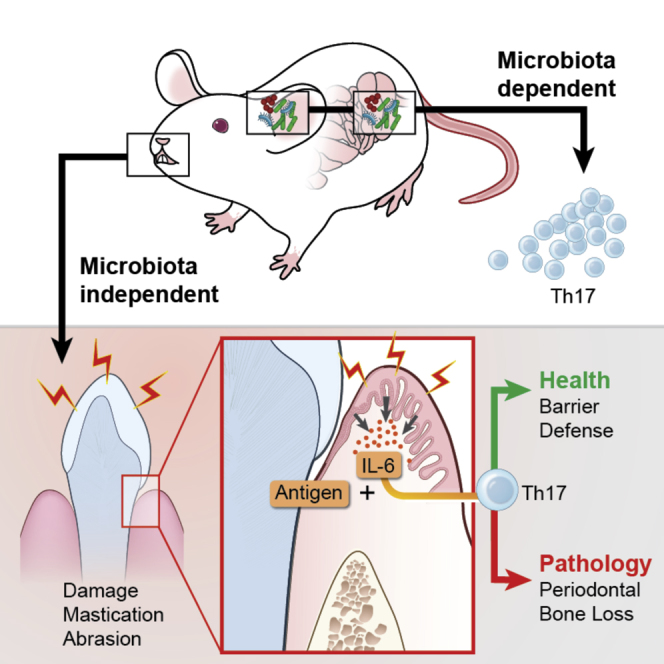
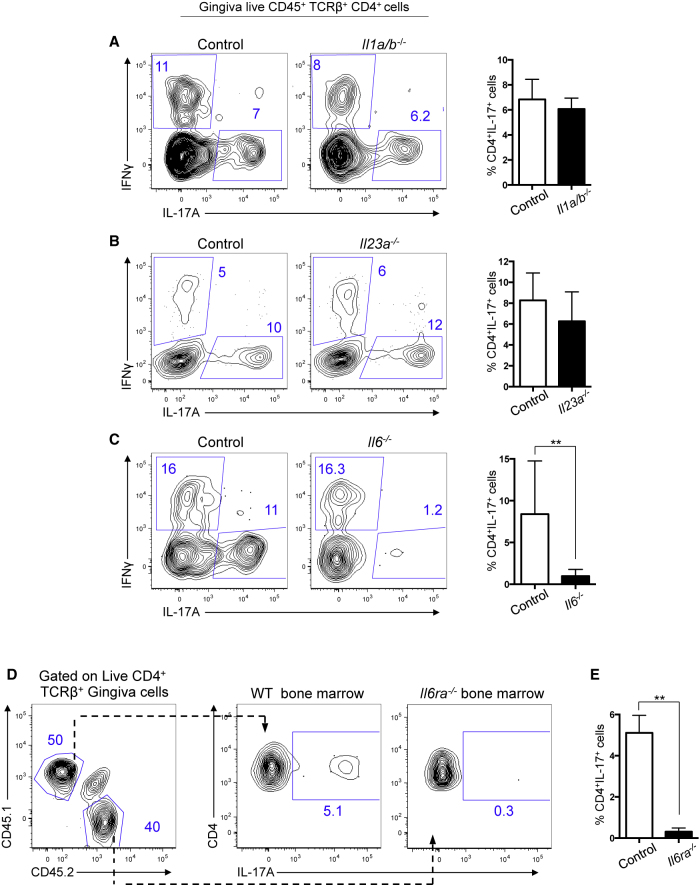
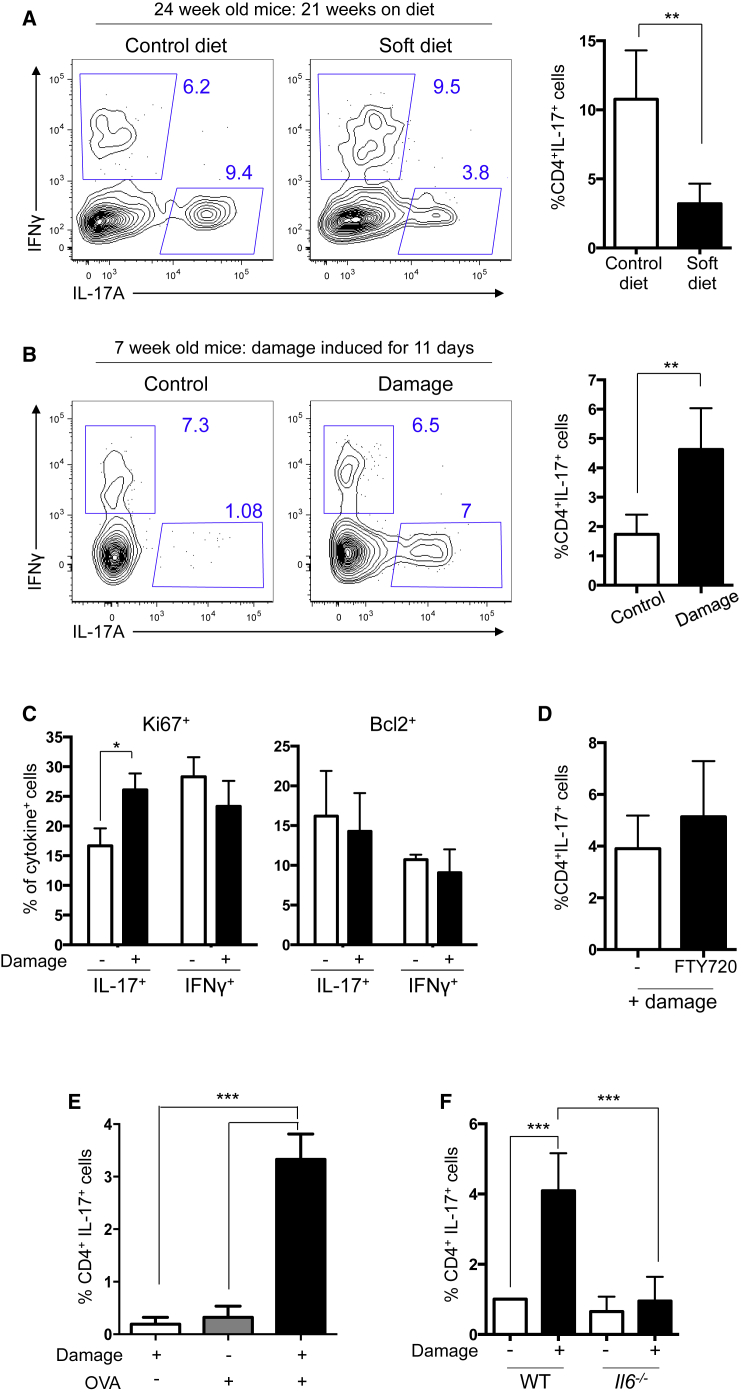
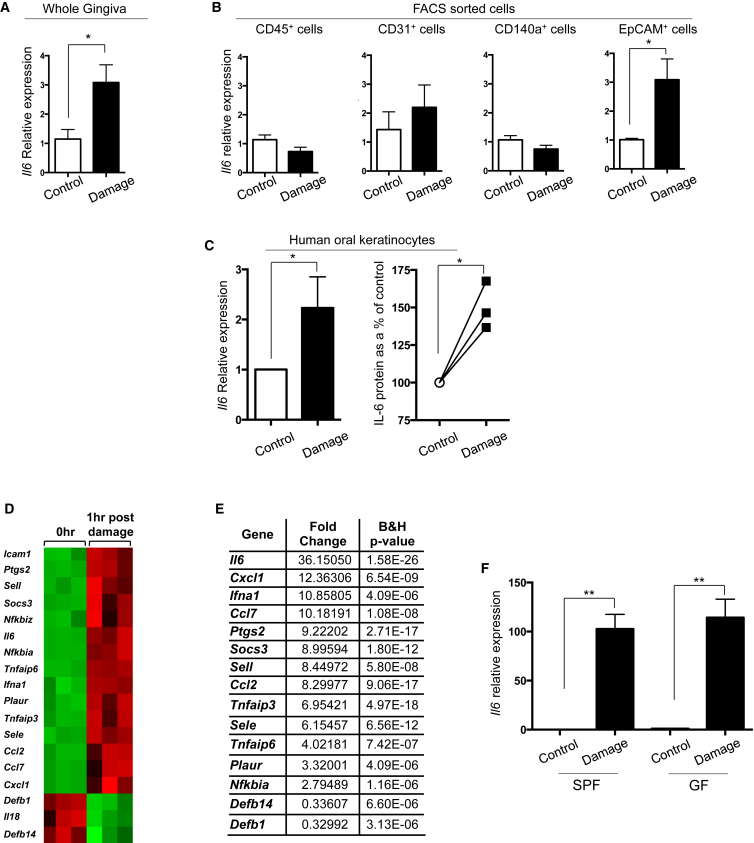
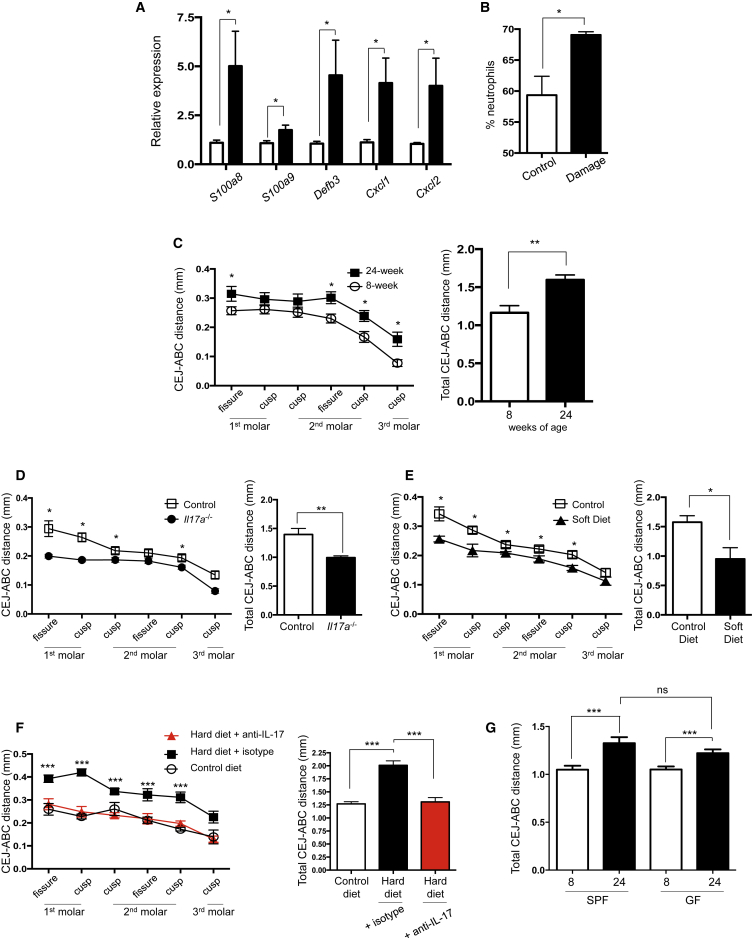
Immuno-surveillance networks operating at barrier sites are tuned by local tissue cues to ensure effective immunity. Site-specific commensal bacteria provide key signals ensuring host defense in the skin and gut. However, how the oral microbiome and tissue-specific signals balance immunity and regulation at the gingiva, a key oral barrier, remains minimally explored. In contrast to the skin and gut, we demonstrate that gingiva-resident T helper 17 (Th17) cells developed via a commensal colonization-independent mechanism. Accumulation of Th17 cells at the gingiva was driven in response to the physiological barrier damage that occurs during mastication. Physiological mechanical damage, via induction of interleukin 6 (IL-6) from epithelial cells, tailored effector T cell function, promoting increases in gingival Th17 cell numbers. These data highlight that diverse tissue-specific mechanisms govern education of Th17 cell responses and demonstrate that mechanical damage helps define the immune tone of this important oral barrier.

Keywords: IL-17; T cells; Th17 cells; barrier immunity; mucosal immunology; oral immunity; periodontitis.


Figures

None
Graphical abstract
Figure 1
Figure 1
Frequencies of Oral Barrier IL-17-Producing CD4+ T Cells Increase with Age (A–D) Single-cell preparations of mouse gingiva were stimulated with PMA and ionomycin. p < 0.05, ∗∗p < 0.005 as determined by one-way ANOVA. (A and B) Representative FACS plots show IFN-γ versus IL-17 staining gated on CD4+ T cells in the gingiva of (A) 8- and (B) 24-week-old mice. Numbers in gates indicate percentages of cells. (C) Bar graphs show frequencies of gingiva CD4+ T cells producing IFN-γ (left) and IL-17 (right). (D) Bar graph shows number of gingiva IL-17+CD4+ T cells. n = 6–28; data from 4+ experiments. (E) Bar graphs show frequencies of CD4+ T cells producing IL-17 in the small intestinal lamina propria (SI Lp), oral barrier draining lymph node (LN), and spleen of 8-week-old (n = 4–5; white bars) and 24-week-old (n = 5–12; black bars) mice. (F) Bar graph shows frequency of CD4+Foxp3+ T cells in the gingiva of 8-week-old (n = 6) and 24-week-old (n = 4) mice, examined over three experiments. (G) Bar graphs show the percent of gingival IL-17+ or IFN-γ+ cells that are positive for Ki67 (left) or Bcl-2 (right) from 8-week-old (n = 7–9; white bars) and 24-week-old (n = 10; black bars) mice. Data from three separate experiments. (H–J) Single-cell preparations of human gingiva were stimulated with PMA and ionomycin. (H) Representative FACS plots show IFN-γ versus IL-17 staining on live, CD45+ cells in gingiva of healthy individuals who were 18–25 years of age or 40–50 years of age. (I) Representative FACS plots further characterizing the IL-17+ population in human gingiva; there was little staining for TCRγδ within the IL-17+ population (Figures S1D and S1E). Numbers in gates indicate percentages of cells. (J) Graph showing frequency of gingival IL-17+ cells in healthy individuals who were 18–25 (n = 9) or 40–50 years of age (n = 10). p < 0.05 as determined by unpaired Student’s t test. Error bars represent mean ± SEM. See also Figure S1.
Figure 2
Figure 2
Microbiome Shifts Do Not Correlate with the Presence of Gingival Th17 Cells (A) Graph shows comparison of total bacterial load in the oral cavity of 8- and 24-week-old mice, determined by a 16S rRNA-based real-time PCR assay. (B and C) Graphs show microbiome composition at different taxonomical levels, depicting most abundant (B) phyla and (C) OTUs in longitudinally sampled mice (n = 10). No differences in relative abundances were observed between young and old mice. (D) PCoA plot based on thetaYC distances showing no difference in global community structure at the 8- and 24-week time points (n = 10). Some data points are not visible due to tight clustering. (E) SFB levels in cecum samples and oral swabs of mice from Taconic Farms (Tac) and Jackson Laboratories (Jax). Bar graph shows CT value for the real-time PCR reaction, ND indicates below the level of detection for the assay. (F) Representative FACS plots show CD4 verses IL-17 staining gated on gingiva CD45+TCRβ+CD4+ T cells from either 24-week-old Tac (n = 12) or Jax (n = 4) mice. Bar graph shows frequency of gingiva IL-17+CD4+ T cell in Tac and Jax mice from two separate experiments. (G) PCoA plot based on thetaYC distances showing Tac and Jax mice cluster apart, indicating different oral microbiomes. p < 0.001 as determined by AMOVA. Error bars represent mean ± SEM. See also Figure S2.
Figure 3
Figure 3
Th17 Cell Accumulation at the Oral Barrier Occurs Independently of Commensal Colonization (A and B) Th17 cell frequencies were examined in age-matched SPF and GF mice. (A) Representative FACS plots show gating for CD4+ T cells in gingiva. Right plots show IFN-γ versus IL-17 staining in live, CD4+ T cells. Top row, SPF mice; bottom row, GF mice. Numbers in gates indicate percentages of cells. (B) Bar graph shows frequency of gingiva IL-17+CD4+ T cell in aged-matched SPF (n = 6) and GF (n = 7) mice from 3 experiments. (C) Bar graph shows frequency of small intestine lamina propria (SI Lp) IL-17+CD4+ T cell in SPF (n = 5) and GF (n = 5) mice from 2 experiments. (D) Bar graph shows log fold change in expression of indicated genes in GF relative to SPF gingiva. Data representative of two independent nano-string runs with a total of four samples per group. Error bars represent mean ± SEM. See also Figure S3.
Figure 4
Figure 4
Differentiation of Oral Barrier Th17 Cells Is Dependent upon IL-6 (A–C) Representative FACS plots showing IFN-γ versus IL-17 staining gated on gingiva CD45+TCRβ+CD4+ T cells from age-matched old control or gene-deficient animals and bar graphs show frequency of gingival CD4+IL-17+ cells in (A) control (n = 8) and il1a and il1b−/− double gene-deficient (il1a/b−/−) (n = 7) mice, (B) control (n = 4) and il23a−/− (n = 4) mice, and (C) control (n = 7) and il6−/− (n = 9) mice, examined over 2–4 experiments. (D and E) Chimeric mice comprised of wild-type CD45.1+ and il6ra−/− CD45.2+ bone marrow were generated in CD45.1+CD45.2+ hosts and gingiva CD4+ T cell cytokine production examined at 24 weeks of age. (D) Representative FACS plot show CD45.1 and CD45.2 staining on gated CD4+ T cells and IL-17 staining in wild-type and il6ra−/− T cells in the same mouse. Numbers in gates indicate percentages of cells. (E) Bar graph shows frequency of gingival IL-17+CD4+ T cells in control and il6ra−/− bone marrow compartments. Data representative of two independent experiments with six to eight mice/group. ∗∗p < 0.005 as determined by unpaired Student’s t test. Error bars represent mean ± SEM. See also Figure S4.
Figure 5
Figure 5
Oral Barrier Damage Drives Generation of Gingival Th17 Cells (A) FACS plots show IFN-γ versus IL-17 staining in gingival CD45+TCRβ+CD4+ T cells from 24-week-old mice fed control or soft diet from weaning. Data are from three experiments with two to three mice/group. (B) FACS plots show IFN-γ versus IL-17 staining in gingival CD45+TCRβ+CD4+ T cells from young control or age-matched mice that experienced gingival damage every other day for 11 days. (C) Bar graphs show frequency of gingival IL-17+ or IFN-γ+ cells positive for Ki67 (left) or Bcl-2 (right) from control mice (−; white bars) or mice that experienced repeated gingival damage (+; black bars). Data are from two to three separate experiments with three to four mice/group. (D) Young mice underwent gingival barrier damage every other day for 11 days and at the same time received either FTY720 (black bars) or saline (white bars) i.p. Bar graph shows frequency of gingival CD4+IL-17+ cells. Data from two separate experiments with two to three mice/group. (E) OT-IIxRag−/− mice were either (1) not exposed to OVA but experienced gingival damage, (2) exposed to OVA ad libitum in the drinking water (1.5%) and topically at the gingiva (1 mg/mouse every other day), or (3) exposed to OVA ad libitum in the drinking water (1.5%) and topically at the gingiva (1 mg/mouse every other day) and also experienced gingival barrier damage. Gingival tissues were examined for Th17 cells at day 10. Bar graph shows percent of gingival IL-17+CD4+ T cells. Data are representative of two experiments with three to four mice/group. (F) Young, age-matched control or il6−/− mice were left untreated (−; white bars) or experienced gingival barrier damage every other day for 11 days (+; black bars) after which Th17 cells were examined. Bar graph shows percent of gingiva IL-17+CD4+ T cells. Data representative of two experiments with two to four mice/group. p < 0.05, ∗∗p < 0.01 as determined by unpaired Student’s t test. ∗∗∗p < 0.05 as determined by one-way ANOVA. Error bars represent mean ± SEM. See also Figure S5.
Figure 6
Figure 6
Gingival Damage Induces Rapid Production of IL-6 from Epithelial Cells (A) At day 11 after gingival damage, il6 expression was determined by qPCR in dissected gingival tissues of young mice. il6 expression is shown for samples from mice experiencing damage relative to that in control gingiva. Graph represents data from five mice/group. (B) CD45+ and different populations of CD45 cells were FACS sorted from the gingiva of control mice (white bars) or mice that experienced gingival damage 4 hr prior (black bars). Sorted populations were CD45+ cells, endothelial cells (CD45CD31+), fibroblasts (CD45CD31EpCAMCD140a+), and epithelial cells (CD45CD31EpCAM+). Bar graphs show il6 expression determined by qPCR and is shown in cells sorted from damaged gingiva relative to that in controls. Data are from two to three separate FACS sorts. (C) In vitro scratch assays on human oral keratinocytes cells. Left: RNA expression examined after 4 hr; graph shows il6 levels in damaged cells relative to that in un-damaged control. Right: Graph shows IL-6 levels in HOK supernatants examined 18–24 hr after scratching and presented as percent of control. Data from three experiments. (D and E) Nanostring immune gene array was performed on gingival tissues from mice that had experienced damage or controls. (D) Heatmap of differentially regulated genes (adjusted; p < 0.001). (E) List of 15 most upregulated genes in murine gingiva 1 hr after damage. Data from three replicates. (F) Young, age-matched SPF and GF mice were left untreated (control) or experienced gingival barrier damage (damage). 1 hr later gingival tissues were harvested and il6 expression examined by qPCR. Expression is shown in damaged gingiva relative to untreated controls (n = 5 mice/group). p < 0.05, ∗∗p < 0.0003, as determined by unpaired Student’s t test. Error bars represent mean ± SEM. See also Figure S6.
Figure 7
Figure 7
Gingival Damage Amplifies Oral Immune Responsiveness (A and B) Gingival tissues were isolated from mice that experienced gingival damage every other day for 11 days followed by 5–10 days of rest. (A) Graph shows gene expression in gingival tissues of mice experiencing damage relative to controls. Data are from three experiments with two to five mice/group. (B) Bar graph shows frequencies of neutrophils in gingival CD45+MHCII cells and shows data from two experiments. (C) Cemento-enamel junction (CEJ) to alveolar bone crest (ABC) distances in maxilla of 24-week-old (closed squares; n = 5) and 8-week-old (open circles; n = 5) mice. Left: CEJ-ABC distance was measured at six defined points across the molars. Right: Graph shows total CEJ-ABC distance. (D) CEJ to ABC distances in maxilla of 24-week-old wild-type (open squares; n = 9) or il17a−/− (closed circles; n = 9) mice. Left: CEJ-ABC distance measured as in (C). Right: Graph shows total CEJ-ABC distance. (E) CEJ to ABC distances in maxilla of 24-week-old mice fed control (open squares; n = 5) or soft (closed triangles; n = 5) diet since weaning. Left: CEJ-ABC distance measured as in (C). Right: Graph shows total CEJ-ABC distance. (F) CEJ to ABC distances in maxilla of 24-week-old mice fed control (open circles) or hard diet since weaning. Mice fed hard chow pellets received isotype antibody (closed circles, black bars) or anti-IL-17 (red triangles, red bars) i.p. every 5 days. Left: CEJ-ABC distance measured as in (C). Right: Graph shows total CEJ-ABC distance. Data are from two experiments with two to three mice/group. (G) Bar graph shows the CEJ to ABC distances in maxilla of young (white bars) and 24-week-old (black bars) SPF and GF mice. n = 7–13 mice/group. p < 0.05, ∗∗p < 0.01, as determined by unpaired Student’s t test. ∗∗∗p < 0.05 as determined by one-way ANOVA. Error bars represent mean ± SEM. See also Figure S7.

Comment in

Similar articles

Cited by

References

    1. Aas J.A., Paster B.J., Stokes L.N., Olsen I., Dewhirst F.E. Defining the normal bacterial flora of the oral cavity. J. Clin. Microbiol. 2005;43:5721–5732. - PMC - PubMed
    1. Abusleme L., Dupuy A.K., Dutzan N., Silva N., Burleson J.A., Strausbaugh L.D., Gamonal J., Diaz P.I. The subgingival microbiome in health and periodontitis and its relationship with community biomass and inflammation. ISME J. 2013;7:1016–1025. - PMC - PubMed
    1. Atarashi K., Nishimura J., Shima T., Umesaki Y., Yamamoto M., Onoue M., Yagita H., Ishii N., Evans R., Honda K., Takeda K. ATP drives lamina propria T(H)17 cell differentiation. Nature. 2008;455:808–812. - PubMed
    1. Bettelli E., Carrier Y., Gao W., Korn T., Strom T.B., Oukka M., Weiner H.L., Kuchroo V.K. Reciprocal developmental pathways for the generation of pathogenic effector TH17 and regulatory T cells. Nature. 2006;441:235–238. - PubMed
    1. Cash H.L., Whitham C.V., Behrendt C.L., Hooper L.V. Symbiotic bacteria direct expression of an intestinal bactericidal lectin. Science. 2006;313:1126–1130. - PMC - PubMed

Publication types