. 2017 Sep;43(Pt B):156-172.
doi: 10.1016/j.ymben.2017.01.001. Epub 2017 Jan 11.

Exo-MFA - A 13C metabolic flux analysis framework to dissect tumor microenvironment-secreted exosome contributions towards cancer cell metabolism

Affiliations

Exo-MFA - A 13C metabolic flux analysis framework to dissect tumor microenvironment-secreted exosome contributions towards cancer cell metabolism

Abhinav Achreja et al. Metab Eng. 2017 Sep.

Abstract

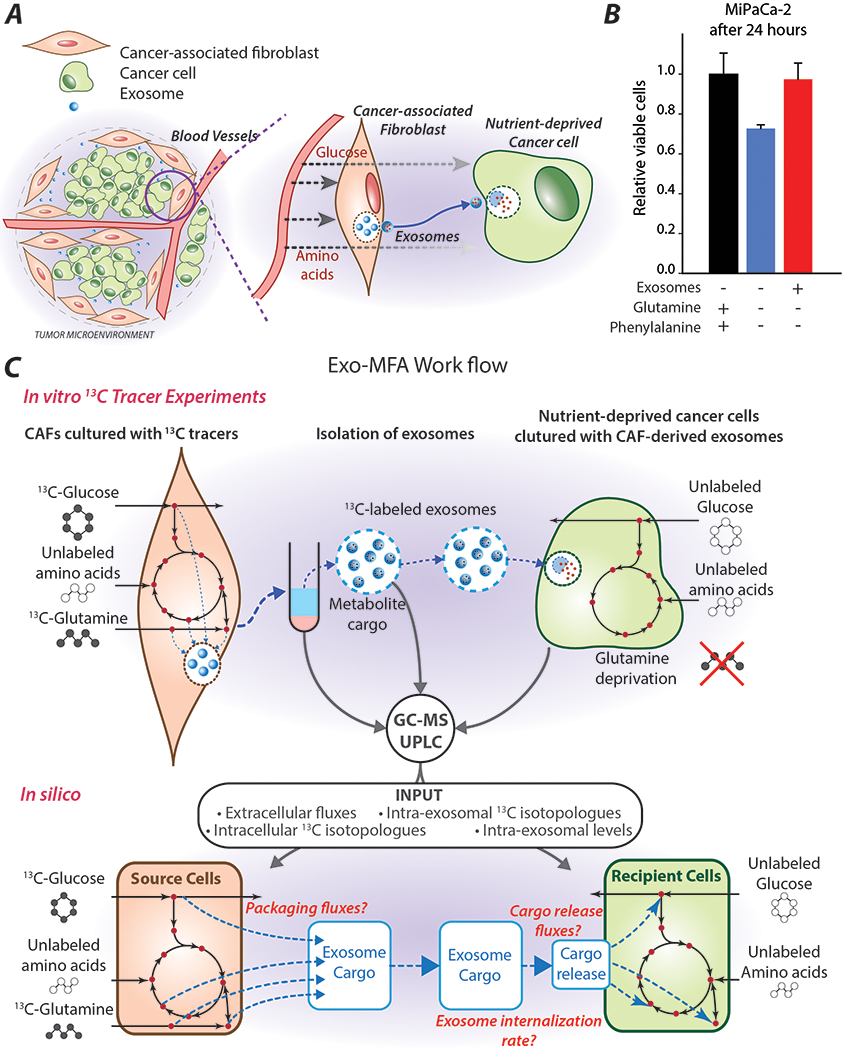
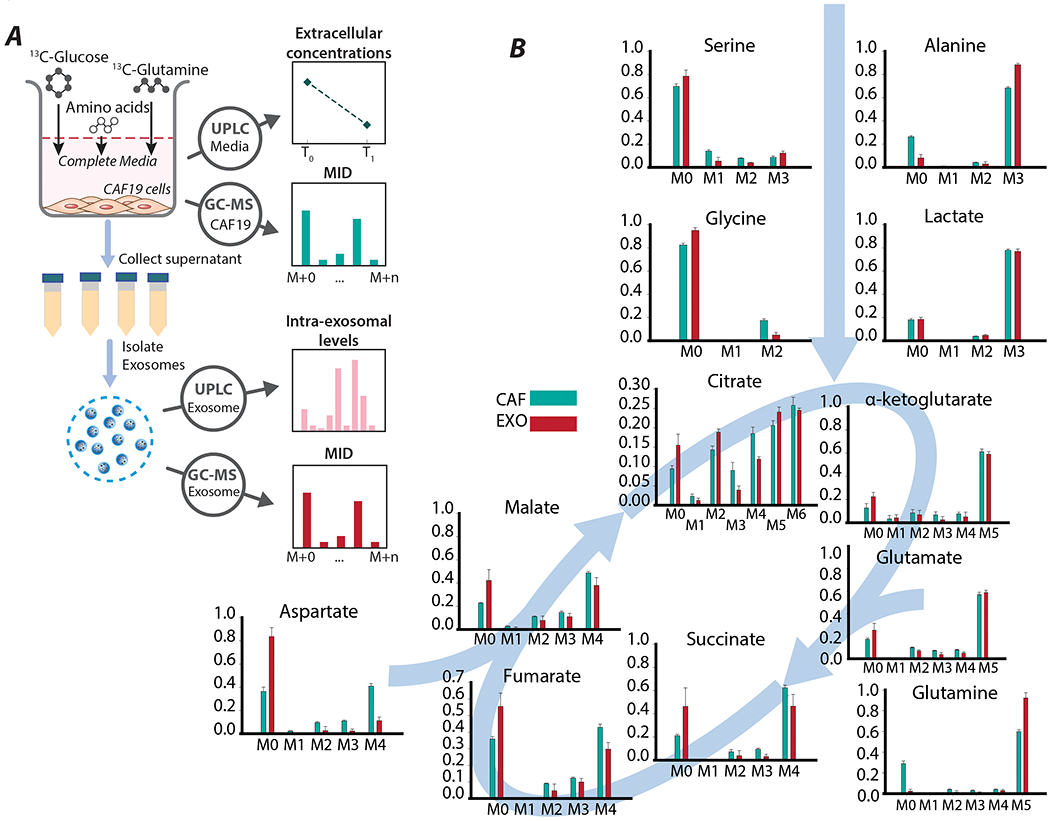
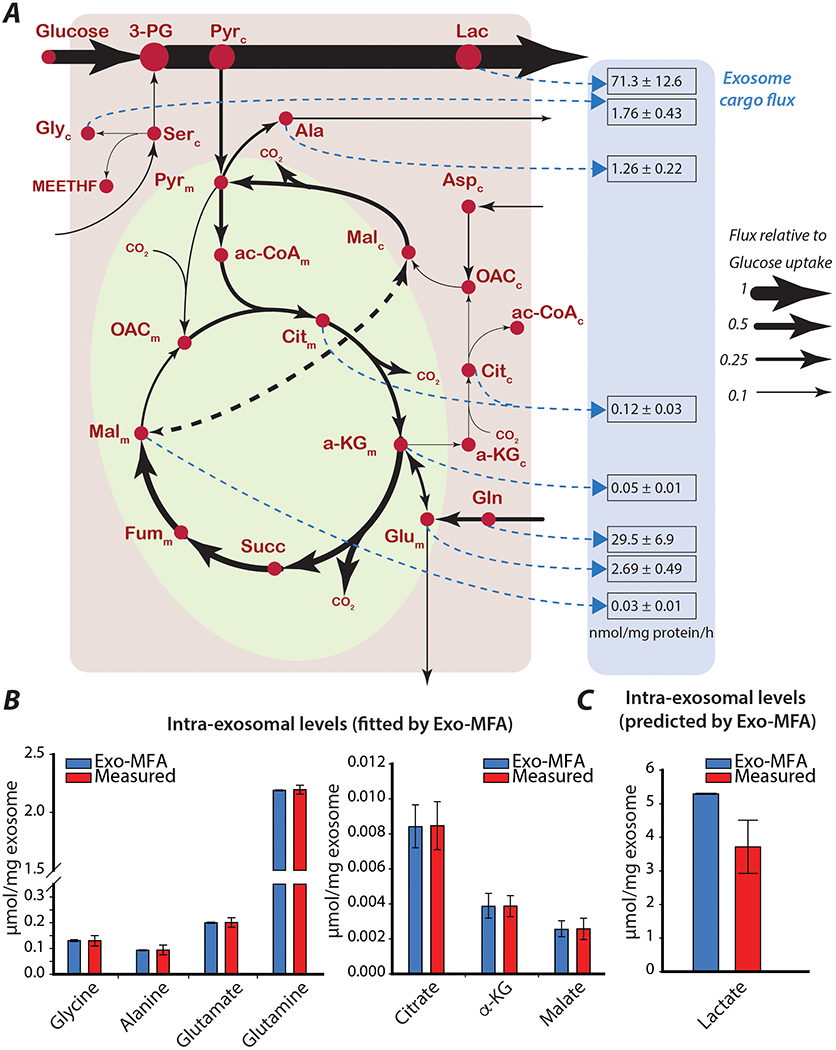
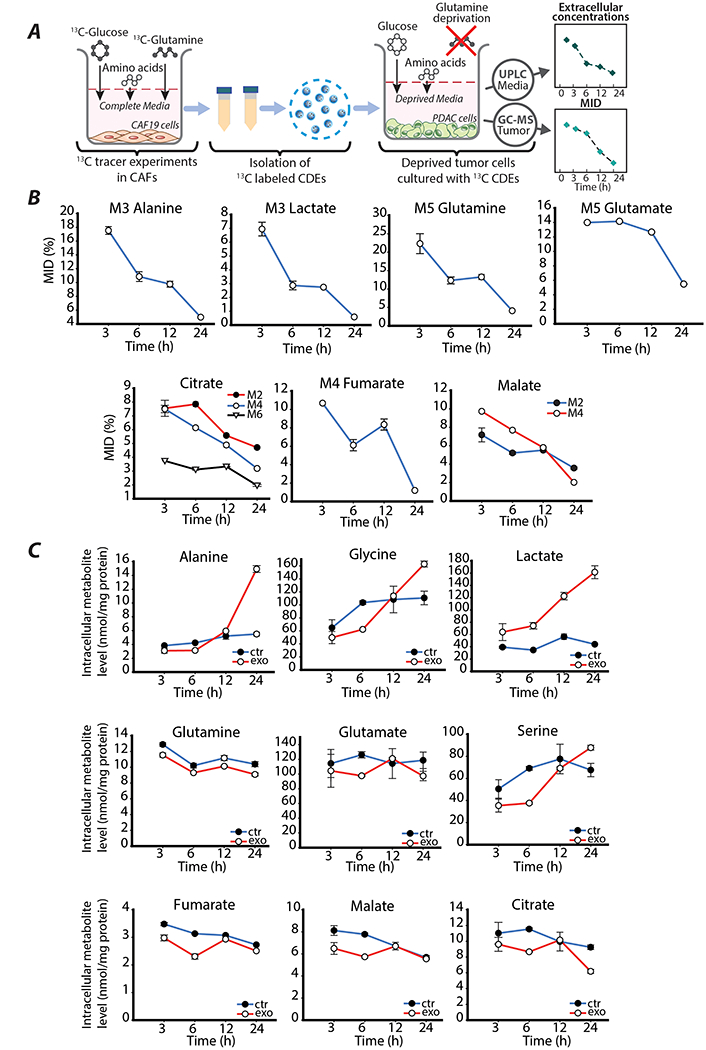
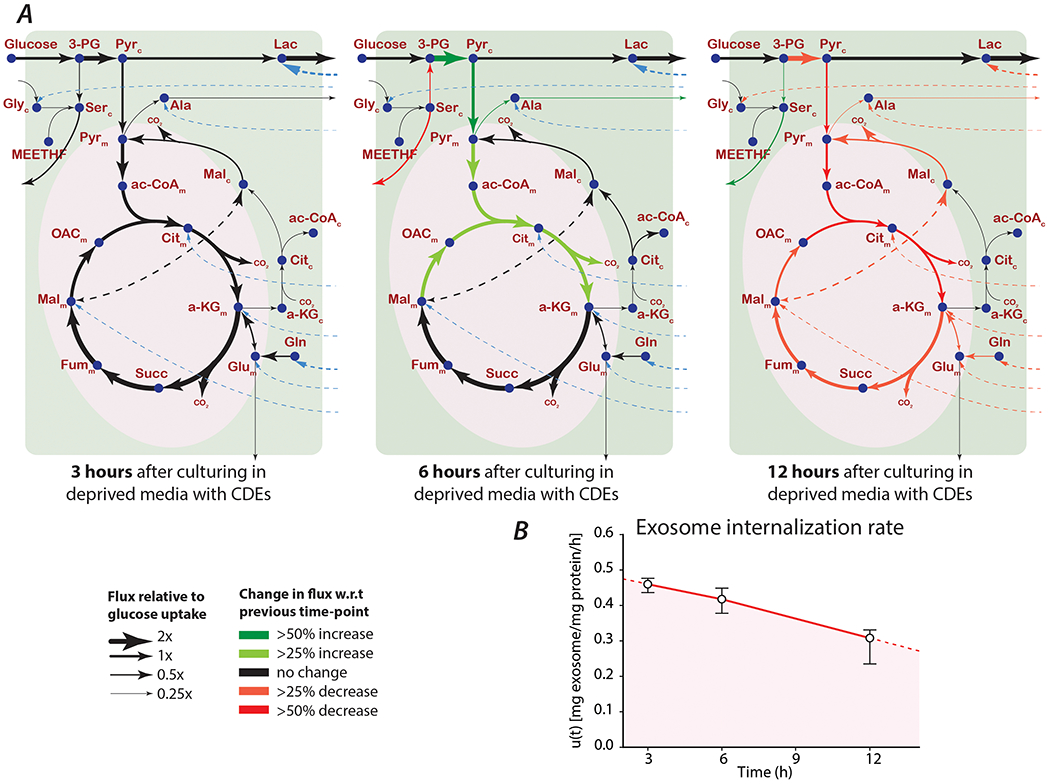
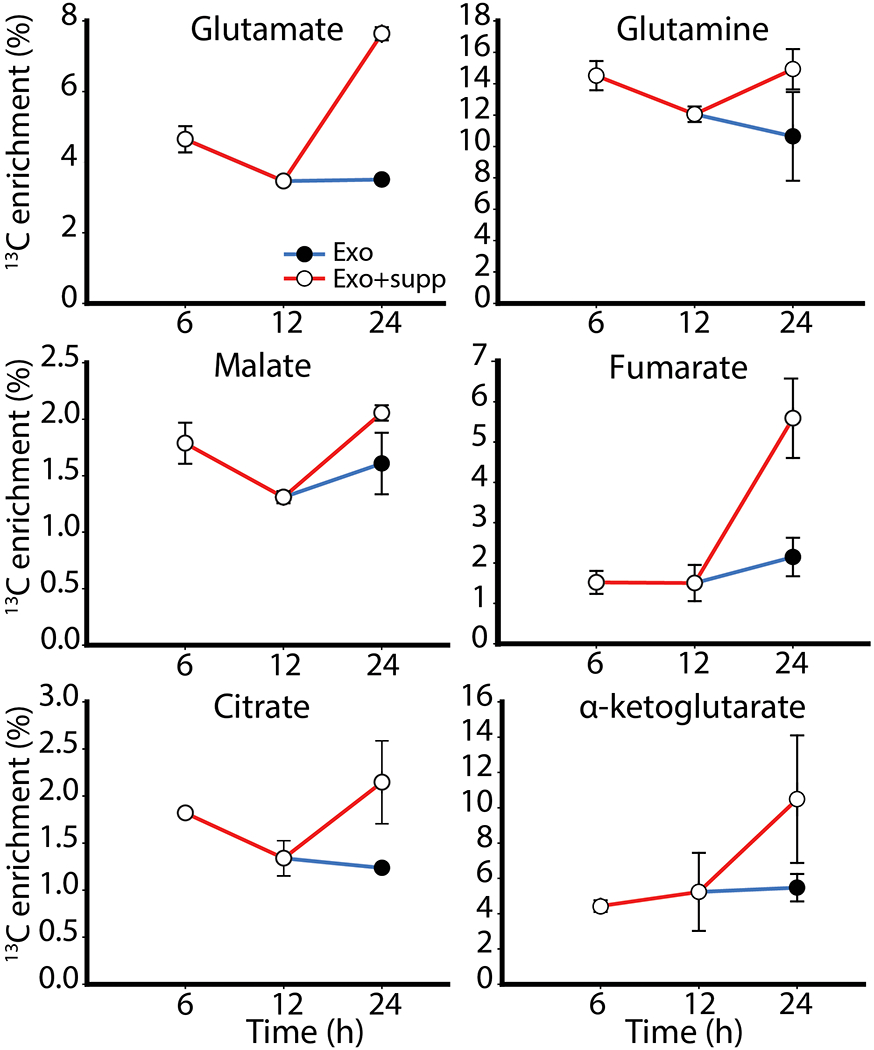
Dissecting the pleiotropic roles of tumor micro-environment (TME) on cancer progression has been brought to the foreground of research on cancer pathology. Extracellular vesicles such as exosomes, transport proteins, lipids, and nucleic acids, to mediate intercellular communication between TME components and have emerged as candidates for anti-cancer therapy. We previously reported that cancer-associated fibroblast (CAF) derived exosomes (CDEs) contain metabolites in their cargo that are utilized by cancer cells for central carbon metabolism and promote cancer growth. However, the metabolic fluxes involved in donor cells towards packaging of metabolites in extracellular vesicles and exosome-mediated metabolite flux upregulation in recipient cells are still not known. Here, we have developed a novel empirical and computational technique, exosome-mediated metabolic flux analysis (Exo-MFA) to quantify flow of cargo from source cells to recipient cells via vesicular transport. Our algorithm, which is based on 13C metabolic flux analysis, successfully predicts packaging fluxes to metabolite cargo in CAFs, dynamic changes in rate of exosome internalization by cancer cells, and flux of cargo release over time. We find that cancer cells internalize exosomes rapidly leading to depletion of extracellular exosomes within 24h. However, metabolite cargo significantly alters intracellular metabolism over the course of 24h by regulating glycolysis pathway fluxes via lactate supply. Furthermore, it can supply up to 35% of the TCA cycle fluxes by providing TCA intermediates and glutamine. Our algorithm will help gain insight into (i) metabolic interactions in multicellular systems (ii) biogenesis of extracellular vesicles and their differential packaging of cargo under changing environments, and (iii) regulation of cancer cell metabolism by its microenvironment.

Keywords: 13C-metabolic flux analysis; Cancer metabolism; Exo-MFA; Exosomes; Intercellular metabolic flux analysis; Tumor microenvironment.


Conflict of interest statement

“The authors disclose no potential conflicts of interest.”

Figures

Figure 1:
Figure 1:. Exosomes derived from tumor microenvironment rescue growth in nutrient-deprived PDAC cells.
(A) Simplified graphic of the tumor microenvironment that shows, where exosomes act as one of the channels of communication between cancer-associated fibroblasts and tumor cells. (B) Relative viability of PDAC cells (MiaPaCa-2) cultured in complete media or media deprived of glutamine and phenylalanine in the presence or absence of CAF-derived exosomes. Data are reported as mean ± SEM, (n≥3) from a batch representative of repeated experiments. (C) Schematic for the workflow of Exo-MFA describing the in vitro 13C tracer experiments from which CAFs, exosomes and PDAC cells are analyzed using GC-MS and UPLC systems to obtain measurements for in silico simulations of transport of metabolite cargo between cells via exosomes. Exo-MFA simulations provide estimates of intracellular fluxes, packaging fluxes in source cells, rate of uptake of exosomes and cargo release fluxes.
Figure 2:
Figure 2:. 13C-labeled tracer experiments in CAFs to produce 13C-labeled cargo in exosomes.
(A) Schematic of stable-isotope labeling experiments on CAFs. CAFs are cultured in [U-13C6]-glucose and [U-13C5]-glutamine to obtain exosomes with labeled metabolites. Labeled exosomes secreted by the CAFs (CDEs) are isolated from the media and and analyzed to measure mass isotopologue distributions and intra-exosomal metabolite levels. Spent media is used to measure extracellular metabolite concentrations using UPLC. (B) Mass isotopologue distributions of major central carbon metabolites in CAFs and CDEs. Data are reported as mean ± SEM, (n≥4 for exosomes, n≥6 for CAFs) from a batch representative of repeated experiments.
Figure 3:
Figure 3:. Exo-MFA predicts intracellular and exosomal packaging fluxes in CAFs.
(A) Intracellular fluxes (solid black lines) and exosome packaging fluxes (dashed blue lines) in source cells (cancer-associated fibroblasts). Exosome packaging fluxes are reported as mean ± standard deviation (from Monte-Carlo simulations), and have the units [nmol/mg protein/h]. Thickness of lines are proportional to fluxes normalized to the glucose uptake rate. Metabolites with subscripts indicate which compartment they belong to (c: cytosol, m: mitochondria). (B) Comparison of measured and estimated intraexosomal levels for metabolites whose measurements are used for fitting model estimates in the Exo-MFA algorithm. (C) Comparison of measured and estimated intraexosomal level of lactate that is an unkown parameter predicted by Exo-MFA algorithm. Measured data are presented as mean ± SEM (n≥3) from a representative batch of repeated experiments. Model estimates are obtained from best fit solutions. Error bars represent the upper and lower bounds of 95% confidence intervals.
Figure 4:
Figure 4:. 13C-labeled tracer experiments in PDAC to detect cargo-derived metabolites in the tumor cells.
(A) Schematic of 13C-tracer labeling experiments using labeled CDEs. PDAC cells are cultured in glutamine and phenylalanine deprived media along with CDEs. Cells are sampled at 3, 6, 12 and 24 hours to analyzed using GC-MS to measure intracellular mass isotologue distributions and metabolite concentrations. Spent media is sampled at 3, 6, 12 and 24 hours to measure extracellular metabolite concentrations using UPLC. (B) Dynamic measurements of mass isotopologue distribution (MID, %) of amino acids and TCA intermediates in nutrient-deprived PDAC cells treated with exosomes containing labeled metabolites. Data are reported as mean ± SEM, (n≥3) from a batch representative of repeated experiments. (C) Dynamic intracellular levels of central carbon metabolites of nutrient-deprived PDAC cells cultured with or without exosomes. Data are reported as mean ± SEM, (n≥3) from a batch representative of repeated experiments.
Figure 5:
Figure 5:. Exo-MFA predicts intracellular and cargo release flux in PDAC cells internalizing labeled CDEs
(A) Intracellular (solid black lines) and cargo release fluxes (dashed blue lines) in MiaPaCa-2 cells cultured in media deprived of glutamine and phenylalanine, but supplemented with 13C-labeled CDEs. Thickness of lines for each time point are proportional to their respective intracellular fluxes normalized to glucose uptake rate. Colored arrows indicate change in a flux with respect to the previous time-point. (B) Rate of exosome internalization predicted by Exo-MFA. Data reported are obtained from best fit solutions. Error bars represent the upper and lower bounds of 95% confidence intervals.
Figure 6.
Figure 6.
Fractional enrichment of 13C-labeled metabolites in PDAC cells treated with CDEs under nutrient deprivation. Two timelines were established to ascertain utilization of exosomes; both batches of cells were given CDEs at the beginning of the experiment, but one batch was supplemented with additional CDEs at 12h (Exo+supp).

References

    1. Abels ER, Breakefield XO, 2016. Introduction to Extracellular Vesicles: Biogenesis, RNA Cargo Selection, Content, Release, and Uptake. Cell. Mol. Neurobiol 36, 301–312. doi: 10.1007/s10571-016-0366-z - DOI - PMC - PubMed
    1. Antoniewicz MR, Kelleher JK, Stephanopoulos G, 2007. Elementary Metabolite Units (EMU): a novel framework for modeling isotopic distributions. Metab. Eng 9, 68–86. doi: 10.1016/j.ymben.2006.09.001 - DOI - PMC - PubMed
    1. Avila-Elchiver M, Nagrath D, Yarmush ML, 2012. Optimality and thermodynamics determine the evolution of transcriptional regulatory networks. Mol. Biosyst 8, 511–530. doi: 10.1039/c1mb05177f - DOI - PMC - PubMed
    1. Bellance N, Pabst L, Allen G, Rossignol R, Nagrath D, 2012. Oncosecretomics coupled to bioenergetics identifies α-amino adipic acid, isoleucine and GABA as potential biomarkers of cancer: Differential expression of c-Myc, Oct1 and KLF4 coordinates metabolic changes. Biochim. Biophys. Acta 1817, 2060–2071. doi: 10.1016/j.bbabio.2012.07.004 - DOI - PubMed
    1. Bennett BD, Yuan J, Kimball EH, Rabinowitz JD, 2008. Absolute quantitation of intracellular metabolite concentrations by an isotope ratio-based approach. Nat. Protoc 3, 1299–1311. doi: 10.1038/nprot.2008.107 - DOI - PMC - PubMed

Substances

LinkOut - more resources