. 2017 Mar 1:148:77-102.
doi: 10.1016/j.neuroimage.2016.12.064. Epub 2017 Jan 11.

Longitudinal multiple sclerosis lesion segmentation: Resource and challenge

Affiliations

Longitudinal multiple sclerosis lesion segmentation: Resource and challenge

Aaron Carass et al. Neuroimage. .

Abstract

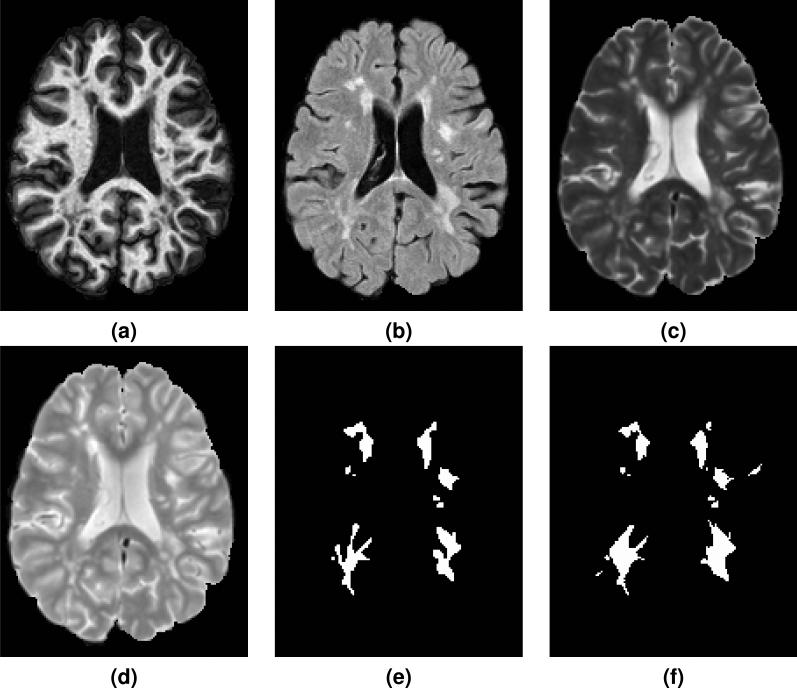
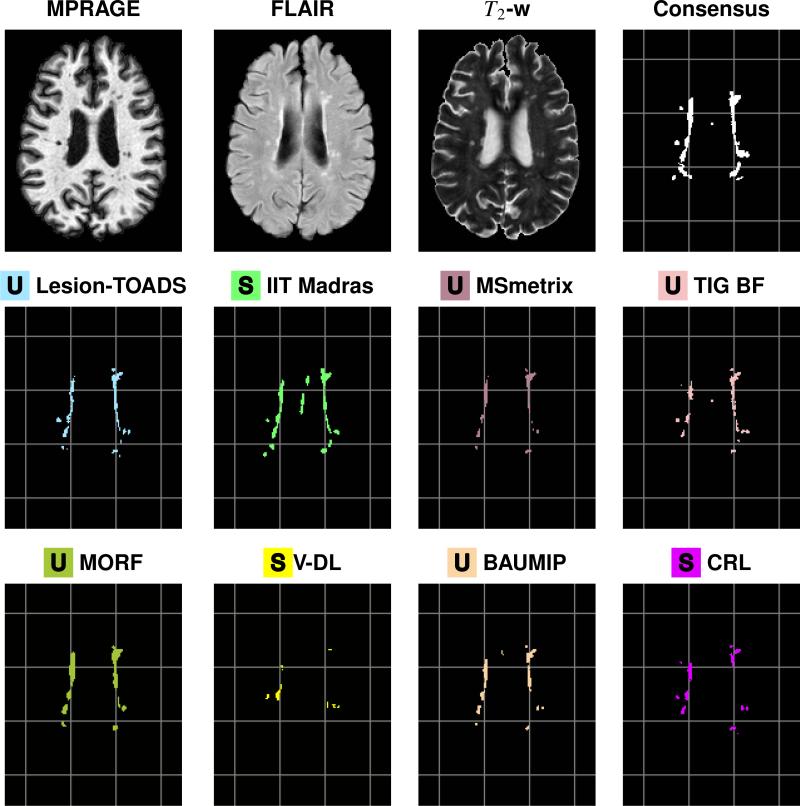
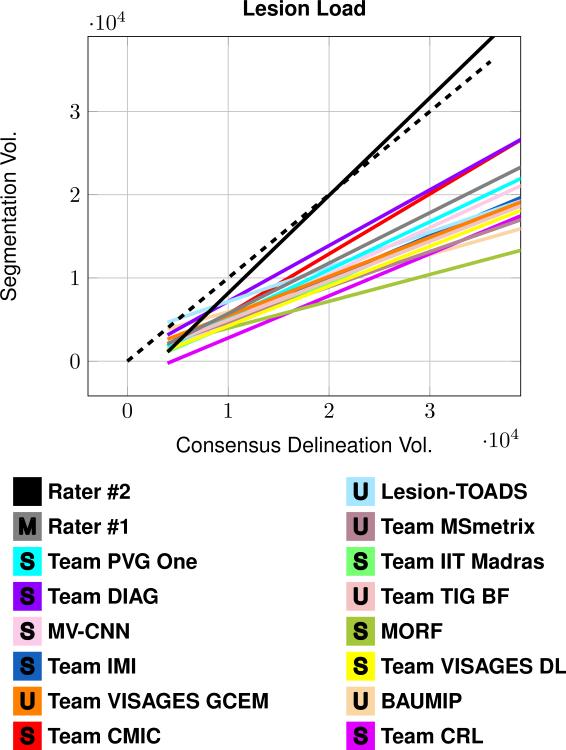
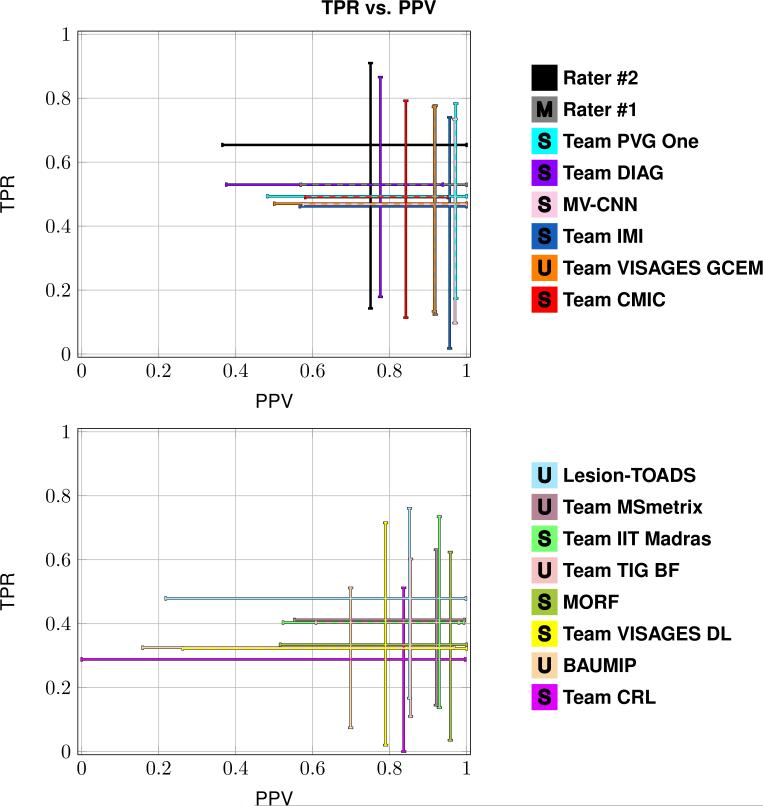
In conjunction with the ISBI 2015 conference, we organized a longitudinal lesion segmentation challenge providing training and test data to registered participants. The training data consisted of five subjects with a mean of 4.4 time-points, and test data of fourteen subjects with a mean of 4.4 time-points. All 82 data sets had the white matter lesions associated with multiple sclerosis delineated by two human expert raters. Eleven teams submitted results using state-of-the-art lesion segmentation algorithms to the challenge, with ten teams presenting their results at the conference. We present a quantitative evaluation comparing the consistency of the two raters as well as exploring the performance of the eleven submitted results in addition to three other lesion segmentation algorithms. The challenge presented three unique opportunities: (1) the sharing of a rich data set; (2) collaboration and comparison of the various avenues of research being pursued in the community; and (3) a review and refinement of the evaluation metrics currently in use. We report on the performance of the challenge participants, as well as the construction and evaluation of a consensus delineation. The image data and manual delineations will continue to be available for download, through an evaluation website2 as a resource for future researchers in the area. This data resource provides a platform to compare existing methods in a fair and consistent manner to each other and multiple manual raters.

Keywords: Magnetic resonance imaging; Multiple sclerosis.


Figures

Figure 1
Figure 1
Shown are the preprocessed (a) MPRAGE, (b) FLAIR, (c) T2-w, and (d) PD-w images for a single time-point from one of the provided Training Set subjects. The corresponding manual delineations by our two raters are shown in (e) for Rater #1 and (f) for Rater #2.
Figure 2
Figure 2
Delineations are shown for a sample slice from the preprocessed MPRAGE, FLAIR, and T2-w images for a time-point of a test data set, followed by our Consensus Delineation and the results for the top eight delineations as ranked by their Dice Score with the Consensus. For ease of reference, a grid has been added underneath the delineations. The bottom eight delineations, as ranked by their Dice Score with the Consensus, can be see in Fig. 3.
Figure 3
Figure 3
Delineations are shown for a sample slice from the preprocessed MPRAGE, FLAIR, and T2-w images for a time-point of a test data set, followed by our Consensus Delineation and the results for the bottom eight delineations as ranked by their Dice Score with the Consensus. For ease of reference, a grid has been added underneath the delineations. The top eight delineations, as ranked by their Dice Score with the Consensus, can be see in Fig. 2.
Figure 4
Figure 4
The plot shows a least squares linear regression fit between the lesion load estimated by each of the Segmentations and that from the Consensus Delineation. The dashed line represents a line of unit slope. All volumes are in mm3.
Figure 5
Figure 5
Each subplot shows the range of values for the true positive rate (TPR) and the positive predictive value (PPV) between eight of the Segmentations and the Consensus Delineation. The top plot shows the top eight Segmentations as ranked by the Dice overlap, and the bottom plot shows the remaining eight Segmentations. The desirable point on each of the subplots is the upper right hand corner, where TPR is 1 and PPV is 1.
Figure 6
Figure 6
Each subplot shows the range of values for the lesion true positive rate (LTPR) and the lesion false positive rate (LFPR) between eight of the Segmentations and the Consensus Delineation. The top plot shows the top eight Segmentations as ranked by the Dice overlap, and the bottom plot shows the remaining eight Segmentations. The desirable point on each of the subplots is the lower right hand corner, where LTPR is 1 and LFPR is 0.

References

    1. Aït-Ali L, Prima S, Heiler P, Carsin B, Edan G, Barillot C. 8th International Conference on Medical Image Computing and Computer Assisted Intervention (MICCAI 2005) Springer Berlin Heidelberg; 2005. STREM: a robust multidimensional parametric method to segment MS lesions in MRI; pp. 409–416. - PubMed
    1. Anbeek P, Vincken KL, van Osch MJP, Bisschops RHC, van der Grond J. Probabilistic segmentation of white matter lesions in MR imaging. NeuroImage. 2004;21:1037–1044. - PubMed
    1. Avants BB, Epstein CL, Grossman M, Gee JC. Symmetric diffeomorphic image registration with cross-correlation: evaluating automated labeling of elderly and neurodegenerative brain. Medical Image Analysis. 2008;12:26–41. - PMC - PubMed
    1. Avants BB, Tustison NJ, Wu J, Cook PA, Gee JC. An open source multivariate framework for n-tissue segmentation with evaluation on public data. Neuroinformatics. 2011;9:381–400. - PMC - PubMed
    1. Bakshi R. Magnetic resonance imaging advances in multiple sclerosis. J. Neuroimaging. 2005;15:5–9. - PubMed

Publication types