. 2017 Mar 1;312(3):H608-H621.
doi: 10.1152/ajpheart.00575.2016. Epub 2017 Jan 13.

Sympathetic modulation of electrical activation in normal and infarcted myocardium: implications for arrhythmogenesis

Affiliations

Sympathetic modulation of electrical activation in normal and infarcted myocardium: implications for arrhythmogenesis

Olujimi A Ajijola et al. Am J Physiol Heart Circ Physiol. .

Abstract

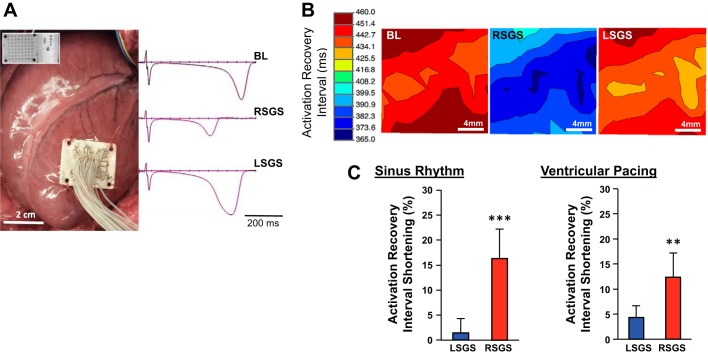
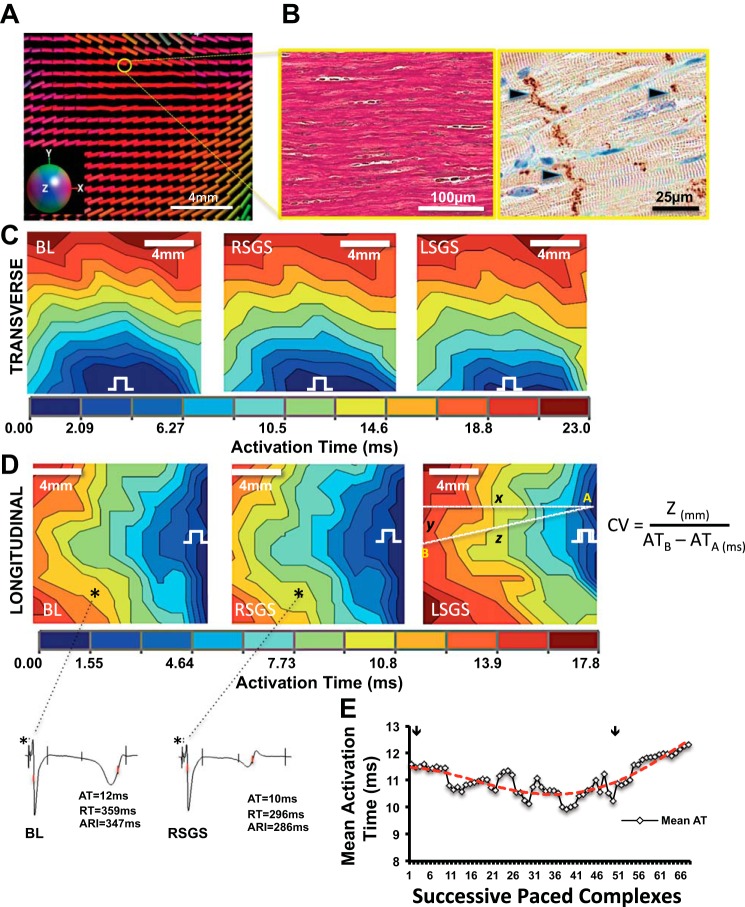
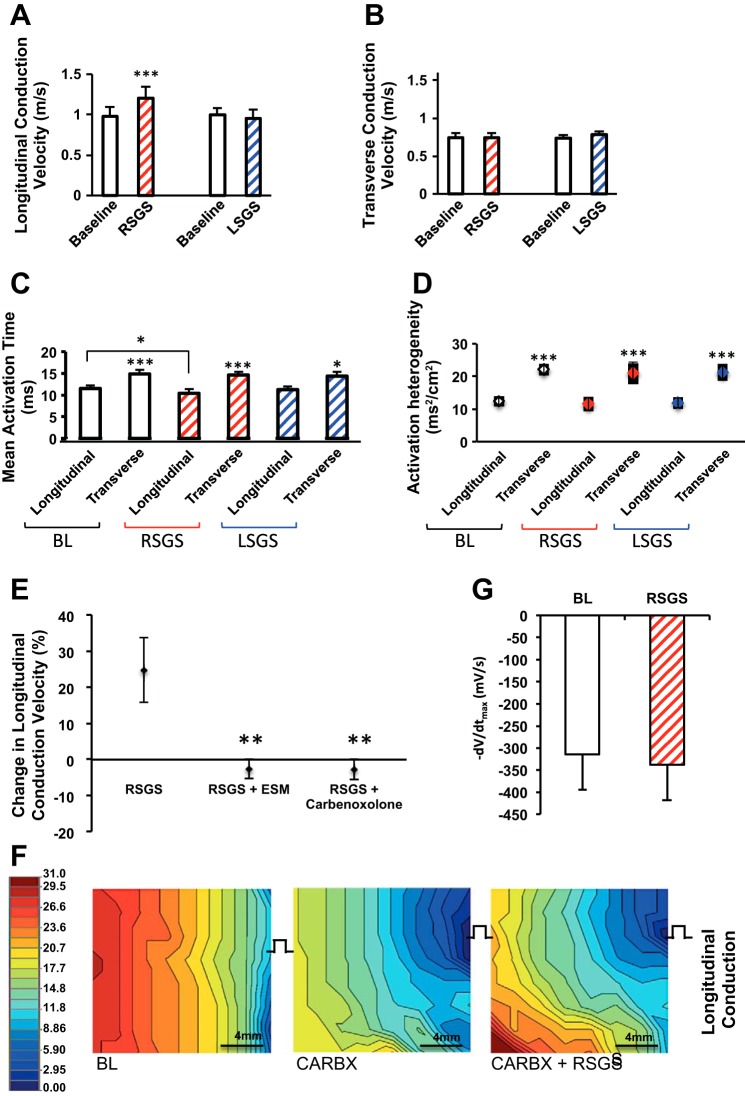
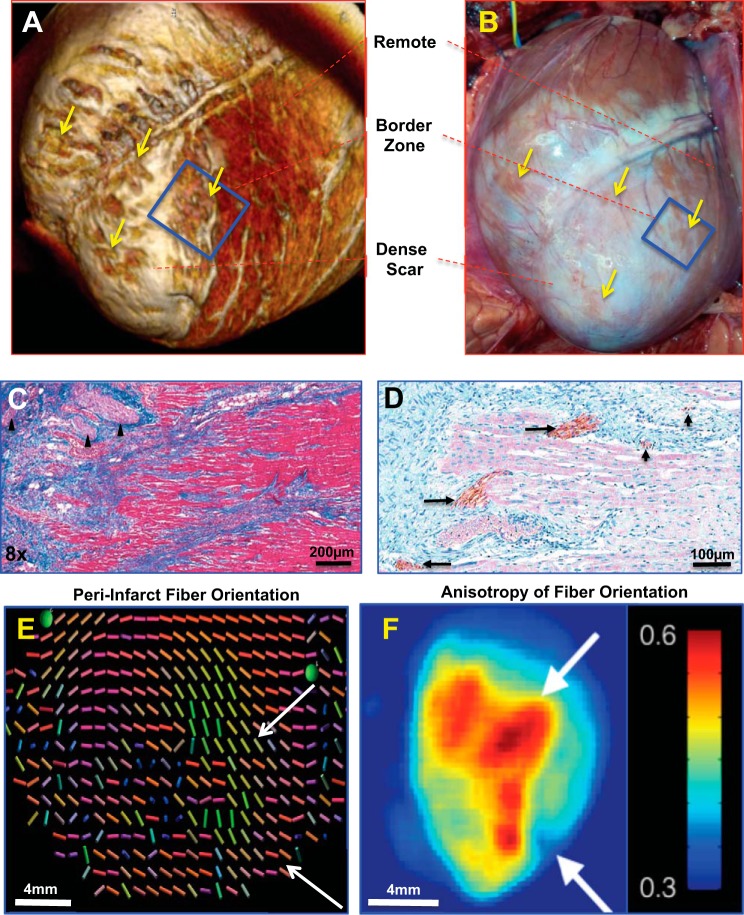
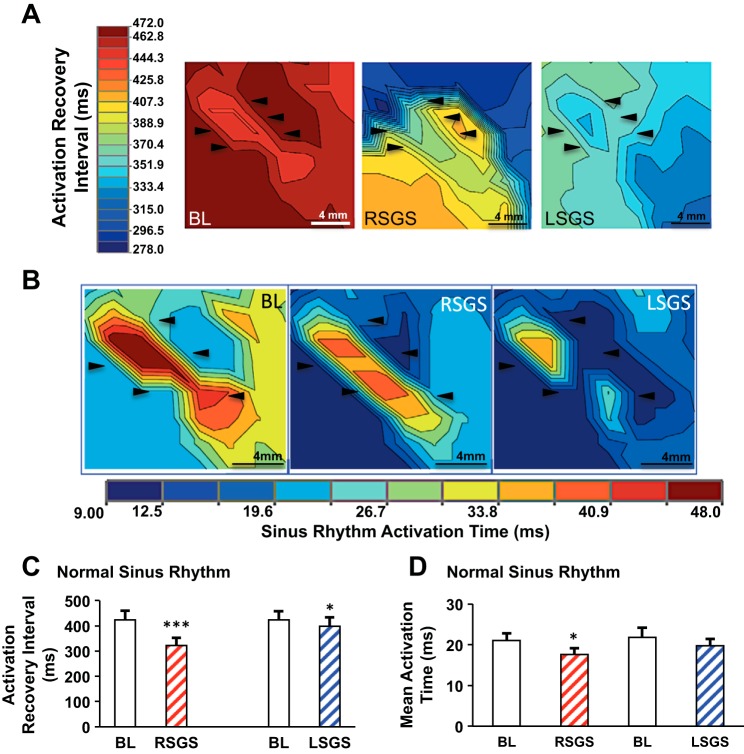
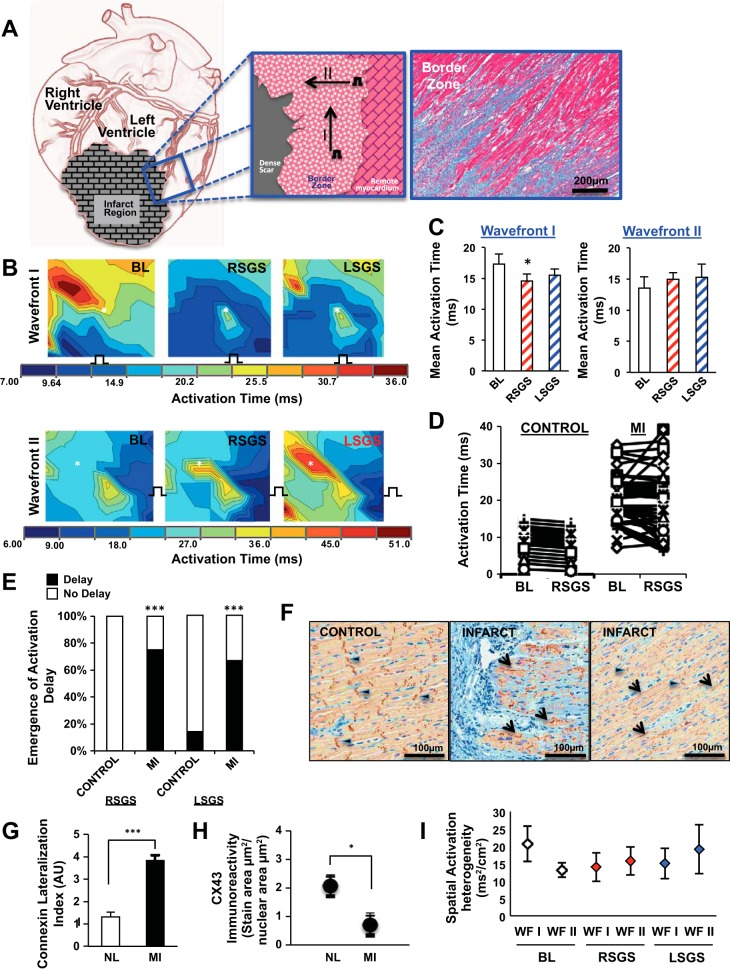
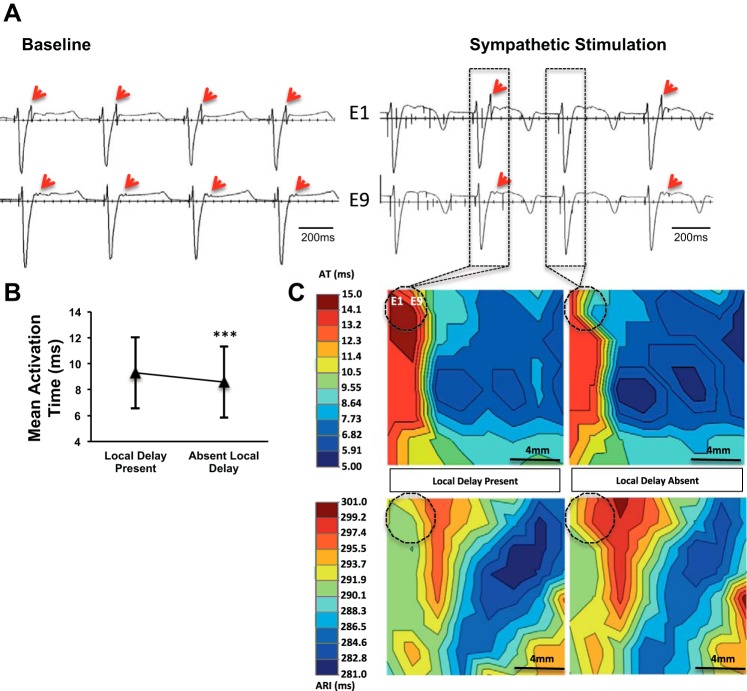
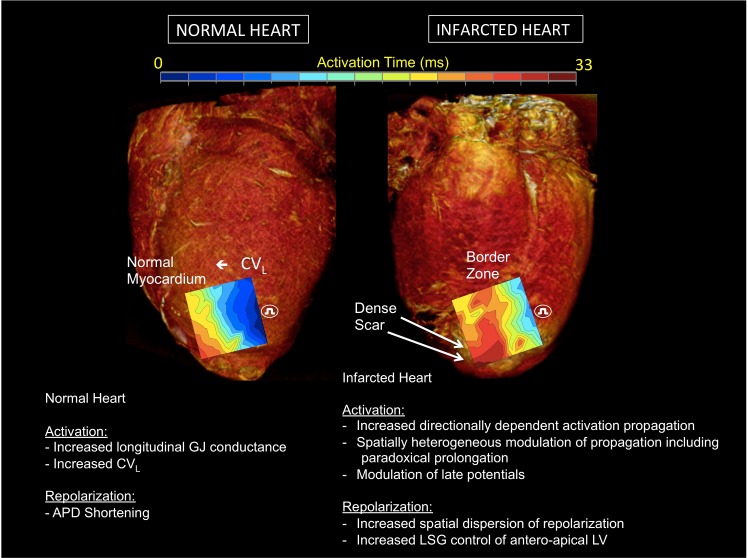
The influence of cardiac sympathetic innervation on electrical activation in normal and chronically infarcted ventricular myocardium is not understood. Yorkshire pigs with normal hearts (NL, n = 12) or anterior myocardial infarction (MI, n = 9) underwent high-resolution mapping of the anteroapical left ventricle at baseline and during left and right stellate ganglion stimulation (LSGS and RSGS, respectively). Conduction velocity (CV), activation times (ATs), and directionality of propagation were measured. Myocardial fiber orientation was determined using diffusion tensor imaging and histology. Longitudinal CV (CVL) was increased by RSGS (0.98 ± 0.11 vs. 1.2 ± 0.14m/s, P < 0.001) but not transverse CV (CVT). This increase was abrogated by β-adrenergic receptor and gap junction (GJ) blockade. Neither CVL nor CVT was increased by LSGS. In the peri-infarct region, both RSGS and LSGS shortened ARIs in sinus rhythm (423 ± 37 vs. 322 ± 30 ms, P < 0.001, and 423 ± 36 vs. 398 ± 36 ms, P = 0.035, respectively) and altered activation patterns in all animals. CV, as estimated by mean ATs, increased in a directionally dependent manner by RSGS (14.6 ± 1.2 vs. 17.3 ± 1.6 ms, P = 0.015), associated with GJ lateralization. RSGS and LSGS inhomogeneously modulated AT and induced relative or absolute functional activation delay in parts of the mapped regions in 75 and 67%, respectively, in MI animals, and in 0 and 15%, respectively, in control animals (P < 0.001 for both). In conclusion, sympathoexcitation increases CV in normal myocardium and modulates activation propagation in peri-infarcted ventricular myocardium. These data demonstrate functional control of arrhythmogenic peri-infarct substrates by sympathetic nerves and in part explain the temporal nature of arrhythmogenesis.NEW & NOTEWORTHY This study demonstrates regional control of conduction velocity in normal hearts by sympathetic nerves. In infarcted hearts, however, not only is modulation of propagation heterogeneous, some regions showed paradoxical conduction slowing. Sympathoexcitation altered propagation in all infarcted hearts studied, and we describe the temporal arrhythmogenic potential of these findings.Listen to this article's corresponding podcast at http://ajpheart.podbean.com/e/sympathetic-nerves-and-cardiac-propagation/.

Keywords: autonomic nervous system; conduction velocity; electrical propagation; sympathetic nerves; ventricular arrhythmias.


Figures

Fig. 1.
Fig. 1.
Influence of left and right sympathetic ganglia on activation recovery intervals in the anterior left ventricle. A: experimental preparation is shown, with the location of the left ventricle mapped. The high-density mapping array is shown in the inset. Representative examples of electrograms recorded at baseline and during left and right stellate ganglion stimulation (LSGS and RSGS, respectively) are also shown. B: representative electrical maps showing of the impact of RSGS and LSGS on activation recovery intervals (ARIs), a surrogate for local action potential duration (APD), are shown. Bl, baseline. C: quantifications of the differential effects of LSGS and RSGS on ARIs in sinus rhythm and during ventricular pacing are shown (n = 8, **P < 0.01, ***P < 0.001, Wilcoxon signed rank test).
Fig. 2.
Fig. 2.
Sympathoexcitation increases conduction velocity in normal hearts: influence of fiber orientation and gap junction distribution. A: representative diffusion tensor magnetic resonance (DT-MRI) image of the region mapped on the left ventricle (LV). The colors correspond to the orientation of the primary eigenvector (“myofiber” long-axis) of the diffusion tensor. The x, y, and z components of the vectors are mapped to red, green and blue, respectively (inset). B: representative examples of fiber orientation (trichrome elastic Von Giesen stain), and gap junction (GJ) distribution (black arrowheads) shown by connexin-43 immunoreactivity in normal myocardium are shown, respectively. C: activation maps showing propagation. transverse and D: longitudinal directions at baseline, and during right and left stellate ganglion stimulation (RSGS and LSGS, respectively). Electrical step symbol indicates pacing site. Electrograms from the sites indicated by the asterisks in D are also shown. E: time course of RSGS on activation propagation (as estimated by activation time) is shown. Arrows indicate the initiation and termination of RSGS.
Fig. 3.
Fig. 3.
Sympathoexcitation and conduction velocity in normal hearts. AD: graphs showing the impact of RSGS and LSGS on longitudinal and transverse conduction velocity (CV), mean activation time, and activation heterogeneity (n = 12, *P < 0.05, ***P < 0.001, Wilcoxon signed rank test). E: graphs showing the impact of esmolol (ESM) and carbenoxolone on change in CV during RSGS (n = 3, **P < 0.01, Wilcoxon signed rank test). F: representative activation maps depicting the effect of carbenoxolone (CARBX) ± RSGS on longitudinal propagation. G: maximal negative slope of activation waveform (−dV/dtmax) of electrograms during pacing at baseline and during RSGS (n = 5, **P = 0.2, Wilcoxon signed rank test).
Fig. 4.
Fig. 4.
Characterization of peri-infarct zones. A: 3D reconstructed magnetic resonance image of the peri-infarct zone. B: photograph of the same heart in A before mapping. The box indicates the regions mapped, while the black arrows indicated surviving islands of myocytes in the peri-infarct region. C: trichrome elastic Von Giesen stain of the peri-infarct region, with nerve bundles indicated by the arrowhead. The linear arrangement of the surviving myocytes can be easily seen. D: tyrosine hydroxylase immunoreactivity highlighting cardiac sympathetic nerves in the scar border is shown. Both large (long arrows) and small (short arrows) nerve bundles can be easily seen. E: diffusion tensor magnetic resonance image showing fiber disarray in the peri-infarct zone (the colors of each vector bar represents 3D orientation of the local myofiber). F: accompanying heat map to E. Scale bar is in arbitrary units of dissimilarity between adjacent fibers as shown in E.
Fig. 5.
Fig. 5.
Sympathetic nerves exert functional control of sinus rhythm activation and repolarization in the peri-infarct zone. Maps depicting a peri-infarct zone and the influence of right and left stellate ganglion stimulation (RSGS and LSGS), respectively, on activation recovery intervals (ARIs), a surrogate for action potential duration (A), and activation in sinus rhythm (B); black arrows in A and B highlight the same region for comparison across conditions. Heart rate (HR) for each map is shown in the top right corner of A; bpm/beats/min. Composite data is shown in C and D. for ARI and mean activation time (n = 7, ***P < 0.001, *P < 0.05, Wilcoxon signed rank test).
Fig. 6.
Fig. 6.
Nonuniform modulation of activation in peri-infarct zones. A: illustration of the wavefronts used to assess propagation in the peri-infarct zone is shown at left and middle, while the fiber arrangement in the a trichrome stain is shown at right. B: the impact of right and left stellate ganglion stimulation (RSGS and LSGS, respectively) on 2 wavefronts is shown. Not only is the mean activation time decreased in wavefront I, the pattern of propagation is also altered. Wavefront II does not show a decrease in mean AT; however, the impact of SGS on propagation patterns can be appreciated, as well as the emergence of regions of relative or absolute delay (asterisk). C: graphical summary of the data for wavefronts I and II are shown. D: representative examples of the nonuniformity and paradoxical increases in peri-infarcted vs. control myocardium. E: graphical summary of the percentage of animal subjects showing relative or absolute delay in response to SGS. F: representative examples of connexin-43 (Cx-43) immunoreacitvity indicating gap junction (GJ) distribution in the regions mapped electrically in control and infarcted animals. Longitudinal (arrowheads) and lateralized (arrows) Cx-43 can be appreciated. Graphical quantifications of Cx-43 lateralization (G) and overall density (H) are shown (n = 7–9, ***P < 0.001, *P < 0.05, Mann-Whitney test). I: spatial activation heterogeneity for wavefronts (WF) I and II at baseline and during RSGS and LSGS.
Fig. 7.
Fig. 7.
SGS can alter propagation in putative ventricular tachycardia circuits. A: electrograms recorded from the peri-infarct region of a subject, depicting a late potential (LP, red arrows) at baseline and during left sympathetic stimulation. B: mean activation time in the region mapped with and without local delay (i.e., LP) (***P < 0.001, Student’s t-test). C: propagation (top row) and activation recovery interval (bottom row) maps with and without local delay (LP). Dashed circle indicated the location of electrodes 1 and 9 (E1 and E9, respectively) recording the LP.
Fig. 8.
Fig. 8.
Cardiac electrical indices during sympathoexcitation in normal and infarcted hearts. A schematic figure illustrating the effects of sympathetic activation on myocardial activation and repolarization in normal hearts, and in the peri-infarcted region of animals with ischemic cardiomyopathy. APD, action potential duration; β, beta; CVL, longitudinal conduction velocity; CVT, transverse conduction velocity; GJ, gap junction; LSG, left stellate ganglion; LV, left ventricle. CV anisotropy = CVL/CVT. Impact of β-adrenergic receptor activation on GJ conductance from de Boer et al. (13).

Comment in

References

    1. Ajijola OA, Wisco JJ, Lambert HW, Mahajan A, Stark E, Fishbein MC, Shivkumar K. Extracardiac neural remodeling in humans with cardiomyopathy. Circ Arrhythm Electrophysiol 5: 1010–1116, 2012. doi:10.1161/CIRCEP.112.972836. - DOI - PMC - PubMed
    1. Ajijola OA, Yagishita D, Patel KJ, Vaseghi M, Zhou W, Yamakawa K, So E, Lux RL, Mahajan A, Shivkumar K. Focal myocardial infarction induces global remodeling of cardiac sympathetic innervation: neural remodeling in a spatial context. Am J Physiol Heart Circ Physiol 305: H1031–H1040, 2013. doi:10.1152/ajpheart.00434.2013. - DOI - PMC - PubMed
    1. Ardell JL, Andresen MC, Armour JA, Billman GE, Chen PS, Foreman RD, Herring N, O’Leary DS, Sabbah HN, Schultz HD, Sunagawa K, Zucker IH. Translational neurocardiology: preclinical models and cardioneural integrative aspects. J Physiol 594: 3877–3909, 2016. doi:10.1113/JP271869. - DOI - PMC - PubMed
    1. Atkinson A, Inada S, Li J, Tellez JO, Yanni J, Sleiman R, Allah EA, Anderson RH, Zhang H, Boyett MR, Dobrzynski H. Anatomical and molecular mapping of the left and right ventricular His-Purkinje conduction networks. J Mol Cell Cardiol 51: 689–701, 2011. doi:10.1016/j.yjmcc.2011.05.020. - DOI - PubMed
    1. Ben-David J, Zipes DP. Differential response to right and left ansae subclaviae stimulation of early afterdepolarizations and ventricular tachycardia induced by cesium in dogs. Circulation 78: 1241–1250, 1988. doi:10.1161/01.CIR.78.5.1241. - DOI - PubMed

MeSH terms

Substances