. 2017 Feb 24;292(8):3481-3495.
doi: 10.1074/jbc.M116.756718. Epub 2017 Jan 13.

Development of High Affinity and High Specificity Inhibitors of Matrix Metalloproteinase 14 through Computational Design and Directed Evolution

Affiliations

Development of High Affinity and High Specificity Inhibitors of Matrix Metalloproteinase 14 through Computational Design and Directed Evolution

Valeria Arkadash et al. J Biol Chem. .

Abstract

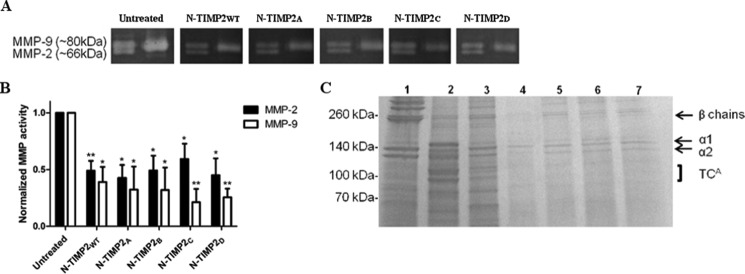
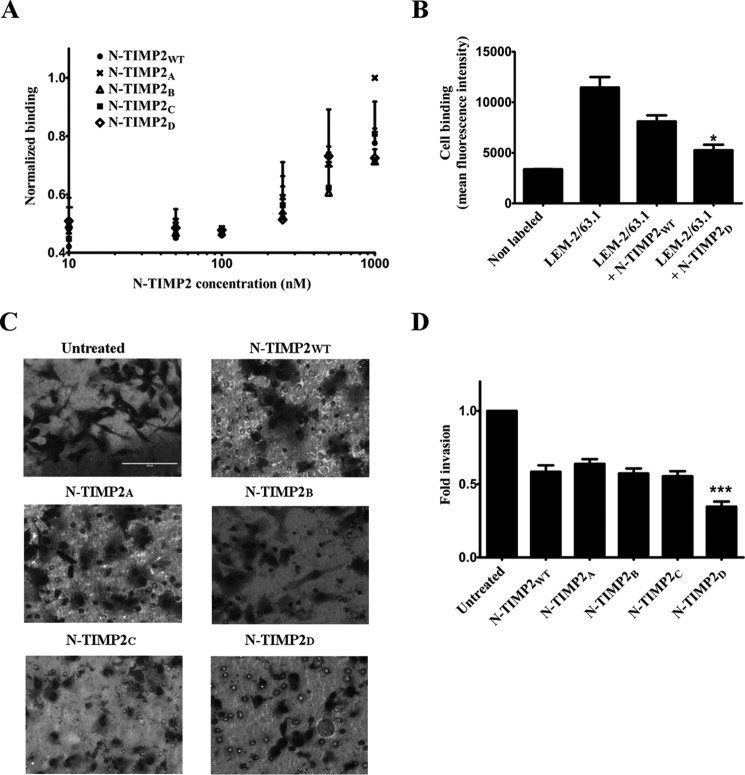
Degradation of the extracellular matrices in the human body is controlled by matrix metalloproteinases (MMPs), a family of more than 20 homologous enzymes. Imbalance in MMP activity can result in many diseases, such as arthritis, cardiovascular diseases, neurological disorders, fibrosis, and cancers. Thus, MMPs present attractive targets for drug design and have been a focus for inhibitor design for as long as 3 decades. Yet, to date, all MMP inhibitors have failed in clinical trials because of their broad activity against numerous MMP family members and the serious side effects of the proposed treatment. In this study, we integrated a computational method and a yeast surface display technique to obtain highly specific inhibitors of MMP-14 by modifying the natural non-specific broad MMP inhibitor protein N-TIMP2 to interact optimally with MMP-14. We identified an N-TIMP2 mutant, with five mutations in its interface, that has an MMP-14 inhibition constant (Ki ) of 0.9 pm, the strongest MMP-14 inhibitor reported so far. Compared with wild-type N-TIMP2, this variant displays ∼900-fold improved affinity toward MMP-14 and up to 16,000-fold greater specificity toward MMP-14 relative to other MMPs. In an in vitro and cell-based model of MMP-dependent breast cancer cellular invasiveness, this N-TIMP2 mutant acted as a functional inhibitor. Thus, our study demonstrates the enormous potential of a combined computational/directed evolution approach to protein engineering. Furthermore, it offers fundamental clues into the molecular basis of MMP regulation by N-TIMP2 and identifies a promising MMP-14 inhibitor as a starting point for the development of protein-based anticancer therapeutics.

Keywords: binding affinity; computational protein design; directed evolution; matrix metalloproteinases; metastasis; protease inhibitor; protein-protein interaction; proteolysis; yeast surface display.


Conflict of interest statement

The authors declare that they have no conflicts of interest with the contents of this article

Figures

FIGURE 1.
FIGURE 1.
Library design. Structure of N-TIMP2 (shown in cyan) in complex with MMP-14CAT (shown in gray) (adapted from Protein Data Bank code 1BUV (28)) with positions that were chosen for full randomization shown as red spheres. Purple sphere represents the Zn2+ atom found in the active site of MMP-14CAT.
FIGURE 2.
FIGURE 2.
Random mutagenesis library screening. A, schematic representation of N-TIMP2WT expressed using the pCTCON construct, with MMP-14CAT as a soluble target (left panel), and flow cytometry analysis of yeast expressing N-TIMP2WT in the pCTCON construct labeled with both 1 μm MMP-14CAT conjugated to DyLight-488 (emission 525 nm) and with mouse anti-c-Myc antibody followed by sheep anti-mouse secondary antibody conjugated to PE (emission 575 nm) for detection of expression (right panel). B, schematic representation of N-TIMP2WT expressed using the pCHA construct, with MMP-14CAT as its soluble target (left panel), and flow cytometry analysis of the yeast expressing N-TIMP2WT in the pCHA construct under the same conditions as the N-TIMP2WT in the pCTCON construct. C, FACS results showing sorting of focused N-TIMP2 libraries. Sort round 1 (S1) represents a sort for protein expression in which the library is labeled only for detection of expression, and a population with a high expression level is selected from the representative gate. In sort round 2 (S2), 1 μm MMP-14CAT conjugated to DyLight-488 was used to select 1.5% (gated pool) of the high affinity population. In Sort 4 (S4) and Sort 6 (S6), 50 and 5 nm, respectively, of MMP-14CAT conjugated to DyLight-488 were used as targets to select the high affinity pool of clones. The x axis shows c-Myc expression, and the y axis shows receptor binding. Polygons indicate sort gates used to select the desired yeast cell population. D, titration curves of the yeast surface displayed N-TIMP2WT and four selected N-TIMP2 clones (N-TIMP2A–D). The yeast cells expressing four different clones and wild-type N-TIMP2 were labeled with MMP-14CAT conjugated to DyLight-488 at a concentration of 1–1000 nm. The binding signal (DyLight-488, emission 525 nm) was normalized to the expression of each clone (PE, emission 575 nm). E, sequences of the N-TIMP2 variants identified after the sixth sort (S6).
FIGURE 3.
FIGURE 3.
Logo summaries of all N-TIMP2 clones sequenced after each selective round of sorting. The height of each letter is proportional to its frequency at that position. The total height of the stack represents conservation at that position. Green, purple, blue, red, and black letters, respectively, represent polar, neutral, basic, acidic, and hydrophobic amino acids. The identity and position numbers of N-TIMP2WT are denoted at the bottom of the figure. To the top left of each logo, numbers S1–S6 represent the sort number. To the right, the average ΔΔGbind value in kcal/mol is shown (see “Experimental Procedures” for calculation details). The logos were generated by the WebLogo sever.
FIGURE 4.
FIGURE 4.
Purification, characterization, and MMP-14 inhibitory activity of N-TIMP2 variants. A, size-exclusion chromatography for clone N-TIMP2B. B, mass spectrometry analysis for clone N-TIMP2B after size-exclusion chromatography. C, SDS-PAGE analysis on 15% polyacrylamide gel under reducing conditions for the purified clones N-TIMP2WT, N-TIMP2A, N-TIMP2B, N-TIMP2C, and N-TIMP2D. D, MMP-14 inhibition by N-TIMP2WT. E, MMP-14 inhibition by N-TIMP2 variants. D and E, MMP-14CAT was incubated with N-TIMP2WT and N-TIMP2 variants at various concentrations. The substrate Mca-Lys-Pro-Leu-Gly-Leu-Dpa-Ala-Arg-NH2 was added, and the fluorescent signal upon substrate cleavage by MMP-14CAT was measured. The slopes (cleavage velocities) at each inhibitor concentration were measured, and the curves were fitted by the Morrison equation (Equation 1) to obtain the Ki values.
FIGURE 5.
FIGURE 5.
SPR measurements of MMP-14CAT and N-TIMP2 variants interactions. A, N-TIMP2WT; B, N-TIMP2A; C, N-TIMP2B; D, N-TIMP2C; E, N-TIMP2D. The binding response (y axis) was measured for MMP-14CAT at different concentrations, 20 nm (blue), 10 nm (green), 5 nm (purple), 2.5 nm (yellow), and 0 nm (red).
FIGURE 6.
FIGURE 6.
Inhibition of gelatin and collagen degradation by N-TIMP2 variants. A, representative gelatin zymography of 1 nm MMP-2 and MMP-9 full-length proteins resolved on SDS-PAGE and treated with 100 nm N-TIMP2 inhibitors. Left lane of each gel represents pro-MMP2 (upper) and active MMP-2 (lower), and the right lane represents active MMP-9. B, quantification of band intensity normalized to the intensity of the control (untreated) gel. The average values for the percentage of inhibition for MMP2 are as follows: N-TIMP2WT, 51%; N-TIMP2A, 57%; N-TIMP2B, 51%; N-TIMP2C, 41%; N-TIMP2D, 55%; and for MMP9 as follows: N-TIMP2WT, 61%; N-TIMP2A, 68%; N-TIMP2B, 68%; N-TIMP2C, 79%; N-TIMP2D, 74%. Error bars represent S.E. Statistical analysis was performed by Student's t test compared with untreated control *, p < 0.05; **, p < 0.01 n = 3. C, representative degradation products of bovine type I collagen. Collagen (1.5 μg) was incubated with (lane 2) or without (lane 1) 2.2 μg of MMP-14CAT, or with 2.2 μg of MMP-14CAT along with 2.5 μm of inhibitors (N-TIMP2WT, N-TIMP2A, N-TIMP2B, N-TIMP2C, and N-TIMP2D, lanes 3–7, respectively). The labels α1 and α2 indicate the α1(I) and α2(I) chains of type I collagen, and the β chains indicate the cross-link between two α1 chains or between α1 chain and α2 chain. The ¾ cleavage product of type I collagen by MMP-14CAT is indicated as TCA (¾) fragment. Note the reduction in collagen degradation in the presence of the N-TIMP2 variants.
FIGURE 7.
FIGURE 7.
Binding of N-TIMP2 variants to MDA-MB-231 cells and inhibition of cancer cell invasion. A, binding of the N-TIMP2 inhibitors, conjugated to DyLight-488 fluorescent dye, to the cells. B, binding of LEM-2/63.1 anti-MMP-14 antibody in the absence and presence of N-TIMP2 inhibitors. *, p < 0.05 for t test comparisons of the indicated condition versus LEM-2/63.1 binding. C, representative micrographs of invading MDA-MB-231 cells treated with 7.5 nm N-TIMP2 inhibitors; the cells were stained with Dipp Kwik Differential Stain and visualized as dark forms on light background by light microscopy using ×40 magnification lenses. D, calculated fold of invasion. The experiment was repeated three times; means and standard error are given. ***, p < 0.001 for t test comparisons of the indicated condition versus N-TIMP2WT.
FIGURE 8.
FIGURE 8.
Structural analysis of MMP-14 affinity enhancing mutations. Computationally modeled interactions of mutations that are common after the 6th round of selection for enhancement of affinity of binding of N-TIMP2 for MMP-14. N-TIMP2 is shown in cyan, and MMP-14 is shown in green. A, interactions at position 4 of N-TIMP2; B, interactions at positions 68 and 71 of N-TIMP2; C, interactions at positions 97 and 99 of N-TIMP2. Residues involved in an interaction are shown in stick representation. Mutant residue identities are labeled in red, and WT identities of residues in all panels are labeled in black. Polar interactions are shown as dotted red lines.

References

    1. Brinckerhoff C. E., and Matrisian L. M. (2002) Matrix metalloproteinases: a tail of a frog that became a prince. Nat. Rev. Mol. Cell Biol. 3, 207–214 - PubMed
    1. Vandenbroucke R. E., and Libert C. (2014) Is there new hope for therapeutic matrix metalloproteinase inhibition? Nat. Rev. Drug Discov. 13, 904–927 - PubMed
    1. Seiki M. (1999) Membrane-type matrix metalloproteinases. APMIS 107, 137–143 - PubMed
    1. Dollery C. M., and Libby P. (2006) Atherosclerosis and proteinase activation. Cardiovasc. Res. 69, 625–635 - PubMed
    1. Ra H. J., and Parks W. C. (2007) Control of matrix metalloproteinase catalytic activity. Matrix Biol. 26, 587–596 - PMC - PubMed

Publication types

MeSH terms

Substances

Associated data