. 2016 Dec 15;30(24):2669-2683.
doi: 10.1101/gad.291021.116.

PDX1 dynamically regulates pancreatic ductal adenocarcinoma initiation and maintenance

Affiliations

PDX1 dynamically regulates pancreatic ductal adenocarcinoma initiation and maintenance

Nilotpal Roy et al. Genes Dev. .

Abstract

Aberrant activation of embryonic signaling pathways is frequent in pancreatic ductal adenocarcinoma (PDA), making developmental regulators therapeutically attractive. Here we demonstrate diverse functions for pancreatic and duodenal homeobox 1 (PDX1), a transcription factor indispensable for pancreas development, in the progression from normal exocrine cells to metastatic PDA. We identify a critical role for PDX1 in maintaining acinar cell identity, thus resisting the formation of pancreatic intraepithelial neoplasia (PanIN)-derived PDA. Upon neoplastic transformation, the role of PDX1 changes from tumor-suppressive to oncogenic. Interestingly, subsets of malignant cells lose PDX1 expression while undergoing epithelial-to-mesenchymal transition (EMT), and PDX1 loss is associated with poor outcome. This stage-specific functionality arises from profound shifts in PDX1 chromatin occupancy from acinar cells to PDA. In summary, we report distinct roles of PDX1 at different stages of PDA, suggesting that therapeutic approaches against this potential target need to account for its changing functions at different stages of carcinogenesis. These findings provide insight into the complexity of PDA pathogenesis and advocate a rigorous investigation of therapeutically tractable targets at distinct phases of PDA development and progression.

Keywords: EMT; dedifferentiation; pancreatic cancer; pancreatitis.


Figures

Figure 1.
Figure 1.
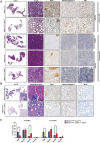
Pdx1 loss accelerates inflammation and oncogene-induced ductal metaplasia. (A) Acinar cells lacking Pdx1 undergo more rapid and extensive dedifferentiation. Eight-week-old to 12-wk-old Ptf1aCreERTM/+ and Ptf1aCreERTM/+;Pdx1f/f mice were treated with tamoxifen. Three days following tamoxifen administration, animals were treated with saline or cerulein for 7 d and allowed to recover for 1 or 7 d. Representative H&E stainings at the indicated time points are shown. PDX1 immunohistochemistry was performed to confirm efficient Pdx1 ablation. Immunohistochemistry for cleaved caspase 3 and Ki67 measured apoptosis and cell proliferation, respectively. (B) Eight-week-old to 12-wk-old Ptf1aCreERTM/+;KrasLSL-G12D/+ and Ptf1aCreERTM/+;KrasLSL-G12D/+;Pdx1f/f mice were treated with tamoxifen and euthanized 6 wk later. Two hours prior to euthanasia, mice were injected intraperitoneally with BrdU. Representative H&E staining is shown. Alcian blue staining highlights the mucinous region, whereas PDX1 immunohistochemistry demonstrates efficient Pdx1 deletion. Immunohistochemistry for cleaved caspase 3 and BrdU measured apoptosis and cell proliferation, respectively. (C) Ductal lesions (ADM and PanIN 1–3) were counted and graded in 10 10× fields from three pancreata of each genotype and time point. Samples were blinded. Shown are the percentages of specific grades compared with the total counted.
Figure 2.
Figure 2.
PDX1 regulates distinct sets of genes in acinar cells undergoing ADM. (AD) Acinar cells were isolated from tamoxifen-treated Ptf1aCreERTM/+ (n = 3) and Ptf1aCreERTM/+;Pdx1f/f (n = 3) mice. Cells were treated with TGFα to induce in vitro ADM. At days 0, 1, 2, and 3, cells were harvested, and whole-genome transcriptome profiling was done by RNA-seq. The graphs at the left show differentially expressed genes between Pdx1 wild-type and Pdx1-null acinar cells at each time point. The tables at the right show pathway analyses of genes differentially regulated at least ±1.5-fold. The top 10 pathways from each data set are shown along with their respective P-values. Pathways of interest are color-coded, and genes that belong to those pathways are listed. Green indicates genes down-regulated in Pdx1-null cells, and red indicates up-regulated genes in Pdx1-null cells. (E, left) Quantitative PCR analysis of Pdx1 in mouse PDA-derived cell lines transfected with control or Pdx1 siRNA. (Right) Relative survival of cells following siRNA-mediated Pdx1 knockdown in mouse PDA-derived cell lines. (F, top) Quantitative PCR analysis of PDX1 in human PDA-derived cell lines transfected with control or PDX1 siRNA. (Bottom) Relative survival of cells following siRNA-mediated PDX1 knockdown in human PDA-derived tumor cell lines.
Figure 3.
Figure 3.
PDX1 maintains tumorigenicity of human PDA cells in vivo. (A) Relative cell proliferation of the indicated human PDA-derived cell lines at 1, 3, and 5 d following transfection with control or PDX1 siRNA. (B) Relative caspase 3/7 activity of the indicated human PDA-derived cell lines 24 h after transfection with control or PDX1 siRNA. (C) Relative survival of cells in three dimensions following siRNA-mediated PDX1 knockdown in human PDA-derived tumor cell lines. HPAF-II (D) and Panc.8 (E) cells expressing either control shRNA or shRNA targeting PDX1 were subcutaneously injected into NSG mice, and tumor growth was measured. Mice were sacrificed 4 wk after inoculation, and tumor sizes were measured. (F) H&E and costaining of Ki67, cleaved caspase 3, and DAPI of tumors obtained in D and E. Quantification of Ki67-positive cells (G) and the cleaved caspase 3-positive area (H) of tumors obtained in D and E.
Figure 4.
Figure 4.
PDX1 maintains a transcriptional landscape conducive to oncogenic Kras signaling. (A) GSEA of RNA-seq data from Supplemental Figure S5A. Genes differentially expressed at least ±1.5-fold between control siRNA and PDX1 siRNA-treated cells were compared with gene set-defining oncogenic signatures. (B) Kras signature enrichment plots in human PDA-derived cell lines transfected with control or PDX1 siRNA. (C) Cell cycle and apoptosis signature enrichment plots in human PDA-derived cell lines transfected with control or PDX1 siRNA-treated cells. Quantitative PCR analysis of AURKA (D), TNFRSF10B (E), and DIABLO (F) in human PDA-derived cell lines transfected with control or PDX1 siRNA.
Figure 5.
Figure 5.
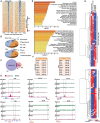
PDX1 dynamically switches its function between acinar cells and PDA. (A) PDX1 ChIP-seq was performed on acinar cells isolated from wild-type mice and the mouse PDA cell line NB-490. The heat map shows enrichment of PDX1 binding in acinar and PDA cells. (B) PDX1 ChIP-peak distribution across different genomic regions in primary acinar cells or PDA cells (NB490). (C) Overlap in PDX1-bound regions between acinar and PDA cells. (D) ChIP-seq signal tracks of PDX1 on the indicated genes in acinar and PDA cells. (E) Functional categories of PDX1 putative target genes by using pathway enrichment analysis. The list shows the top 20 pathways enriched in PDX1 ChIP-seq targets in acinar (top) and PDA (bottom) cells (F) Sequence motifs identified by motif analysis of PDX1-bound regions in acinar and PDA cells. (G) Heat map showing relative expression of genes bound by PDX1 in either acinar cells (top) or PDA cells (bottom) in four different cells types: wild-type acinar cells, Pdx1-null acinar cells, wild-type mouse PDA cells, and PDA cells expressing shRNA against Pdx1.
Figure 6.
Figure 6.
Low PDX1 expression predicts poor PDA prognosis. Expression of transcription factors regulating pancreatic organogenesis (A) and PDX1 (B) in four different pancreatic cancer subtypes based on the study by Bailey et al. (2016). (C) Representative PDX1 staining in human PDA with low (panel i), intermediate (panel ii), and high (panel iii) PDX1 expression in infiltrating tumors. Normal ducts in panel i and islets in panel ii stained positive for PDX1. (D) Kaplan-Meier survival curve of PDA patients with low or high PDX1 RNA expression. n = 183. (E) Representative staining for PDX1/cytokeratin 19 in Ptf1aCre/+;KrasLSL-G12D/+;Trp53f/+ mouse pancreata showing variable expression (high [panel i] and low [panel ii]) of PDX1 in mouse tumor tissues. Solid arrowheads indicate regions that have reduced PDX1 expression.
Figure 7.
Figure 7.
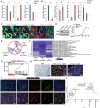
PDX1 loss is associated with EMT. (A) Quantitative PCR analysis of E-cadherin, Vimentin, and PDX1 expression in HPAF-II cells treated with either vehicle or HGF. (B) Quantitative PCR analysis of E-cadherin, Vimentin, Snail1, and PDX1 expression in Panc.1 cells treated with either vehicle or TGFβ. (C) Fluorescent images of lineage-labeled cells derived from pancreatic epithelium of Ptf1aCre/+;KrasLSL-G12D/+;Trp53f/+;Rosa26LSL-YFP animals. Staining shows that epithelial cells that have undergone EMT (YFP-positive/Vimentin-positive) have lost PDX1 expression. (D) Mouse PDA cells (NB490 sh1) were cultured and passaged with continual dox treatment for 3 wk to select for cells resistant to Pdx1 knockdown (“grow out”). Western blot analysis of PDX1 and HSP90 from “grow out” cells treated with dox and NB490 sh1 cells left untreated (control) or treated with dox for 48 h (2-d dox). Growth curves of NB 490 sh1 cells left untreated (control) or treated with dox and “grow out” cells treated with dox. (E) Overlap among differentially expressed genes (1.5-fold up or down) in control, knockdown, and “grow out” cells. Purple curves link identical genes. The inner circle represents gene lists, where hits are arranged along the arc. Genes shared by multiple lists are colored dark orange, and genes unique to a list are shown in light orange. (F) Heat map of enriched terms across differentially expressed genes (1.5-fold up or down) in the indicated groups, colored by P-value. (G) MYC-binding signature enrichment plots in knockdown versus “grow out” cells. The plot shows the enrichment of MYC-binding targets in “grow out” cells. (H) Immunofluorescence staining from a Ptf1aCre/+;KrasLSL-G12D/+;Trp53f/+ mouse showing colocalization of MYC and PDX1 in PanIN. (I) Immunofluorescence staining of a well-differentiated tumor from an 11-wk-old PDX1-Cre;KrasLSL-G12D/+;Trp53R172H/+ mouse (top panels) and a poorly differentiated invasive tumor from a 28-wk-old PDX1-Cre;KrasLSL-G12D/+;Trp53R172H/+;Rosa26LSL-YFP mouse (bottom panels). Yellow arrows highlight YFP-positive tumor cells, while yellow arrowheads highlight YFP-negative stromal cells. (J) Model depicting PDX1 functions at different stages of pancreatic cancer tumorigenesis. At early stages, PDX1 maintains acinar identity and inhibits Kras-driven acinar dedifferentiation. In the later malignant stage, PDX1 maintains tumorigenicity of cells by supporting cell proliferation and inhibiting apoptosis. During metastasis, malignant cells lose PDX1 expression to undergo EMT.

Similar articles

Cited by

References

    1. Aguirre AJ, Bardeesy N, Sinha M, Lopez L, Tuveson DA, Horner J, Redston MS, DePinho RA. 2003. Activated Kras and Ink4a/Arf deficiency cooperate to produce metastatic pancreatic ductal adenocarcinoma. Genes Dev 17: 3112–3126. - PMC - PubMed
    1. Ahlgren U, Jonsson J, Jonsson L, Simu K, Edlund H. 1998. β-Cell-specific inactivation of the mouse Ipf1/Pdx1 gene results in loss of the β-cell phenotype and maturity onset diabetes. Genes Dev 12: 1763–1768. - PMC - PubMed
    1. Bailey P, Chang DK, Nones K, Johns AL, Patch A-M, Gingras M-C, Miller DK, Christ AN, Bruxner TJC, Quinn MC, et al. 2016. Genomic analyses identify molecular subtypes of pancreatic cancer. Nature 531: 47–52. - PubMed
    1. Chen L, Yan H-X, Chen J, Yang W, Liu Q, Zhai B, Cao H-F, Liu S-Q, Wu M-C, Wang H-Y. 2007. Negative regulation of c-Myc transcription by pancreas duodenum homeobox-1. Endocrinology 148: 2168–2180. - PubMed
    1. Collisson EA, Sadanandam A, Olson P, Gibb WJ, Truitt M, Gu S, Cooc J, Weinkle J, Kim GE, Jakkula L, et al. 2011. Subtypes of pancreatic ductal adenocarcinoma and their differing responses to therapy. Nat Med 17: 500–503. - PMC - PubMed

Publication types

MeSH terms

Substances