. 2017 Apr 1;34(4):843-856.
doi: 10.1093/molbev/msw284.

No Evidence for Phylostratigraphic Bias Impacting Inferences on Patterns of Gene Emergence and Evolution

Affiliations

No Evidence for Phylostratigraphic Bias Impacting Inferences on Patterns of Gene Emergence and Evolution

Tomislav Domazet-Lošo et al. Mol Biol Evol. .

Abstract

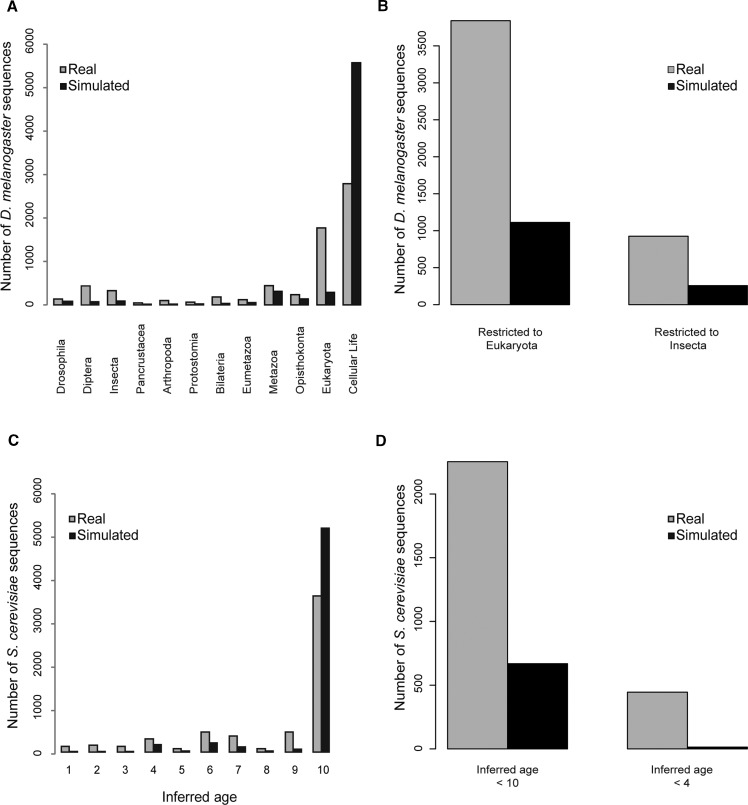
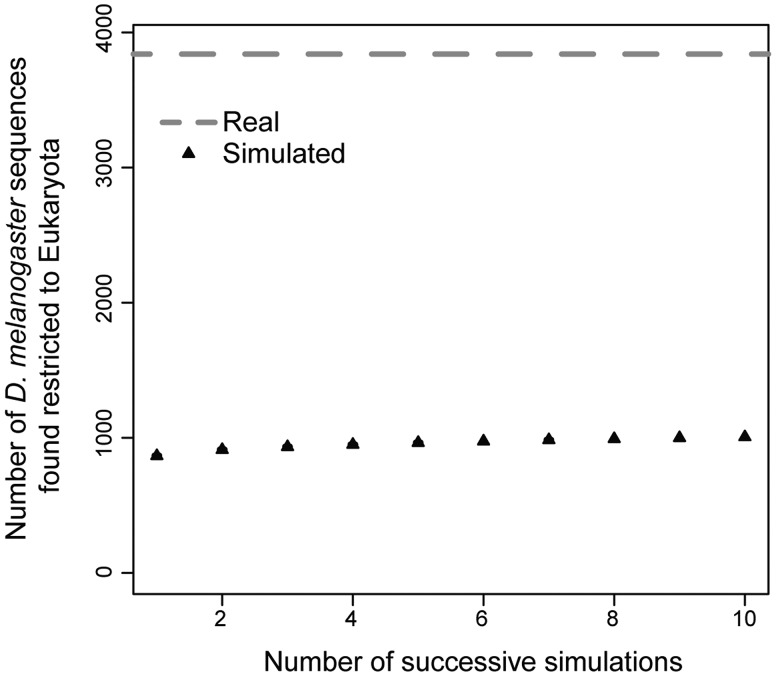
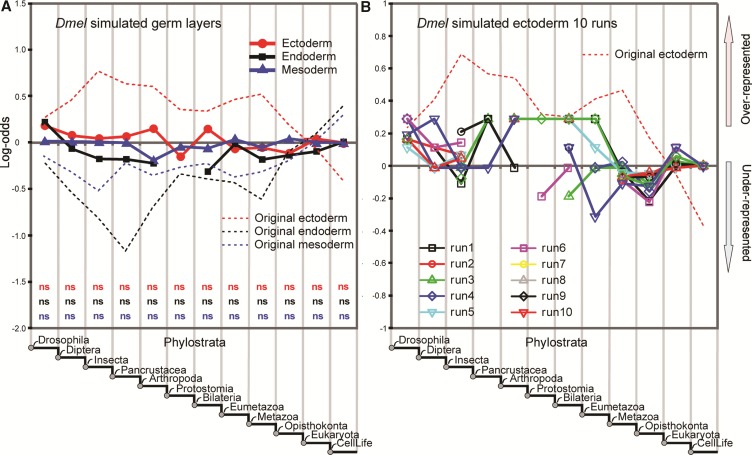
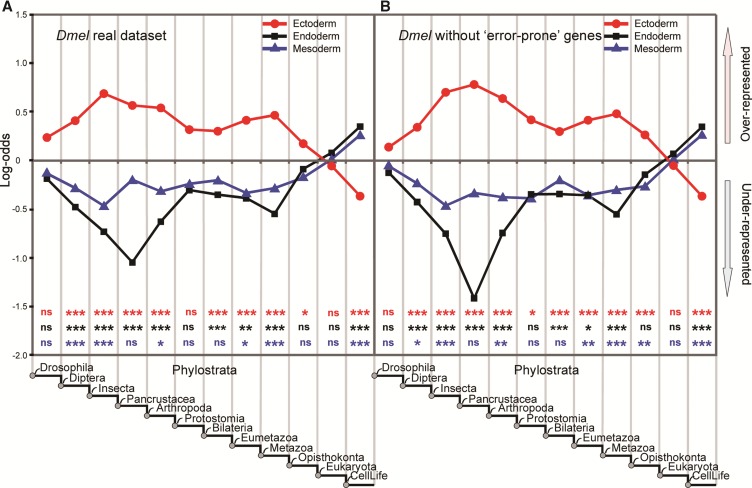
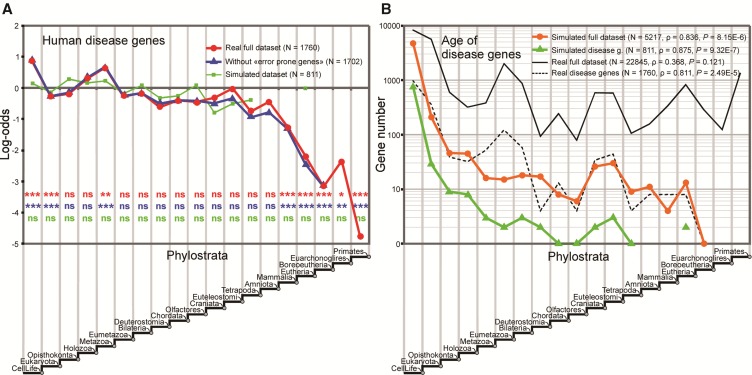
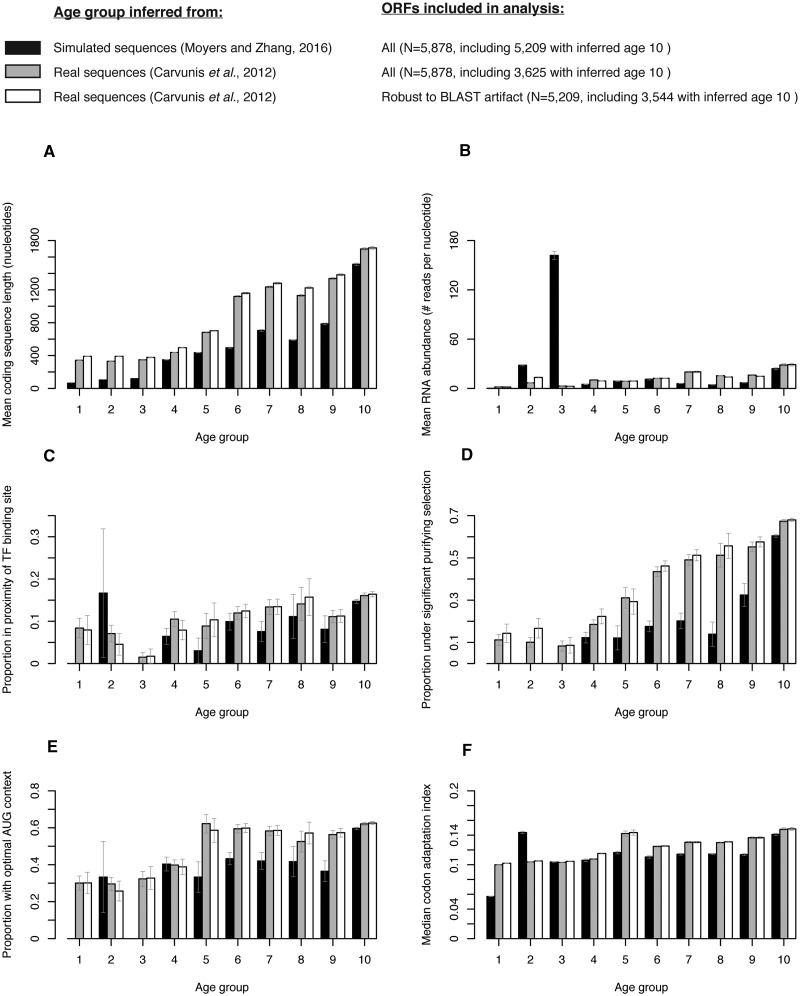
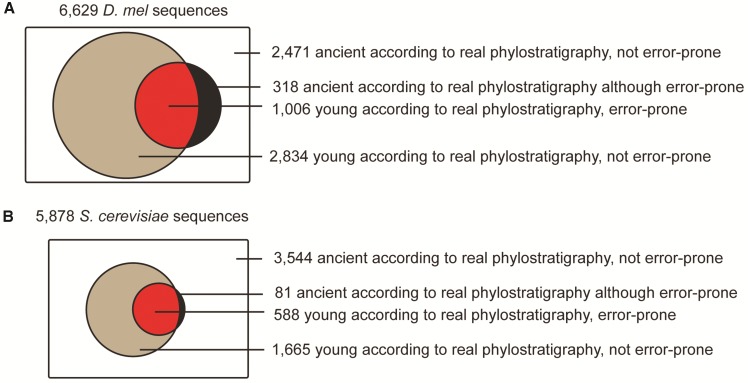
Phylostratigraphy is a computational framework for dating the emergence of DNA and protein sequences in a phylogeny. It has been extensively applied to make inferences on patterns of genome evolution, including patterns of disease gene evolution, ontogeny and de novo gene origination. Phylostratigraphy typically relies on BLAST searches along a species tree, but new simulation studies have raised concerns about the ability of BLAST to detect remote homologues and its impact on phylostratigraphic inferences. Here, we re-assessed these simulations. We found that, even with a possible overall BLAST false negative rate between 11-15%, the large majority of sequences assigned to a recent evolutionary origin by phylostratigraphy is unaffected by technical concerns about BLAST. Where the results of the simulations did cast doubt on previously reported findings, we repeated the original analyses but now excluded all questionable sequences. The originally described patterns remained essentially unchanged. These new analyses strongly support phylostratigraphic inferences, including: genes that emerged after the origin of eukaryotes are more likely to be expressed in the ectoderm than in the endoderm or mesoderm in Drosophila, and the de novo emergence of protein-coding genes from non-genic sequences occurs through proto-gene intermediates in yeast. We conclude that BLAST is an appropriate and sufficiently sensitive tool in phylostratigraphic analysis that does not appear to introduce significant biases into evolutionary pattern inferences.

Keywords: BLAST; gene age estimation; genome analysis; phylostratigraphy.


Figures

F<sc>ig</sc>. 1.
Fig. 1.
The majority of phylostratigraphy-based young age assignments cannot be attributed to BLAST limitations for D. melanogaster or S. cerevisiae. (A) Phylostratigraphic assignments for the subset of D. melanogaster sequences chosen by Moyers and Zhang (2015) using real and simulated sequences. (B) Bar graph comparing the number of D. melanogaster sequences found young by phylostratigraphy using real and simulated sequences, when young is restricted to Eukaryota, or to the youngest three phylostrata (Drosophila, Diptera, Insecta). (C) Distribution is redrawn from Figure 1B in Moyers and Zhang (2016a), using a linear scale, rather than a log scale. Numbers indicate groups of S. cerevisiae ORFs of increasing conservation level within the Ascomycota, from S. cerevisiae-specific (1) to conserved in S. pombe (10). (D) Bar graph comparing the number of S. cerevisiae sequences found young by phylostratigraphy using real and simulated sequences, when young is considered to include all yeast species used for analyses except for S. pombe (inferred age < 10), or to the youngest three phylostrata (inferred age < 4). Note that the simulated results for D. melanogaster sequences represent the average number of sequences assigned to each phylostrata over ten runs.
F<sc>ig</sc>. 2.
Fig. 2.
Saturation analysis of D. melanogaster genes that are found error-prone by Moyers and Zhang’s simulations (2015) (black triangles). Gray dashed line marks 3,840 sequences found restricted to Eukaryota in the real phylostratigraphy (Figure 1B). The average of 15 random permutations of 10 successive simulations is shown; standard errors of the mean are not shown because they are shorter than the height of the triangles.
F<sc>ig</sc>. 3.
Fig. 3.
Phylostratigraphic analyses of gene expressions in fruit fly germ layers are not attributable to false negatives in BLAST. (A) Overrepresentation profiles averaged over 10 simulated datasets reported by Moyers and Zhang (2015) in their figure 3c. None of the deviations is significant by hypergeometric test (ns) with Bonferroni correction. For comparison real phylostratigraphy profiles for germ layers are shown (dashed lines). (B) Overrepresentation profiles in ectoderm for 10 replicated simulations. Note the instability of profiles across the replicates and number of phylostrata without any expressed genes. None of the deviations at any phylostrata is significant by hypergeometric tests (ns). For comparison real phylostratigraphic profile for ectoderm are shown (dashed lines).
F<sc>ig</sc>. 4.
Fig. 4.
Updated phylostratigraphic analyses of gene expression in fruit fly germ layers from Domazet-Lošo et al. 2007. (A) Real phylostratigraphic map using the latest sequence and expression databases. (B) Real phylostratigraphic map after the removal of genes that are found error-prone by Moyers and Zhang (2015). Note that the profiles remain largely unaffected. Stars represent significances after hypergeometric test with Bonferroni correction (* at 0.05 level, ** at 0.01 level and *** at 0.001 level).
F<sc>ig</sc>. 5.
Fig. 5.
Repeated phylostratigraphic analyses of disease genes in humans from Domazet-Lošo and Tautz (2008). (A) Real phylostratigraphic map after the removal of genes that are found error-prone by Moyers and Zhang (2015). Note that the profiles remain largely unchanged. The profile of Moyers and Zhang (2015) simulated dataset (green line) is completely non-significant. Stars represent significances after hypergeometric test with Bonferroni correction (* at 0.05 level, ** at 0.01 level and *** at 0.001 level). (B) Reanalyses of correlation patterns in Moyers and Zhang simulated data. The correlation coefficients (Spearman’s rho) and associated P-values between gene count and ranked evolutionary time are in brackets. Note that the total set of simulated genes as well as simulated disease genes negatively correlate with evolutionary time.
F<sc>ig</sc>. 6.
Fig. 6.
Distribution of six biological features for 5,878 S. cerevisiae ORF sequences with age inferred from real data (grey), for the same 5,878 ORF sequences with age inferred in simulations (black) and for 5,209 ORF sequences shown to be robust to potential BLAST artifact because they are assigned to the oldest age group in the simulation, with age inferred from real data (white). Vertical error bars represent standard error of the mean (A and B), standard error of the proportion (C, D and E) or standard error of the median (F).
F<sc>ig</sc>. 7.
Fig. 7.
Pie charts representing sequences in the real phylostratigraphy and their relation to the sequences found error-prone in the Moyers and Zhang simulations for D. melanogaster (A) and S. cerevisiae (B). The majority of sequences found young in real data are robust to BLAST artifact (grey). Some sequences are found ancient in the real data but not in the simulated data (black), indicating that the phylostratigraphic methods used in the real data were more sensitive than those used on the simulated data. The only sequences whose phylostratum may be have been underestimated due to BLAST errors are in red. For Drosophila, a conservative approach was taken where we counted as susceptible to BLAST artifact all sequences found young in at least one of ten simulation runs. For yeast, a single run was performed and analyzed. Note that the proportion of sequences found young is larger in Drosophila (A) than in yeast (B) because the species tree considered is much deeper.

References

    1. Abrusán G. 2013. Integration of new genes into cellular networks, and their structural maturation. Genetics 195:1407–1417. - PMC - PubMed
    1. Albà MM, Castresana J.. 2005. Inverse relationship between evolutionary rate and age of mammalian genes. Mol Biol Evol. 22:598–606. - PubMed
    1. Albà MM, Castresana J.. 2007. On homology searches by protein Blast and the characterization of the age of genes. BMC Evol Biol. 7:53.. - PMC - PubMed
    1. Altschul SF, Gish W, Miller W, Myers EW, Lipman DJ.. 1990. Basic local alignment search tool. J Mol Biol. 215:403–410. - PubMed
    1. Altschul SF, Madden TL, Schäffer AA, Zhang J, Zhang Z, Miller W, Lipman DJ.. 1997. Gapped BLAST and PSI-BLAST: a new generation of protein database search programs. Nucl Acids Res. 25:3389–3402. - PMC - PubMed

Publication types

LinkOut - more resources