

Application of a Bayesian dominance model improves power in quantitative trait genome-wide association analysis
- PMID: 28088170
- PMCID: PMC5237573
- DOI: 10.1186/s12711-017-0284-7
Application of a Bayesian dominance model improves power in quantitative trait genome-wide association analysis
Abstract
Background: Multi-marker methods, which fit all markers simultaneously, were originally tailored for genomic selection purposes, but have proven to be useful also in association analyses, especially the so-called BayesC Bayesian methods. In a recent study, BayesD extended BayesC towards accounting for dominance effects and improved prediction accuracy and persistence in genomic selection. The current study investigated the power and precision of BayesC and BayesD in genome-wide association studies by means of stochastic simulations and applied these methods to a dairy cattle dataset.
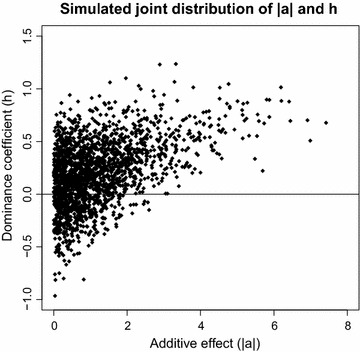
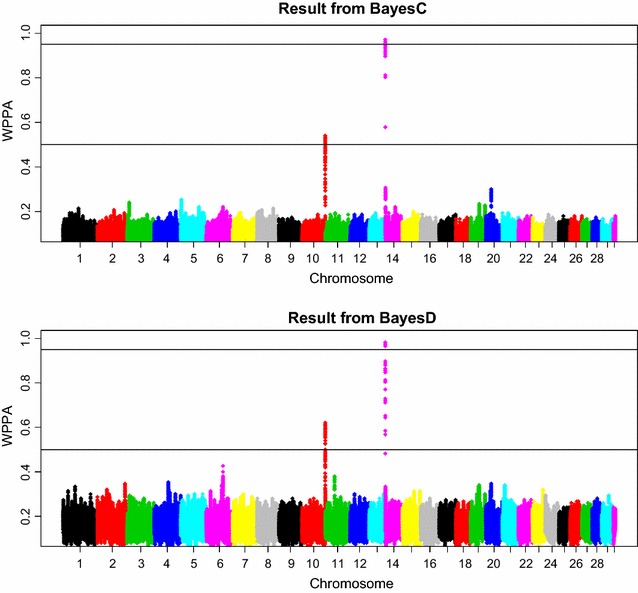
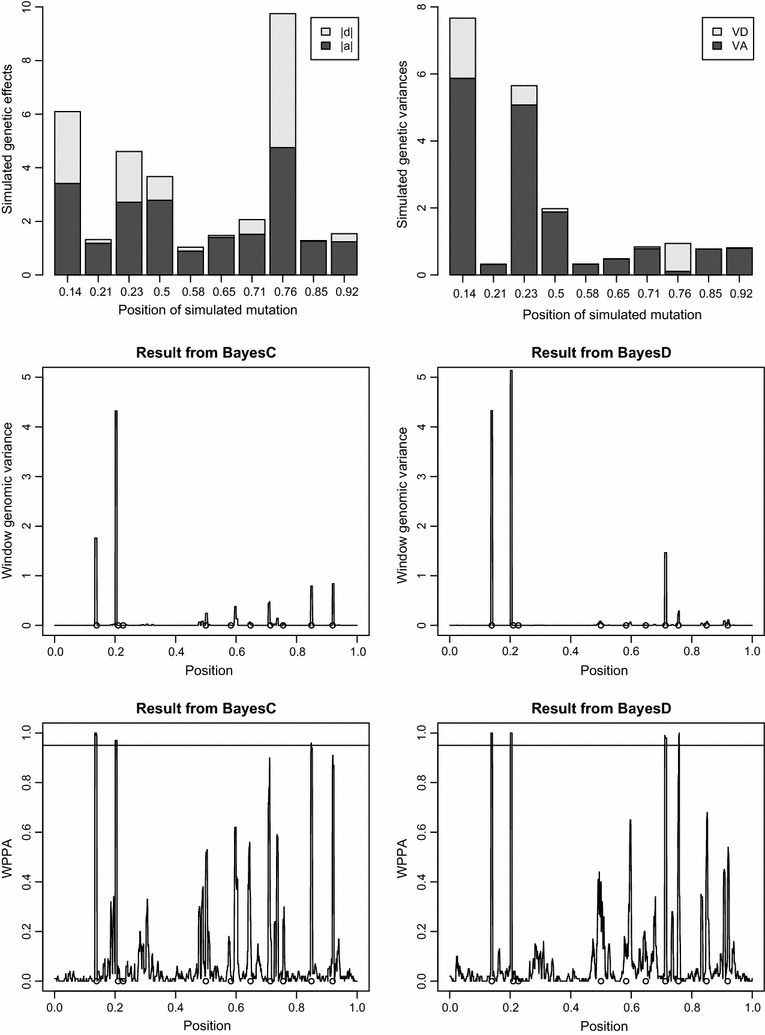
Methods: The simulation protocol was designed to mimic the genetic architecture of quantitative traits as realistically as possible. Special emphasis was put on the joint distribution of the additive and dominance effects of causative mutations. Additive marker effects were estimated by BayesC and additive and dominance effects by BayesD. The dependencies between additive and dominance effects were modelled in BayesD by choosing appropriate priors. A sliding-window approach was used. For each window, the R. Fernando window posterior probability of association was calculated and this was used for inference purpose. The power to map segregating causal effects and the mapping precision were assessed for various marker densities up to full sequence information and various window sizes.
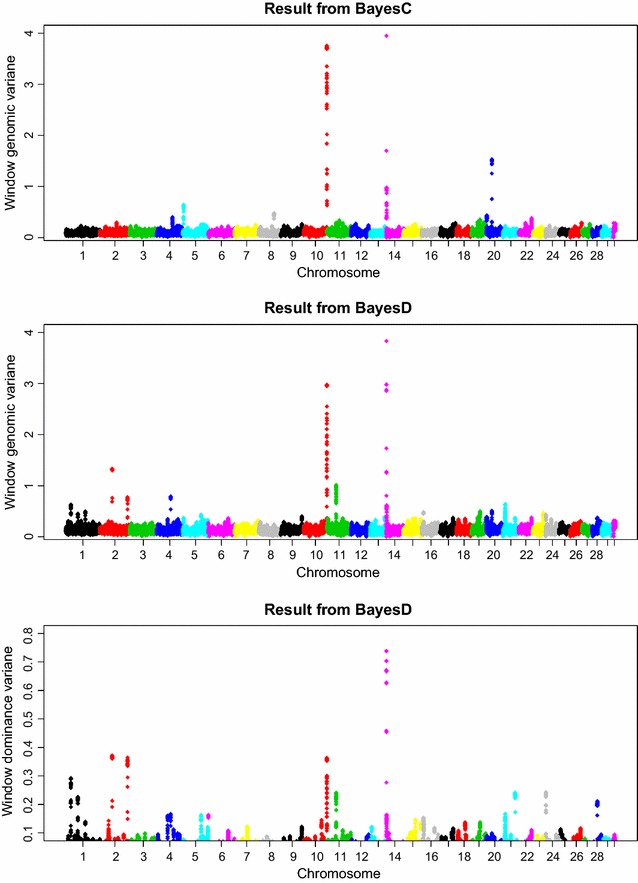
Results: Power to map a QTL increased with higher marker densities and larger window sizes. This held true for both methods. Method BayesD had improved power compared to BayesC. The increase in power was between -2 and 8% for causative genes that explained more than 2.5% of the genetic variance. In addition, inspection of the estimates of genomic window dominance variance allowed for inference about the magnitude of dominance at significant associations, which remains hidden in BayesC analysis. Mapping precision was not substantially improved by BayesD.
Conclusions: BayesD improved power, but precision only slightly. Application of BayesD needs large datasets with genotypes and own performance records as phenotypes. Given the current efforts to establish cow reference populations in dairy cattle genomic selection schemes, such datasets are expected to be soon available, which will enable the application of BayesD for association mapping and genomic prediction purposes.
Figures
Similar articles
-
Bayesian models with dominance effects for genomic evaluation of quantitative traits.Genet Res (Camb). 2012 Feb;94(1):21-37. doi: 10.1017/S0016672312000018. Genet Res (Camb). 2012. PMID: 22353246
-
A Bayesian random regression method using mixture priors for genome-enabled analysis of time-series high-throughput phenotyping data.Plant Genome. 2022 Sep;15(3):e20228. doi: 10.1002/tpg2.20228. Epub 2022 Jul 29. Plant Genome. 2022. PMID: 35904052
-
Interpretable artificial neural networks incorporating Bayesian alphabet models for genome-wide prediction and association studies.G3 (Bethesda). 2021 Sep 27;11(10):jkab228. doi: 10.1093/g3journal/jkab228. G3 (Bethesda). 2021. PMID: 34499126 Free PMC article.
-
Application of Bayesian genomic prediction methods to genome-wide association analyses.Genet Sel Evol. 2022 May 13;54(1):31. doi: 10.1186/s12711-022-00724-8. Genet Sel Evol. 2022. PMID: 35562659 Free PMC article. Review.
-
Understanding and predicting complex traits: knowledge from cattle.Hum Mol Genet. 2012 Oct 15;21(R1):R45-51. doi: 10.1093/hmg/dds332. Epub 2012 Aug 16. Hum Mol Genet. 2012. PMID: 22899652 Review.
Cited by
-
Non-additive Effects in Genomic Selection.Front Genet. 2018 Mar 6;9:78. doi: 10.3389/fgene.2018.00078. eCollection 2018. Front Genet. 2018. PMID: 29559995 Free PMC article. Review.
-
Genomic Model with Correlation Between Additive and Dominance Effects.Genetics. 2018 Jul;209(3):711-723. doi: 10.1534/genetics.118.301015. Epub 2018 May 9. Genetics. 2018. PMID: 29743175 Free PMC article.
-
Benefits of Dominance over Additive Models for the Estimation of Average Effects in the Presence of Dominance.G3 (Bethesda). 2017 Oct 5;7(10):3405-3414. doi: 10.1534/g3.117.300113. G3 (Bethesda). 2017. PMID: 28842396 Free PMC article.
-
An approximate Bayesian significance test for genomic evaluations.Biom J. 2018 Nov;60(6):1096-1109. doi: 10.1002/bimj.201700219. Epub 2018 Aug 12. Biom J. 2018. PMID: 30101421 Free PMC article.
-
Heterogeneity of variance and genetic parameters for milk production in cattle, using Bayesian inference.PLoS One. 2023 Jul 12;18(7):e0288257. doi: 10.1371/journal.pone.0288257. eCollection 2023. PLoS One. 2023. PMID: 37437036 Free PMC article.
References
-
- Yang J, Ferreira T, Morris AP, Medland SE, Genetic Investigation of Anthropometric Traits (GIANT) Consortium, DIAbetes Genetics Replication And Meta-analysis (DIAGRAM) Consortium et al. Conditional and joint multiple-SNP analysis of GWAS summary statistics identifies additional variants influencing complex traits. Nat Genet. 2012;44:369–375. doi: 10.1038/ng.2213. - DOI - PMC - PubMed
-
- Fernando RL, Garrick D. Bayesian methods applied to GWAS. In: Gondro C, van der Werf J, Hayes B, editors. Genome-wide association studies and genomic prediction. Methods in molecular biology, Springer protocols. New York: Springer Press; 2013. - PubMed
MeSH terms
Substances
LinkOut - more resources
Full Text Sources
Other Literature Sources
