. 2017 Jan 14;18(1):22.
doi: 10.1186/s12882-016-0434-0.

Total kidney and liver volume is a major risk factor for malnutrition in ambulatory patients with autosomal dominant polycystic kidney disease

Affiliations

Total kidney and liver volume is a major risk factor for malnutrition in ambulatory patients with autosomal dominant polycystic kidney disease

Hyunjin Ryu et al. BMC Nephrol. .

Abstract

Background: In patients with autosomal dominant polycystic kidney disease (ADPKD), malnutrition may develop as renal function declines and the abdominal organs become enlarged. We investigated the relationship of intra-abdominal mass with nutritional status.

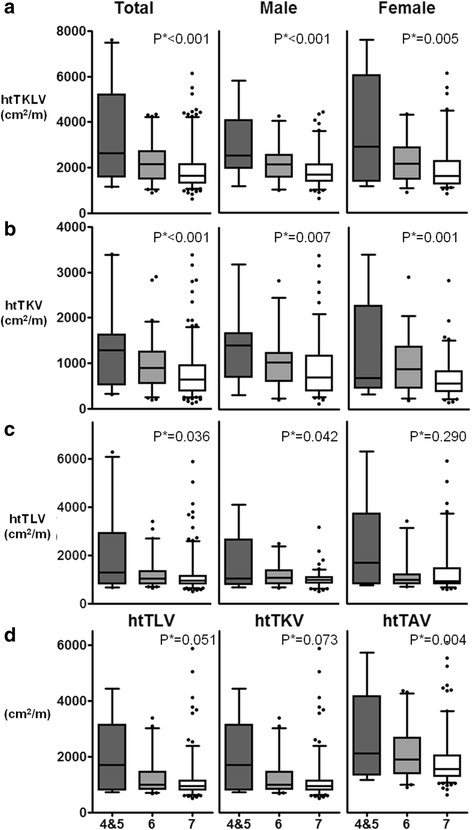
Methods: This cross-sectional study was performed at a tertiary hospital outpatient clinic. Anthropometric and laboratory data including serum creatinine, albumin, and cholesterol were collected, and kidney and liver volumes were measured. Total kidney and liver volume was defined as the sum of the kidney and liver volumes and adjusted by height (htTKLV). Nutritional status was evaluated by using modified subjective global assessment (SGA).

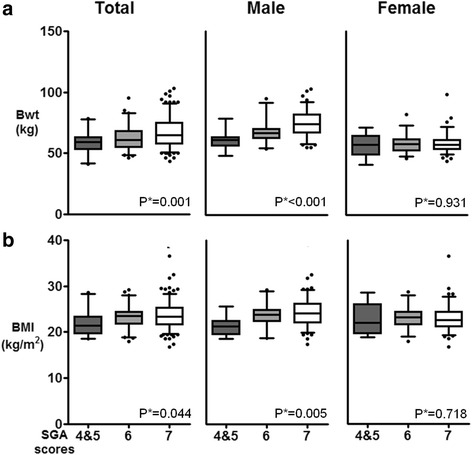
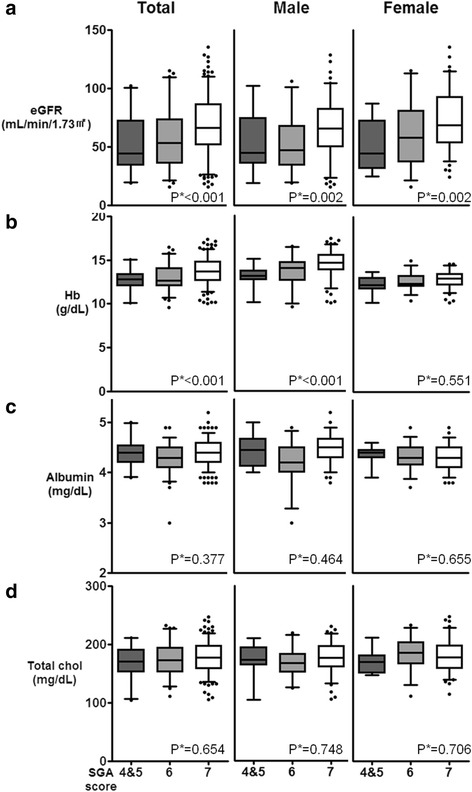
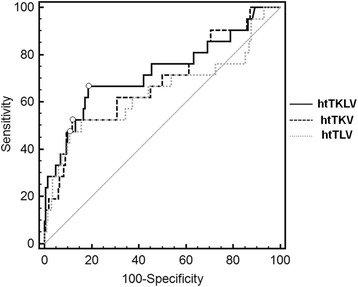
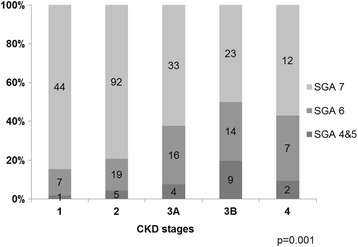
Results: In a total of 288 patients (47.9% female), the mean age was 48.3 ± 12.2 years and the mean estimated glomerular filtration rate (eGFR) was 65.3 ± 25.3 mL/min/1.73 m2. Of these patients, 21 (7.3%) were mildly to moderately malnourished (SGA score of 4 and 5) and 63 (21.7%) were at risk of malnutrition (SGA score of 6). Overall, patients with or at risk of malnutrition were older, had a lower body mass index, lower hemoglobin levels, and poorer renal function compared to the well-nourished group. However, statistically significant differences in these parameters were not observed in female patients, except for eGFR. In contrast, a higher htTKLV correlated with a lower SGA score, even in subjects with an eGFR ≥45 mL/min/1.73 m2. Subjects with an htTKLV ≥2340 mL/m showed an 8.7-fold higher risk of malnutrition, after adjusting for age, hemoglobin, and eGFR.

Conclusions: Nutritional risk was detected in 30% of ambulatory ADPKD patients with relatively good renal function. Intra-abdominal organomegaly was related to nutritional status independently from renal function deterioration.

Keywords: Autosomal-dominant polycystic kidney disease; Chronic kidney disease; Gender; Malnutrition; Polycystic liver disease.


Figures

Fig. 1
Fig. 1
Correlations between the SGA score and the anthropometric nutritional parameters. a body weight (Bwt) and b body mass index (BMI). P*; p for trend, SGA; subjective global assessment, SGA 7, well-nourished; SGA 6, at risk; SGA 5, mildly malnourished; SGA 3–4, moderately malnourished
Fig. 2
Fig. 2
Correlations between the SGA score and the following laboratory markers. a estimated glomerular filtration rate (eGFR), b hemoglobin (Hb), c albumin, and d total cholesterol (total chol). P*; p for trend, SGA; subjective global assessment, SGA 7, well-nourished; SGA 6, at risk; SGA 5, mildly malnourished; SGA 3–4, moderately malnourished
Fig. 3
Fig. 3
Correlations between the SGA score and abdominal volume. a height-adjusted total kidney and liver volume (htTKLV), b height-adjusted total kidney volume (htTKV), and c height-adjusted total liver volume (htTLV); d correlation between SGA score and abdominal volume in subjects with an eGFR ≥45 mL/min/1.73 m2. P*; p for trend, SGA; subjective global assessment, SGA 7, well-nourished; SGA 6, at risk; SGA 5, mildly malnourished; SGA 3–4, moderately malnourished
Fig. 4
Fig. 4
ROC curve of htTKLV, comparing SGA scores of 4 and 5 to 7. ROC; receiver-operating characteristics, SGA; subjective global assessment, SGA 7, well-nourished; SGA 6, at risk; SGA 5, mildly malnourished; SGA 3–4, moderately malnourished
Fig. 5
Fig. 5
SGA score distribution according to CKD stages. P-values were obtained using the Fisher’s exact test. Bars indicate the percentage of patients in each category. CKD; chronic kidney disease, SGA; subjective global assessment

References

    1. Correia MI, Waitzberg DL. The impact of malnutrition on morbidity, mortality, length of hospital stay and costs evaluated through a multivariate model analysis. Clin Nutr. 2003;22:235–239. doi: 10.1016/S0261-5614(02)00215-7. - DOI - PubMed
    1. Campbell KL, Ash S, Bauer J, Davies PSW. Critical review of nutrition assessment tools to measure malnutrition in chronic kidney disease. Nutr Diet. 2007;64:23–30. doi: 10.1111/j.1747-0080.2007.00116.x. - DOI - PubMed
    1. Fouque D, Guebre-Egziabher F. An update on nutrition in chronic kidney disease. Int Urol Nephrol. 2007;39:239–246. doi: 10.1007/s11255-006-9108-3. - DOI - PubMed
    1. Lowrie EG, Huang WH, Lew NL. Death risk predictors among peritoneal dialysis and hemodialysis patients: a preliminary comparison. Am J Kidney Dis. 1995;26:220–228. doi: 10.1016/0272-6386(95)90177-9. - DOI - PubMed
    1. Leavey SF, Strawderman RL, Jones CA, Port FK, Held PJ. Simple nutritional indicators as independent predictors of mortality in hemodialysis patients. Am J Kidney Dis. 1998;31:997–1006. doi: 10.1053/ajkd.1998.v31.pm9631845. - DOI - PubMed

Publication types

MeSH terms