. 2017 Apr:100:75-86.
doi: 10.1016/j.nbd.2017.01.003. Epub 2017 Jan 12.

Pharmacological rescue of adult hippocampal neurogenesis in a mouse model of X-linked intellectual disability

Affiliations

Pharmacological rescue of adult hippocampal neurogenesis in a mouse model of X-linked intellectual disability

Manuela Allegra et al. Neurobiol Dis. 2017 Apr.

Abstract

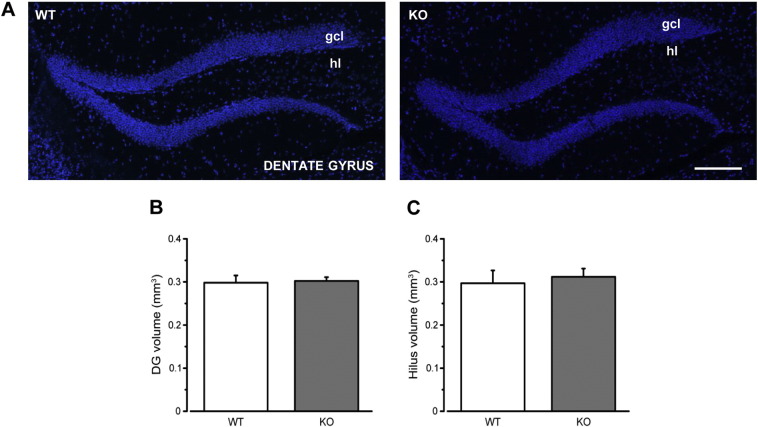
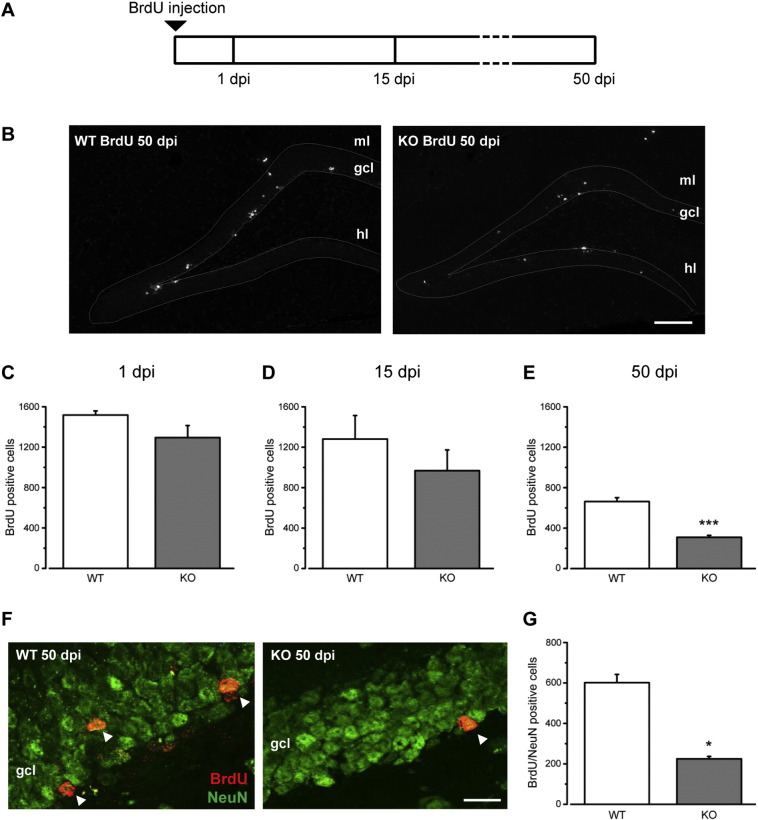
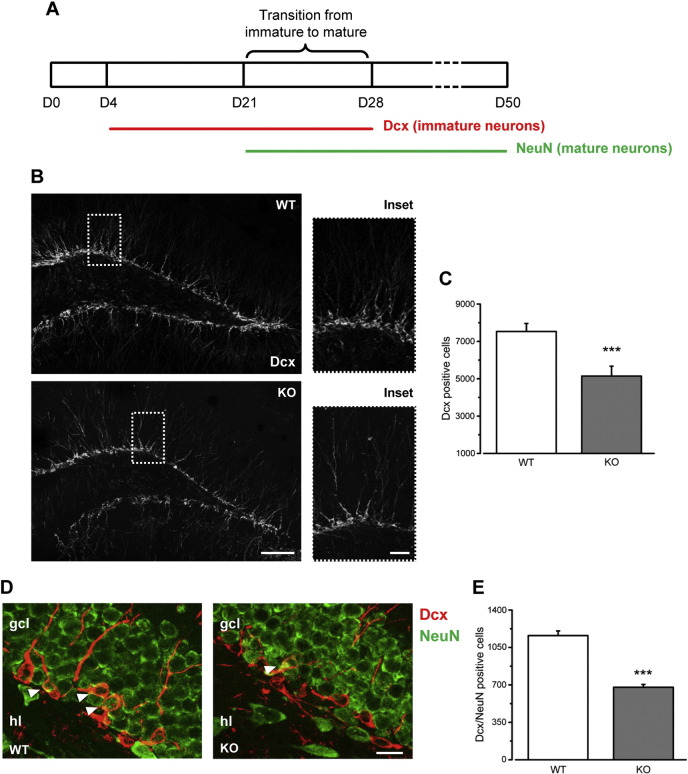
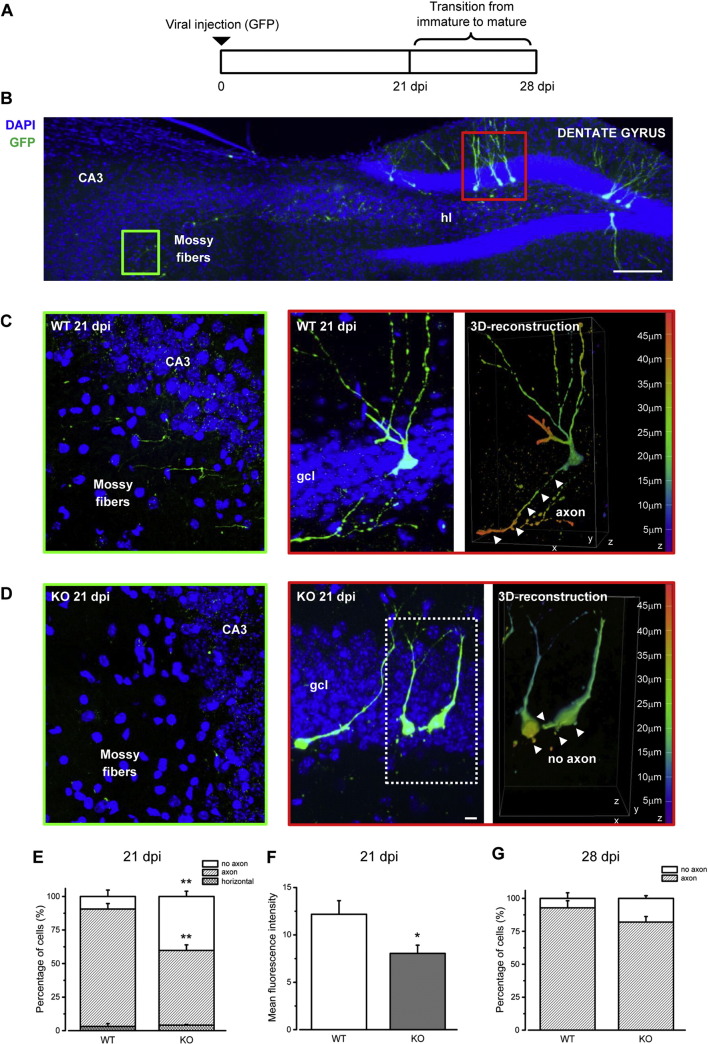
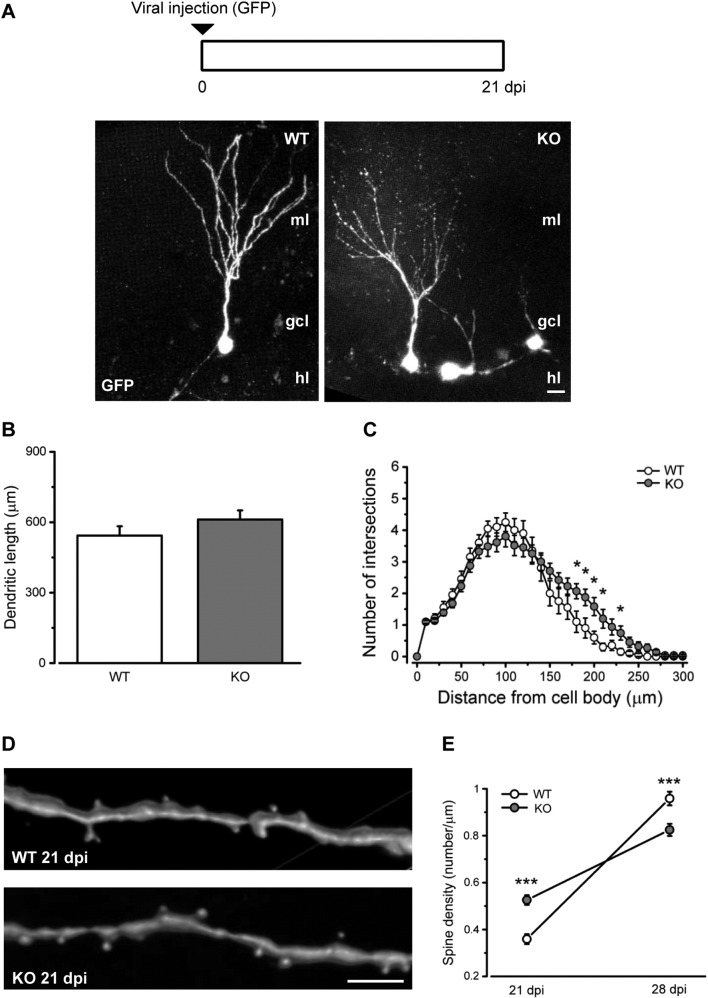
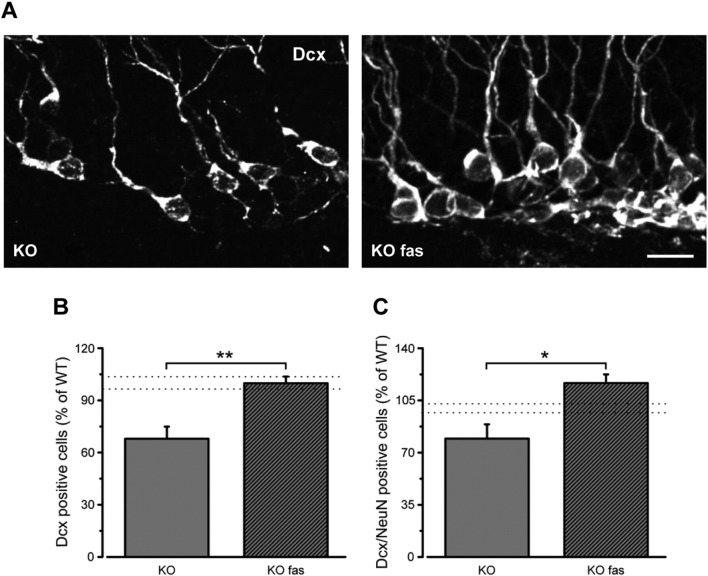
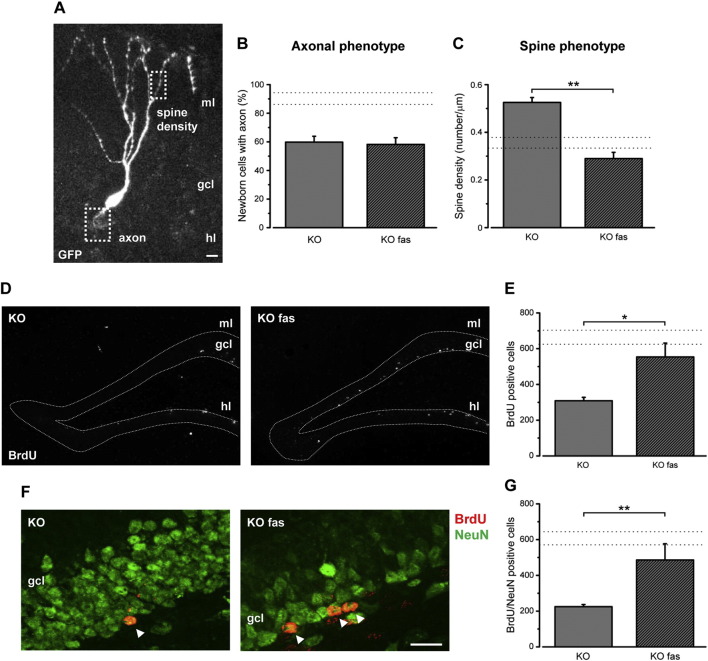
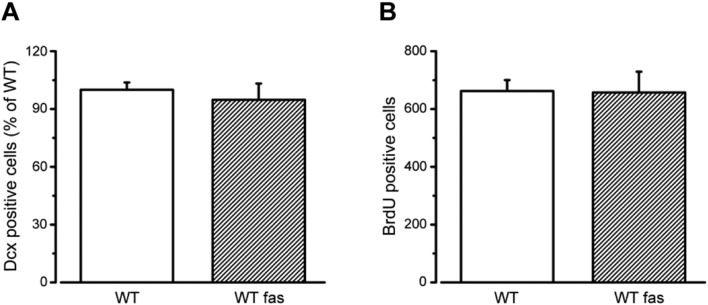
Oligophrenin-1 (OPHN1) is a Rho GTPase activating protein whose mutations cause X-linked intellectual disability (XLID). How loss of function of Ophn1 affects neuronal development is only partly understood. Here we have exploited adult hippocampal neurogenesis to dissect the steps of neuronal differentiation that are affected by Ophn1 deletion. We found that mice lacking Ophn1 display a reduction in the number of newborn neurons in the dentate gyrus. A significant fraction of the Ophn1-deficient newly generated neurons failed to extend an axon towards CA3, and showed an altered density of dendritic protrusions. Since Ophn1-deficient mice display overactivation of Rho-associated protein kinase (ROCK) and protein kinase A (PKA) signaling, we administered a clinically approved ROCK/PKA inhibitor (fasudil) to correct the neurogenesis defects. While administration of fasudil was not effective in rescuing axon formation, the same treatment completely restored spine density to control levels, and enhanced the long-term survival of adult-born neurons in mice lacking Ophn1. These results identify specific neurodevelopmental steps that are impacted by Ophn1 deletion, and indicate that they may be at least partially corrected by pharmacological treatment.

Keywords: Axon extension; Dendritic spines; Fasudil; Rho GTPase.


Figures

Supplementary Fig. 1
Dentate gyrus and hilus volume are not affected by Ophn1 deficiency. A) Representative images depict the dentate gyrus from WT (left) and KO animals (right) labeled with Hoechst dye. Scale bar: 100 μm. B) Stereological quantification of the granule cell layer (gcl) volume shows similar range values between WT and KO mice (WT, 0.29 ± 0.02, n = 4; KO, 0.31 ± 0.01; n = 7; two-tailed t-test, P = 0.67). C) The analysis of the total volume of the hilus shows no significant difference between WT and KO animals (WT, 0.29 ± 0.01, n = 4; KO, 0.30 ± 0.008; n = 7; Mann-Whitney rank sum test, P = 0.78). Histograms represent mean ± SEM.
Fig. 1
Fig. 1
Impaired adult hippocampal neurogenesis in Ophn1 KO mice. A) Schematic of BrdU labeling experiments. To evaluate proliferation (i.e. number of BrdU-positive cells at 1 dpi), mice received 2 BrdU injections spaced by 2 h and were sacrificed after 24 h. For the analyses at 15 and 50 dpi, we performed 4 BrdU injections every 2 h at day 0. B) Representative images of BrdU labeling in the dentate gyrus of WT and KO mice at 50 dpi. Dorsal is up and medial is to the left. Scale bar: 100 μm; ml, molecular layer; gcl, granule cell layer; hl, hilus. C) Stereological counting of BrdU-positive cells in the DG of WT and KO mice shows that proliferation is not affected by Ophn1 deficiency at 1 dpi (WT, 1517 ± 40, n = 4; KO, 1294 ± 118, n = 4; two-tailed Student's t-test, P = 0.12). D) The quantification of BrdU positive cells at 15 dpi indicates that the early stage of neurogenesis is similar between the two groups (WT, 1281 ± 232, n = 4; KO, 968 ± 205, n = 3; two-tailed Student's t-test, P = 0.37). E) Survival of newly generated cells is significantly reduced at 50 dpi (WT, 662 ± 38, n = 11; KO, 309 ± 18, n = 8; Mann-Whitney rank sum test, P < 0.0001). F) Representative images of the granule cell layer (gcl) stained for both BrdU (red) and NeuN (green) at 50 dpi in the DG of WT mice (left) and KO animals (right). Arrowheads indicate double stained cells. Dorsal is up and medial is to the left. Scale bar: 20 μm. G) Stereological quantification of BrdU/NeuN double stained cells at 50 dpi shows reduced numbers of mature neuronal cells in KO mice respect to the control group (WT, 601 ± 40, n = 4; KO, 224 ± 12, n = 4; Mann-Whitney rank sum test, P = 0.028). Histograms represent mean ± SEM. Statistical significance, *P < 0.05; ***P < 0.001.
Fig. 2
Fig. 2
Reduced number of Dcx-positive cells in Ophn1 KO mice. A) Schematic of newborn cell maturation. Neural progenitors express Dcx from day (D) 4 to D28. Dcx-positive cells undergo a morphological and physiological maturation with the expression of NeuN upon final maturation. B) Representative immunoreactivity for Dcx in the DG of WT (top) and KO (bottom) mice. Dorsal is up and medial is to the right; ml, molecular layer; gcl, granule cell layer; hl, hilus. Scale bar: 100 μm (insets, 40 μm). C) Stereological counting of the total number of Dcx-positive cells reveals a strong reduction in the DG of KO mice with respect to controls (WT, 7531 ± 428, n = 8; KO, 5144 ± 530, n = 7; two-tailed t-test, P = 0.001). D) Representative immunolabeling for Dcx (red) and NeuN (green) in the hippocampus of WT and KO mice (arrowheads point to double stained cells). Scale bar = 20 μm. E) Stereological quantification of early neuronal cells double labeled for both Dcx and NeuN in the hippocampal DG shows a significant reduction in KO (grey) mice in comparison to WT (white) animals (WT, 1161 ± 44, n = 4; KO, 678 ± 26, n = 3; two-tailed t-test, P = 0.0003). Histograms represent mean ± SEM. Statistical significance, ***P ≤ 0.001.
Fig. 3
Fig. 3
Ophn1 regulates axon formation in adult newborn neurons. A) Schematics of the experimental paradigm. Retroviral vectors expressing GFP were injected in the dentate gyrus of WT and KO animals, and mice perfused immediately before (21 dpi) and after (28 dpi) conversion from immature to mature neurons. B) Coronal section of the mouse hippocampus showing adult-generated neurons transduced with GFP-retrovirus in the granule cell layer (gcl), extending dendrites in the molecular layer (ml) of the dentate gyrus and axons through the hilus (hl) towards the CA3 area. Ventral is up and medial is to the right. Scale bar: 100 μm. C) Left panel shows confocal image of mossy fibers from GFP-labeled newborn neuron from a WT mouse reaching the CA3 area (green box) at 21 dpi. Right panel shows confocal image (red box) of one axon extending from GFP-labeled newborn neurons. D) Confocal images from KO mice as in C. Three dimensional reconstructions display axons exceeding z axes (WT) or short processes not exceeding z axes (KO; z = 45 μm); pseudocolor measures z distance. E) Histogram depicts percentage of newborn neurons with single axon, no axon or horizontally oriented at 21 dpi in WT and KO mice (WT with axon, 90.6 ± 4.1% and WT without axon, 6.25 ± 4.7%, n = 3 mice; KO with axon, 59.8 ± 4.15% and KO without axon, 36 ± 3.9%, n = 4 mice; two-tailed t-test, P = 0.003 and P = 0.004, respectively). F) Histogram depicts quantification of mean fluorescence intensity of fibers reaching CA3 area at 21 dpi (WT 12.18 ± 1.43, n = 6 slices from 3 mice; KO 8.05 ± 0.87, n = 6 slices from 3 mice; two-tailed t-test, P = 0.032). G) Histogram depicts percentage of newborn neurons with single axon or no axon at 28 dpi (WT with axon, 92.8 ± 5.3%, n = 3 mice; KO with axon, 82 ± 4.1%, n = 4 mice; two-tailed t-test, P = 0.16). Histograms represent mean ± SEM. Statistical significance, *P < 0.05, **P < 0.01.
Fig. 4
Fig. 4
Dendritic complexity and spine density are regulated by Ophn1 in adult born neurons. A) Top, schematic of the experimental protocol. Bottom, representative confocal images depict newborn neurons morphology from the two different genotypes (ml: molecular layer; gcl: granule cell layer; hl: hilus). Scale bar: 10 μm. B) Total dendritic length of newborn neurons is similar for both groups (WT, 543.3 ± 39.2, n = 22 cells; KO, 611.4 ± 38.9, n = 31 cells; two-tailed t-test, P = 0.23). C) Sholl analysis of the dendritic arbors shows a slightly increased complexity 180–230 μm from the cell soma in KO mice (WT, n = 20 cells; KO, n = 31 cells; Two-way RM ANOVA, P < 0.0001, followed by Holm-Sidak test, P < 0.05). D) Representative images show 3D reconstruction of dendritic segments and protrusions of WT and KO newborn neurons at 21 dpi. Scale bar = 5 μm. E) Quantification of spine density expressed as the number of protrusions per micrometer of dendritic segment length at 21 and 28 dpi in WT and KO mice (21 dpi: WT, 0.36 ± 0.02, n = 32 dendritic segments; KO, 0.53 ± 0.02, n = 35 dendritic segments; two-tailed t-test, P < 0.0001; 28 dpi: WT, 0.96 ± 0.03, n = 42; KO, 0.82 ± 0.03, n = 50; two-tailed t-test, P < 0.001). Graphs represent mean ± SEM. Statistical significance, *P < 0.05, ***P ≤ 0.001.
Fig. 5
Fig. 5
Fasudil treatment rescues the population of Dcx-positive cells in Ophn1 KO mice. A) Representative images of hippocampal coronal sections (dorsal is up and medial is to the right) showing Dcx labeling in the DG of naïve KO mice (left) and KO animals treated with fasudil for 7 weeks (KO fas, right). Scale bar: 20 μm. B) Stereological counts show that fasudil administration rescues the total number of Dcx positive cells in the DG of KO mice (percentage of WT: KO, 67.9 ± 6.9%, n = 7; KO + fasudil, 99.8 ± 3.8%, n = 5; two-tailed t-test, P = 0.002). Data are expressed as percentage of the WT group (n = 13; the range values of WT mice is indicated by the dotted lines). C) Graph indicates the proportion of early neuronal cells (Dcx-NeuN double labeled) over the total sample of Dcx-positive cells in KO naïve mice and upon fasudil treatment (KO, 79.3 ± 9.6%, n = 3; KO + fasudil, 116.6 ± 5.7%, n = 3; two-tailed t-test, P = 0.029). Data are expressed as percentage of the WT group (n = 8; the range values of WT mice is indicated by the dotted lines). Histograms represent mean ± SEM. Statistical significance, *P < 0.05, **P < 0.01.
Fig. 6
Fig. 6
Fasudil treatment rescues the dendritic phenotype and promotes long-term survival of newly generated neurons in Ophn1 KO mice. A) Confocal image depicts a representative GFP-labeled newborn neuron at 21 dpi, analyzed for axonal phenotype and spine density. B) Percentage of newborn neurons displaying an axon in vehicle- and fasudil-treated KO mice. No difference is detectable between the two groups (KO, 59.8 ± 4.1%, n = 4 mice; KO + fasudil, 58.2 ± 4.6%, n = 3; two-tailed t-test, P = 0.808). C) Spine density of newborn neurons (21 dpi) is significantly reduced by fasudil administration (KO, 0.53 ± 0.02, n = 35 dendritic segments; KO + fasudil, 0.29 ± 0.02, n = 15 dendritic segments; two-tailed t-test, P = 0.005). D) Representative low magnification images of hippocampal coronal sections stained for BrdU at 50 dpi in the DG of KO animals (left) and KO animals treated with fasudil (KO fas, right). Dorsal is up and medial is to the left. Scale bar: 100 μm; gcl, granule cell layer; hl, hilus; ml, molecular layer. E) Stereological counts show that 7 weeks of fasudil treatment significantly increases BrdU-positive newly generated cells in KO mice 50 dpi (KO, 309 ± 18, n = 8; KO + fasudil, 554 ± 77, n = 6; Mann-Whitney rank sum test, P = 0.029). F) Representative images of the gcl stained for both BrdU (red) and NeuN (green) at 50 dpi in KO mice (left) and KO animals treated with fasudil for 7 weeks (KO fas, right). Arrowheads indicate double stained cells. Dorsal is up and medial is to the left. Scale bar: 20 μm. G) The total number of BrdU/NeuN double labeled cells at 50 dpi is at least partially rescued in KO mice upon fasudil treatment (KO, 224 ± 12, n = 4; KO fas, 485 ± 91, n = 5; Mann-Whitney rank sum test, P = 0.015). Histograms represent mean ± SEM and the dotted lines indicate the range values of the WT group. Statistical significance, *P ≤ 0.05, **P ≤ 0.01.
Fig. 7
Fig. 7
Fasudil treatment per se does not affect adult hippocampal neurogenesis in WT mice. A) Stereological counts in WT animals show that the percentage of Dcx-positive cells is unaffected upon 7 weeks of fasudil treatment (WT, 100 ± 3.8, n = 5; WT + fasudil, 94.7 ± 8.4, n = 3; two-tailed t-test, P = 0.539). Data are expressed as percentage of the control group (WT). B) Quantification of the total number of mature newborn neurons (50 dpi) shows that vehicle- and fasudil-treated WT mice display a similar range of BrdU-positive cells (WT, 662 ± 38, n = 11; WT + fasudil, 657 ± 72, n = 4; two-tailed t-test, P = 0.946). Histograms represent mean ± SEM.

Similar articles

Cited by

References

    1. Akers K.G., Martinez-Canabal A., Restivo L., Yiu A.P., De Cristofaro A., Hsiang H.L., Wheeler A.L., Guskjolen A., Niibori Y., Shoji H., Ohira K., Richards B.A., Miyakawa T., Josselyn S.A., Frankland P.W. Hippocampal neurogenesis regulates forgetting during adulthood and infancy. Science. 2014;344:598–602. - PubMed
    1. Bergami M., Rimondini R., Santi S., Blum R., Gotz M., Canossa M. Deletion of Trkb in adult progenitors alters newborn neuron integration into hippocampal circuits and increases anxiety-like behavior. Proc. Natl. Acad. Sci. U. S. A. 2008;105:15570–15575. - PMC - PubMed
    1. Bergami M., Vignoli B., Motori E., Pifferi S., Zuccaro E., Menini A., Canossa M. Trkb signaling directs the incorporation of newly generated periglomerular cells in the adult olfactory bulb. J. Neurosci. 2013;33:11464–11478. - PMC - PubMed
    1. Bergami M., Masserdotti G., Temprana S.G., Motori E., Eriksson T.M., Gobel J., Yang S.M., Conzelmann K.K., Schinder A.F., Gotz M., Berninger B. A critical period for experience-dependent remodeling of adult-born neuron connectivity. Neuron. 2015;85:710–717. - PubMed
    1. Billuart P., Bienvenu T., Ronce N., Des Portes V., Vinet M.C., Zemni R., Carrie A., Beldjord C., Kahn A., Moraine C., Chelly J. Oligophrenin 1 encodes a rho-gap protein involved in X-linked mental retardation. Pathol. Biol. (Paris) 1998;46:678. - PubMed

MeSH terms

LinkOut - more resources