

Changes in the Prevalence of Hepatitis C Virus Infection, Nonalcoholic Steatohepatitis, and Alcoholic Liver Disease Among Patients With Cirrhosis or Liver Failure on the Waitlist for Liver Transplantation
- PMID: 28088461
- PMCID: PMC5367965
- DOI: 10.1053/j.gastro.2017.01.003
Changes in the Prevalence of Hepatitis C Virus Infection, Nonalcoholic Steatohepatitis, and Alcoholic Liver Disease Among Patients With Cirrhosis or Liver Failure on the Waitlist for Liver Transplantation
Abstract
Background & aims: Concurrent to development of more effective drugs for treatment of hepatitis C virus (HCV) infection, there has been an increase in the incidence of nonalcoholic fatty liver disease. Data indicate that liver transplantation prolongs survival times of patient with acute hepatitis associated with alcoholic liver disease (ALD). We compared data on disease prevalence in the population with data from liver transplantation waitlists to evaluate changes in the burden of liver disease in the United States.
Methods: We collected data on the prevalence of HCV from the 2010 and 2013-2014 cycles of the National Health and Nutrition Examination Survey. We also collected data from the HealthCore Integrated Research Database on patients with cirrhosis and chronic liver failure (CLF) from 2006 through 2014, and data on patients who received transplants from the United Network for Organ Sharing from 2003 through 2015. We determined percentages of new waitlist members and transplant recipients with HCV infection, stratified by indication for transplantation, modeling each calendar year as a continuous variable using the Spearman rank correlation, nonparametric test of trends, and linear regression models.
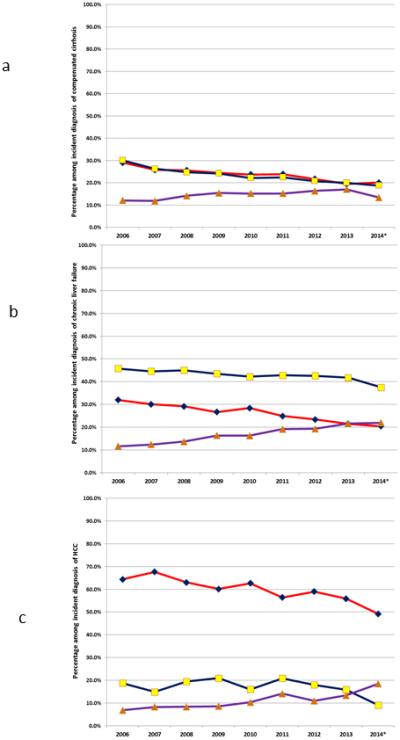
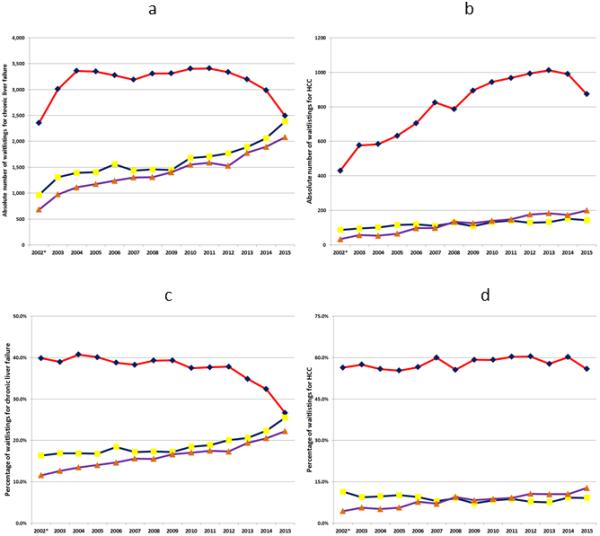
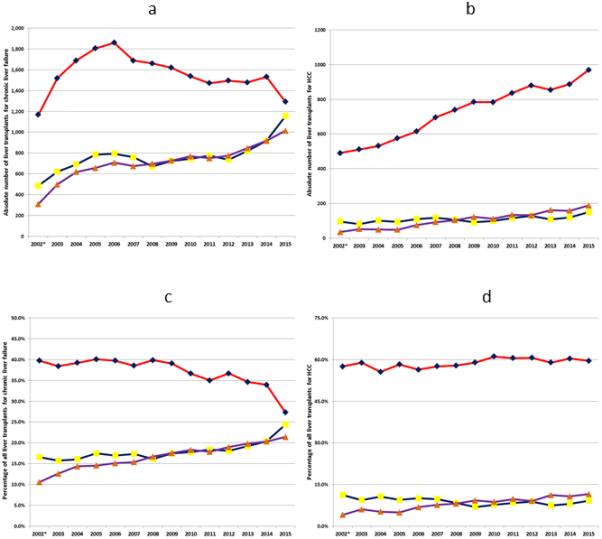
Results: In an analysis of data from the National Health and Nutrition Examination Survey (2013-2014), we found that the proportion of patients with a positive HCV antibody who had a positive HCV RNA was 0.5 (95% confidence interval, 0.42-0.55); this value was significantly lower than in 2010 (0.64; 95% confidence interval, 0.59-0.73) (P = .03). Data from the HealthCore database revealed significant changes (P < .05 for all) over time in percentages of patients with compensated cirrhosis (decreases in percentages of patients with cirrhosis from HCV or ALD, but increase in percentages of patients with cirrhosis from nonalcoholic steatohepatitis [NASH]), CLF (decreases in percentages of patients with CLF from HCV or ALD, with an almost 3-fold increase in percentage of patients with CLF from NASH), and hepatocellular carcinoma (HCC) (decreases in percentages of patients with HCC from HCV or ALD and a small increase in HCC among persons with NASH). Data from the United Network for Organ Sharing revealed that among patients new to the liver transplant waitlist, or undergoing liver transplantation, for CLF, there was a significant decrease in the percentage with HCV infection and increases in percentages of patients with nonalcoholic fatty liver disease or ALD. Among patients new to the liver transplant waitlist or undergoing liver transplantation for HCC, proportions of those with HCV infection, nonalcoholic fatty liver disease, or ALD did not change between 2003 and 2015.
Conclusions: In an analysis of 3 different databases (National Health and Nutrition Examination Survey, HealthCore, and United Network for Organ Sharing), we found the proportion of patients on the liver transplant waitlist or undergoing liver transplantation for chronic HCV infection to be decreasing and fewer patients to have cirrhosis or CLF. However, the percentages of patients on the waitlist or receiving liver transplants for NASH or ALD are increasing, despite different relative burdens of disease among the entire population of patients with cirrhosis.
Keywords: DAA Therapy; Obesity; Population Analysis; US.
Copyright © 2017 AGA Institute. Published by Elsevier Inc. All rights reserved.
Figures
References
-
- Ditah I, Ditah F, Devaki P, et al. The changing epidemiology of hepatitis C virus infection in the United States: National Health and Nutrition Examination Survey 2001 through 2010. J Hepatol. 2014;60(4):691–698. - PubMed
-
- Armstrong GL, Wasley A, Simard EP, McQuillan GM, Kuhnert WL, Alter MJ. The prevalence of hepatitis C virus infection in the United States, 1999 through 2002. Ann Intern Med. 2006;144(10):705–714. - PubMed
-
- Seeff LB. Natural history of chronic hepatitis C. Hepatology. 2002;36(5 Suppl 1):S35–46. - PubMed
-
- [December 9, 2014];FDA Approves Telaprevir for HCV. http://www.medscape.com/viewarticle/743192.
MeSH terms
Substances
Grants and funding
LinkOut - more resources
Full Text Sources
Other Literature Sources
Medical
Molecular Biology Databases
