. 2017 Mar 1:148:305-317.
doi: 10.1016/j.neuroimage.2017.01.003. Epub 2017 Jan 11.

Optimal trajectories of brain state transitions

Affiliations

Optimal trajectories of brain state transitions

Shi Gu et al. Neuroimage. .

Abstract

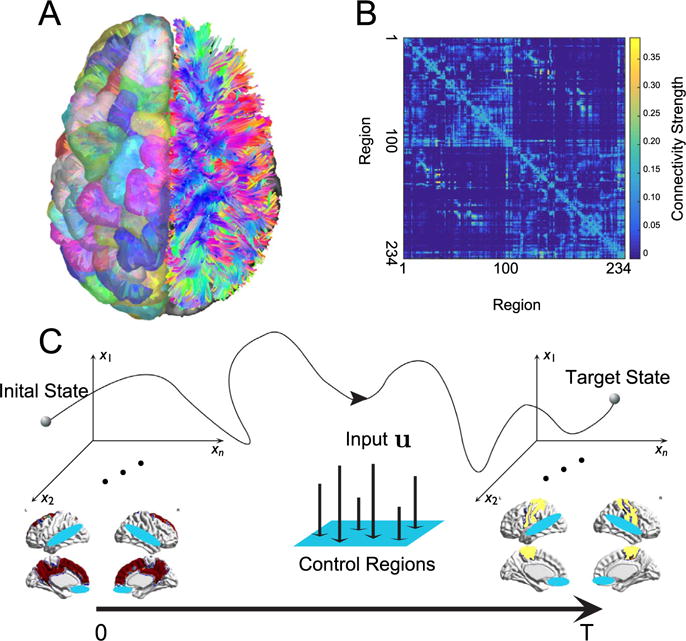
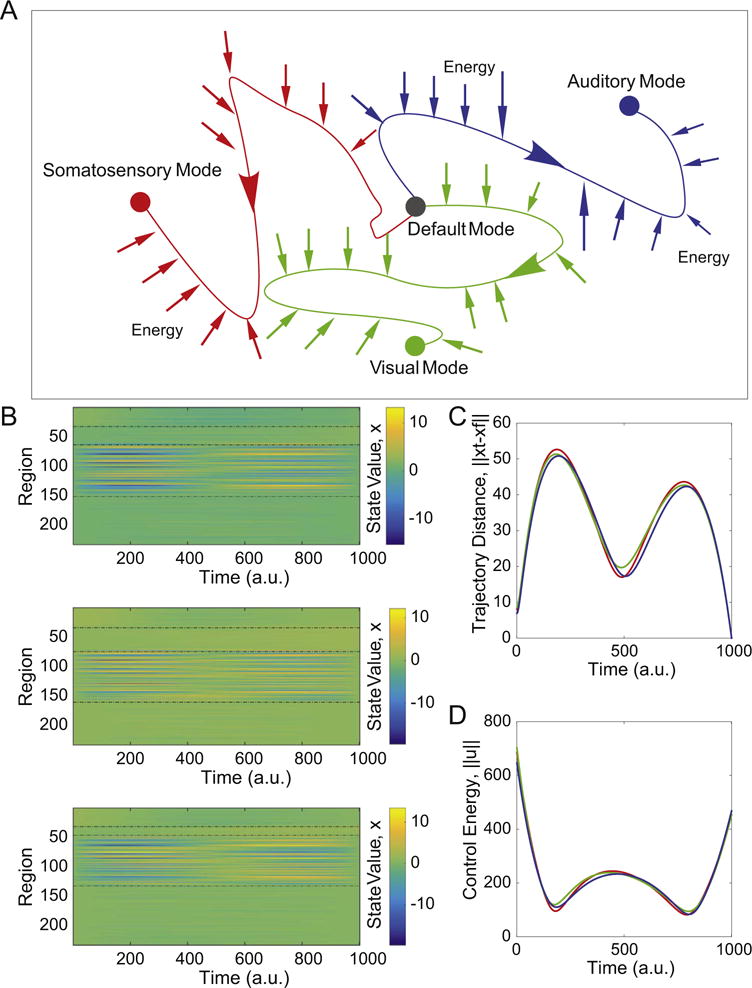
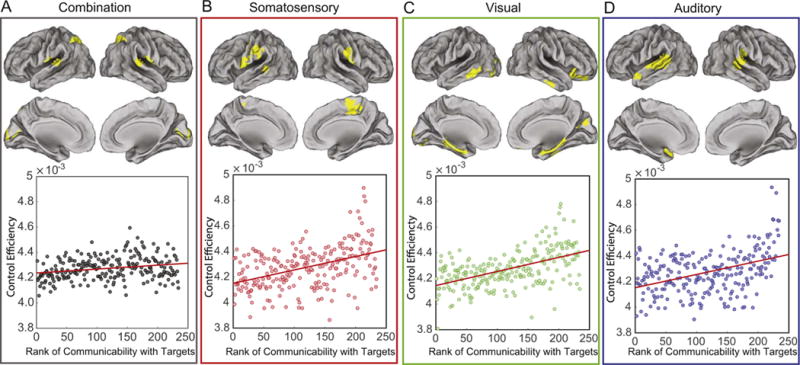
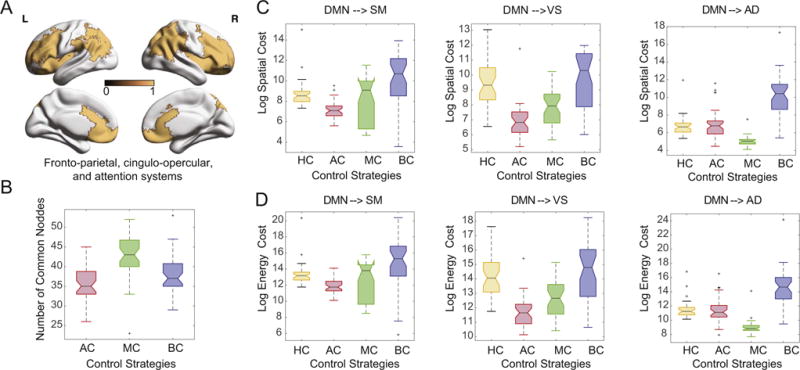
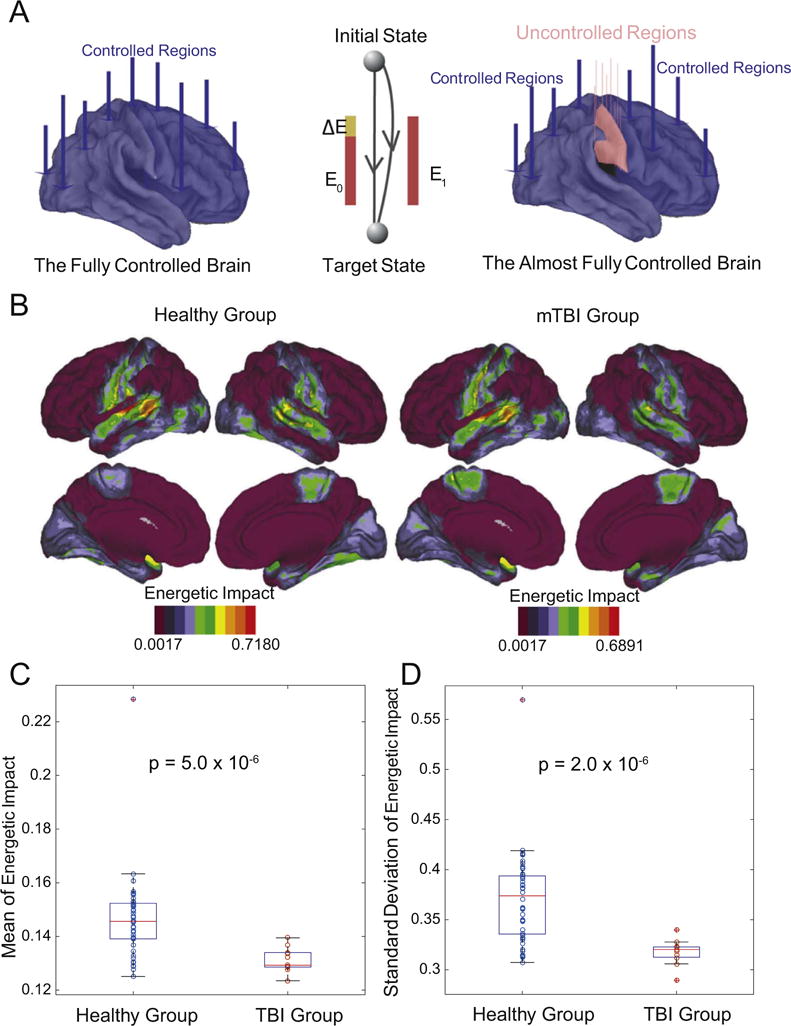
The complexity of neural dynamics stems in part from the complexity of the underlying anatomy. Yet how white matter structure constrains how the brain transitions from one cognitive state to another remains unknown. Here we address this question by drawing on recent advances in network control theory to model the underlying mechanisms of brain state transitions as elicited by the collective control of region sets. We find that previously identified attention and executive control systems are poised to affect a broad array of state transitions that cannot easily be classified by traditional engineering-based notions of control. This theoretical versatility comes with a vulnerability to injury. In patients with mild traumatic brain injury, we observe a loss of specificity in putative control processes, suggesting greater susceptibility to neurophysiological noise. These results offer fundamental insights into the mechanisms driving brain state transitions in healthy cognition and their alteration following injury.

Keywords: Cognitive control; Control theory; Diffusion imaging; Network neuroscience; Traumatic brain injury.


Conflict of interest statement

Conflict of interest

None declared.

Figures

Fig. 1
Fig. 1
Conceptual schematic. (A) Diffusion imaging data can be used to estimate connectivity from one voxel to any other voxel via diffusion tractography algorithms. (B) From the tractography, we construct a weighted network in which N=234 brain regions are connected by the quantitative anisotropy along the tracts linking them (see Methods). (C) We study the optimal control problem in which the brain starts from an initial state (red) at time t=0 and uses multi-point control (control of multiple regions; blue) to arrive at a target state (yellow) at time t = T.
Fig. 2
Fig. 2
Optimal control trajectories. (A) We study 3 distinct types of state transitions in which the initial state is characterized by high activity in the default mode system, and the target states are characterized by high activity in auditory (blue), extended visual (green), or motor (red) systems. (B) The activation profiles of all N=234 brain regions as a function of time along the optimal control trajectory, illustrating that activity magnitudes vary by region and by time. Activation can be either positive or negative, and the exact range of values will depend on the initial state, the target state, and the control set. Regions are listed in the following order: initial state, target state, controllers, and others. (C) The average distance from the current state x(t) to the target state x(T) as a function of time for the trajectories from the default mode system to the auditory, visual, and motor systems, illustrating behavior in the large state space. (D) The average control energy utilized by the control set as a function of time for the trajectories from the default mode system to the auditory, visual, and motor systems. The similarity of the curves observed in panels (C) and (D) is driven largely by the fact that they share the same control set. See Fig. S2(B) for additional information on the range of these control energy values along the trajectories. Colors representing target states are identical in panels (A), (C), and (D).
Fig. 3
Fig. 3
Structurally driven task preference for control regions. (A) Top: Regions with high control efficiency (see Eq. (21)) across all 3 state transitions: from the default mode to auditory, extended visual, and motor systems. Bottom: Scatterplot of the control efficiency with the average network communicability to all 3 target regions (Spearman correlation r = 0.27, p < 4.8 × 10⁻⁴). (B–D) Top: Regions with high control efficiency for the transition from default mode to (B) motor, (C) extended visual, and (D) auditory (r=0.36, p = 1.4 × 10⁻⁸) targets (top). Bottom: Scatter plot of control efficiency versus normalized network communicability with regions that are active in the target state: motor (r=0.42, p = 2.1 × 10⁻¹¹), extended visual (r=0.51, p = 1.1 × 10⁻¹⁶), and auditory (r=0.36, p = 1.4 × 10⁻⁸). Values of control efficiency in all four panels are averaged over subjects.
Fig. 4
Fig. 4
Regional roles in control tasks. (A) Cognitive control regions cover a broad swath of frontal and parietal cortex, including medial frontal cortex and anterior cingulate, and are defined as regions included in fronto-parietal, cingulo-opercular, and attention systems (Gu et al., 2015). (B) The number of these regions overlapping with the strongest 87 average, modal and boundary control hubs is approximately 50. Different choices of control strategies result in variation in both (C) trajectory cost and (D) energy cost. Here, HC refers to cognitive control regions, AC refers to average control hubs, MC refers to modal control hubs, and BC refers to boundary control hubs.
Fig. 5
Fig. 5
Specificity of control in health and following injury. (A) Theoretically, the brain is fully controllable when every region is a control point, but may not be fully controllable when fewer regions are used to affect control. (B) The regions with the highest values of energetic impact on control trajectories upon removal from the network, on average across subjects and tasks, were the supramarginal gyrus specifically, and the inferior parietal lobule more generally. In general, the healthy group and the mTBI group displayed similar anatomical patterns of energetic impact. (C) Magnitude and standard deviation of energetic impact averaged over regions and tasks; boxplots indicate variation over subjects. Even after removing the single outlier in the healthy group, patients with mTBI displayed significantly lower values of average magnitude of energetic impact (permutation test: p = 1.1 × 10⁻⁵) and lower values of the average standard deviation of energetic impact (p = 2.0 × 10⁻⁶) than healthy controls.

References

    1. Abdelnour F, Voss HU, Raj A. Network diffusion accurately models the relationship between structural and functional brain connectivity networks. Neuroimage. 2014;90:335–347. - PMC - PubMed
    1. Adachi Y, Osada T, Sporns O, Watanabe T, Matsui T, Miyamoto K, Miyashita Y. Functional connectivity between anatomically unconnected areas is shaped by collective network-level effects in the macaque cortex. Cerebral cortex. 2011 doi: 10.1093/cercor/bhr234. - DOI - PubMed
    1. Alavash M, Hilgetag CC, Thiel CM, Gießing C. Persistency and flexibility of complex brain networks underlie dual-task interference. Hum Brain Mapp. 2015;36:3542–3562. - PMC - PubMed
    1. Attwell D, Laughlin SB. An energy budget for signaling in the grey matter of the brain. J Cereb Blood Flow Metab. 2001;21:1133–1145. - PubMed
    1. Bassett DS, Brown JA, Deshpande V, Carlson JM, Grafton ST. Conserved and variable architecture of human white matter connectivity. Neuroimage. 2011a;54:1262–1279. - PubMed

Publication types

MeSH terms

LinkOut - more resources