. 2017 Apr 15;33(8):1179-1186.
doi: 10.1093/bioinformatics/btw777.

Scater: pre-processing, quality control, normalization and visualization of single-cell RNA-seq data in R

Affiliations

Scater: pre-processing, quality control, normalization and visualization of single-cell RNA-seq data in R

Davis J McCarthy et al. Bioinformatics. .

Abstract

Motivation: Single-cell RNA sequencing (scRNA-seq) is increasingly used to study gene expression at the level of individual cells. However, preparing raw sequence data for further analysis is not a straightforward process. Biases, artifacts and other sources of unwanted variation are present in the data, requiring substantial time and effort to be spent on pre-processing, quality control (QC) and normalization.

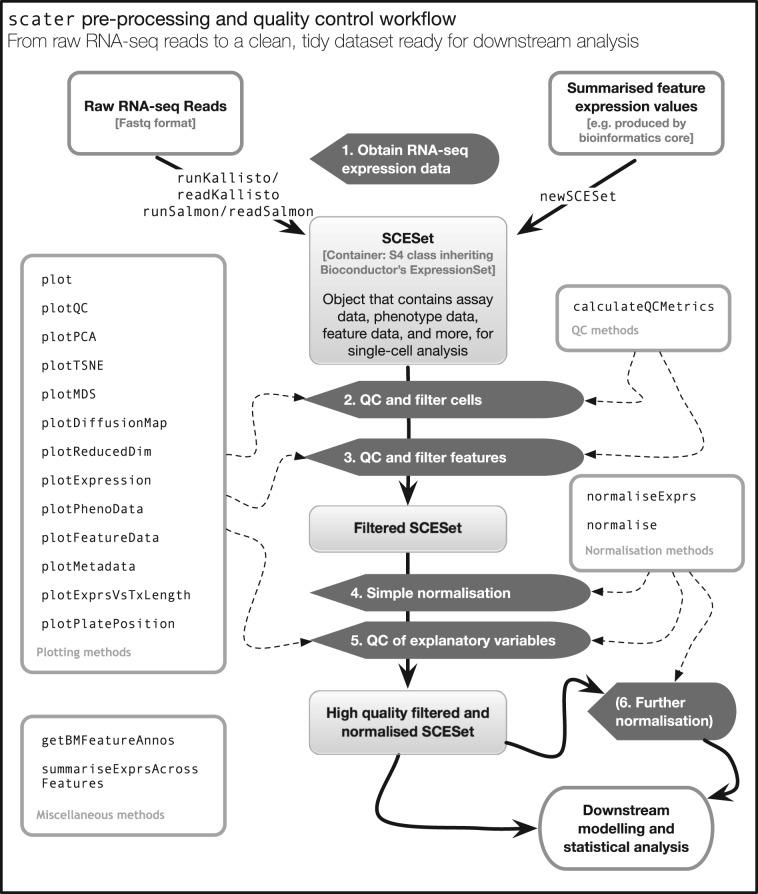
Results: We have developed the R/Bioconductor package scater to facilitate rigorous pre-processing, quality control, normalization and visualization of scRNA-seq data. The package provides a convenient, flexible workflow to process raw sequencing reads into a high-quality expression dataset ready for downstream analysis. scater provides a rich suite of plotting tools for single-cell data and a flexible data structure that is compatible with existing tools and can be used as infrastructure for future software development.

Availability and implementation: The open-source code, along with installation instructions, vignettes and case studies, is available through Bioconductor at http://bioconductor.org/packages/scater .

Contact: davis@ebi.ac.uk.

Supplementary information: Supplementary data are available at Bioinformatics online.


Figures

Fig. 1.
Fig. 1.
An overview of the scater workflow, from raw sequenced reads to a high quality dataset ready for higher-level downstream analysis. For step 5, explanatory variables include experimental covariates like batch, cell source and other recorded information, as well as QC metrics computed from the data. Step 6 describes an optional round of normalization to remove effects of particular explanatory variables from the data. Automated computation of QC metrics and extensive plotting functionality support the workflow
Fig. 2.
Fig. 2.
Different types of QC plots that can be generated with scater. (a) Cumulative expression plot showing the proportion of the library accounted for by the top 1–500 most highly expressed features. (b) PCA plot produced using a subset of the QC metrics computed with scater’s calculateQCMetrics function. (c) Plot of frequency of expression (percentage of cells in which the feature is deemed expressed) against mean expression level across cells. The vertical dotted line shows the median of the gene mean expression levels, and the horizontal dotted line indicates 50% frequency of expression. (d) Plot of the 20 most highly expressed features (computed according to the highest total read counts) across all cells in the dataset. For each feature, the circle represents the percentage of counts across all cells that correspond to that feature. The features are ordered by this value. The bars for each feature show the percentage of counts corresponding to the feature in each individual cell, providing a visualization of the distribution across cells. (e) Density plot showing the percentage of variance explained by a set of explanatory variables across all genes. Each individual plot is produced by a single call with either the function plot (a), plotPCA (b) or plotQC (c–e)
Fig. 3.
Fig. 3.
Reduced dimension representations of cells and gene expression plots with scater. Plots are shown using all genes (a–c) and cell cycle genes only (d–f) using PCA (a,d), t-SNE (b,e) and diffusion maps (c,f), where each point represents a cell. In the top row (a–c), points are coloured by patient of origin, sized by total features (number of genes with detectable expression) and the shape indicates the C1 machine used to process the cells. In the second row (d–f), points are coloured by the expression of CCND2 (a gene associated with the G1/S phase transition of the cell cycle) in each cell. Furthermore, with the plotExpression function, gene expression can be plotted against any cell metadata variables or the expression of another gene—here, expression for the CD86, IGH44 and IGHV4-34 genes in each cell is plotted against the patient of origin (g). The function automatically detects whether the x-axis variable is categorical or continuous and plots the data accordingly, with x-axis values ‘jittered’ to avoid excessive overplotting of points with the same x coordinate
Fig. 4.
Fig. 4.
Normalization and batch correction with scater. Principal component analysis plots showing cell structure in the first two PCA dimensions using various normalization methods that can be easily applied in scater, including endogenous size-factor normalization using methods from the scran package (a); expression residuals after applying size-factor normalization and regressing out known, unwanted sources of variation (b); and removal of one hidden factor identified using the RUVs method from the RUV package (c). In all plots, the colour of points is determined by the patient from which cells were obtained, shape is determined by the C1 machine used to process the cells and size reflects the total number of genes with detectable expression in the cell

References

    1. Amir E.A.D. et al. (2013) viSNE enables visualization of high dimensional single-cell data and reveals phenotypic heterogeneity of leukemia. Nat. Biotechnol., 31, 545–552. - PMC - PubMed
    1. Anders S., Huber W. (2010) Differential expression analysis for sequence count data. Genome Biol., 11, R106. - PMC - PubMed
    1. Anders S. et al. (2015) HTSeq–a Python framework to work with high-throughput sequencing data. Bioinformatics, 31, 166–169. - PMC - PubMed
    1. Angerer P. et al. (2015) destiny: diffusion maps for large-scale single-cell data in R. Bioinformatics, 32, 1241–1243. - PubMed
    1. Bendall S.C. et al. (2014) Single-cell trajectory detection uncovers progression and regulatory coordination in human B cell development. Cell, 157, 714–725. - PMC - PubMed